Are Probabilities Shifting?
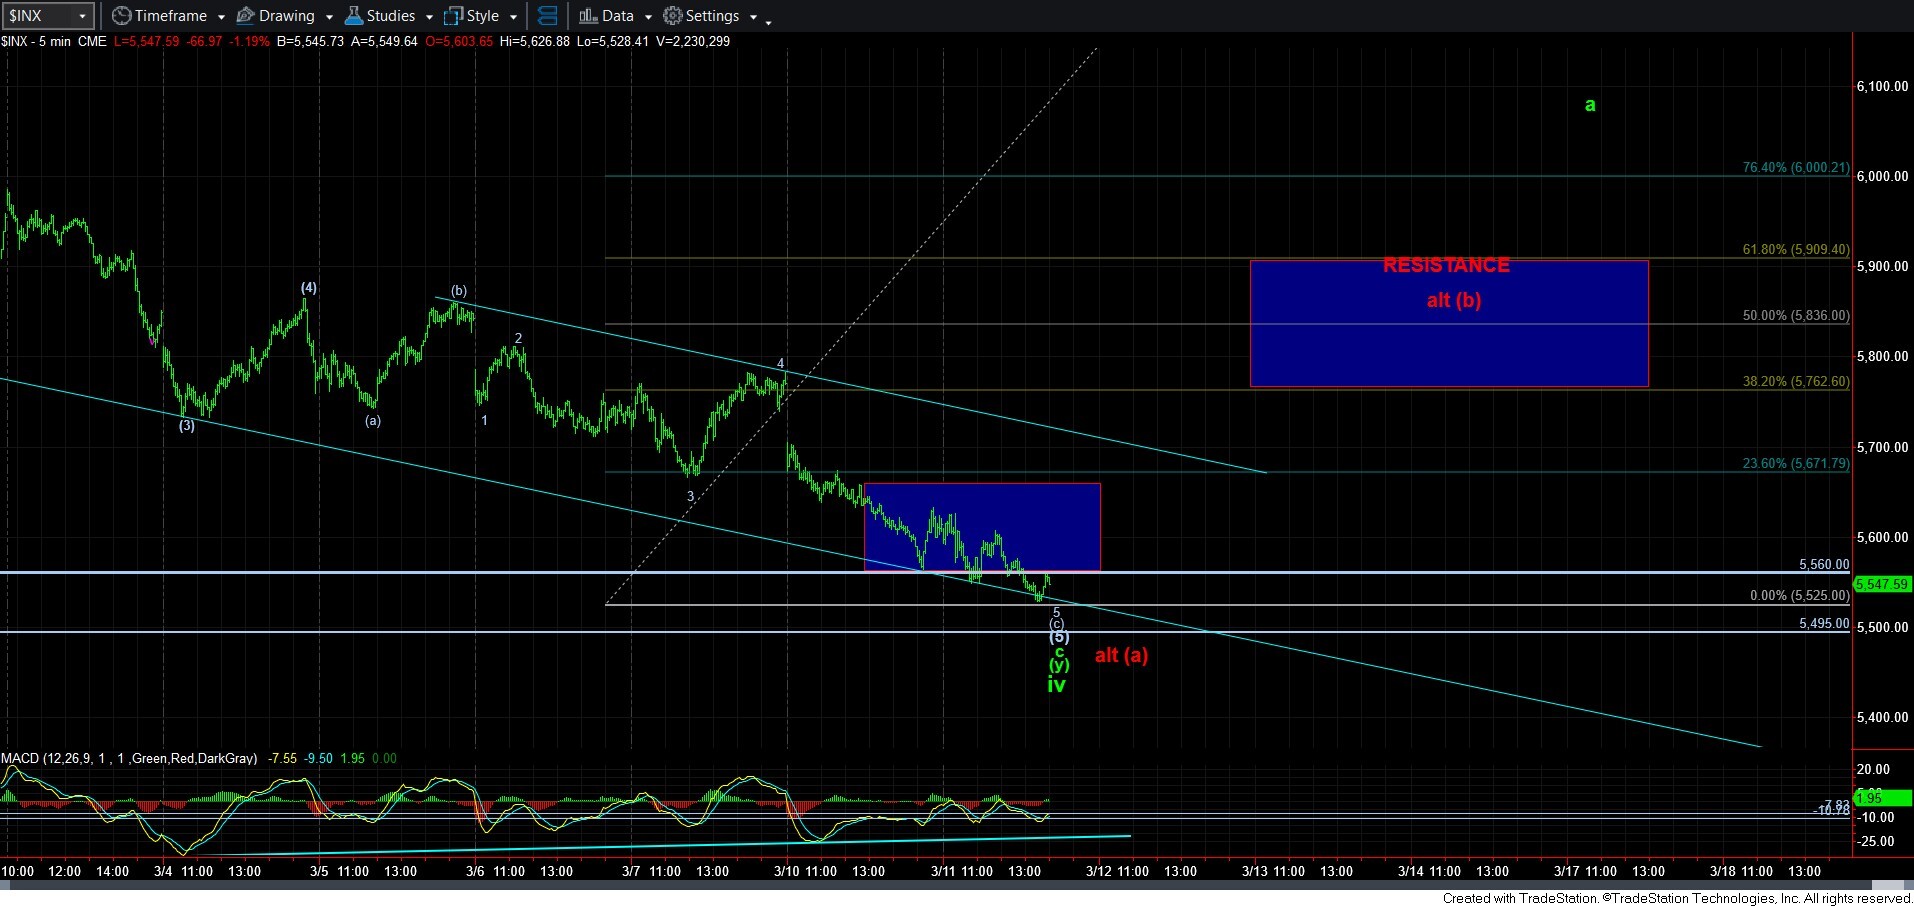
As I am writing this, the SPX is peeking below the support we have been watching so carefully. And, as I outlined before, this would increase the probability of the red count.
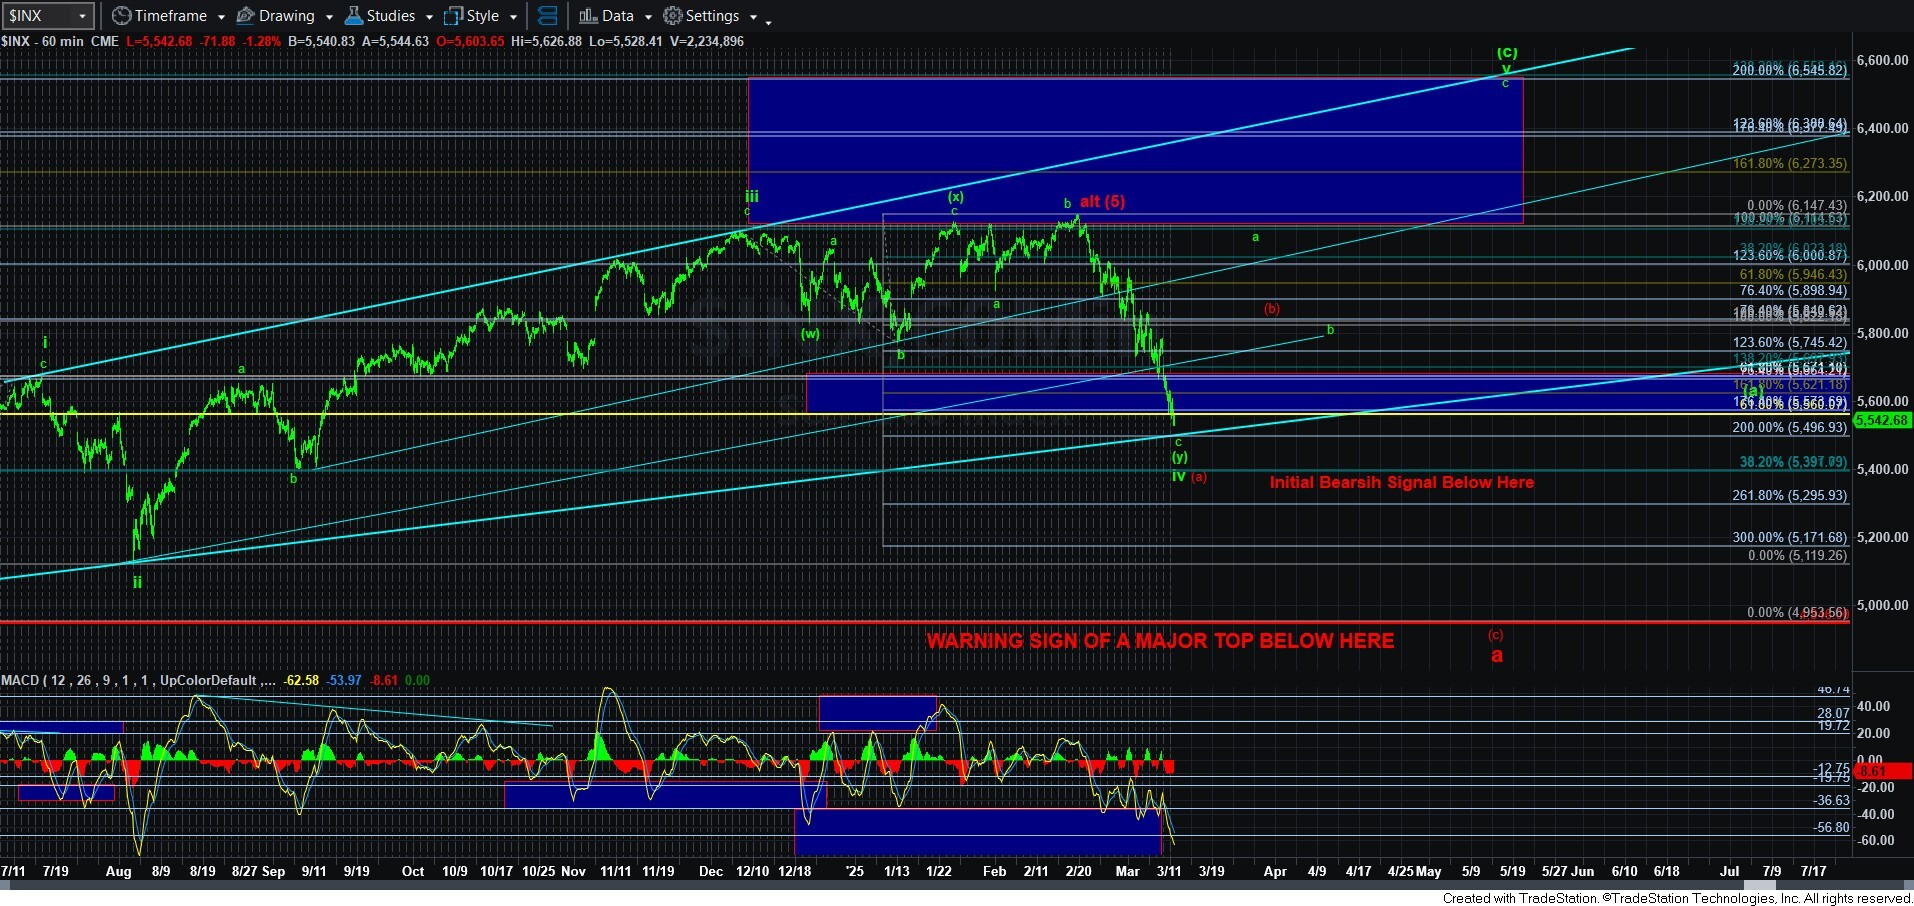
The next lower support is the in the 5495SPX region, wherein [y]=2.00*[w]. And, that is a sizeable extension in this decline, beyond which would be hard to entertain the green count. Also, take note that the bigger uptrend channel on the 60-minute chart is sitting in that same location. While I clearly did not want to see us breaking the 5550SPX level, I am going to give the green count a bit more room to that point. Yet, there is no doubt that the break of the 5550SPX support is a concern.
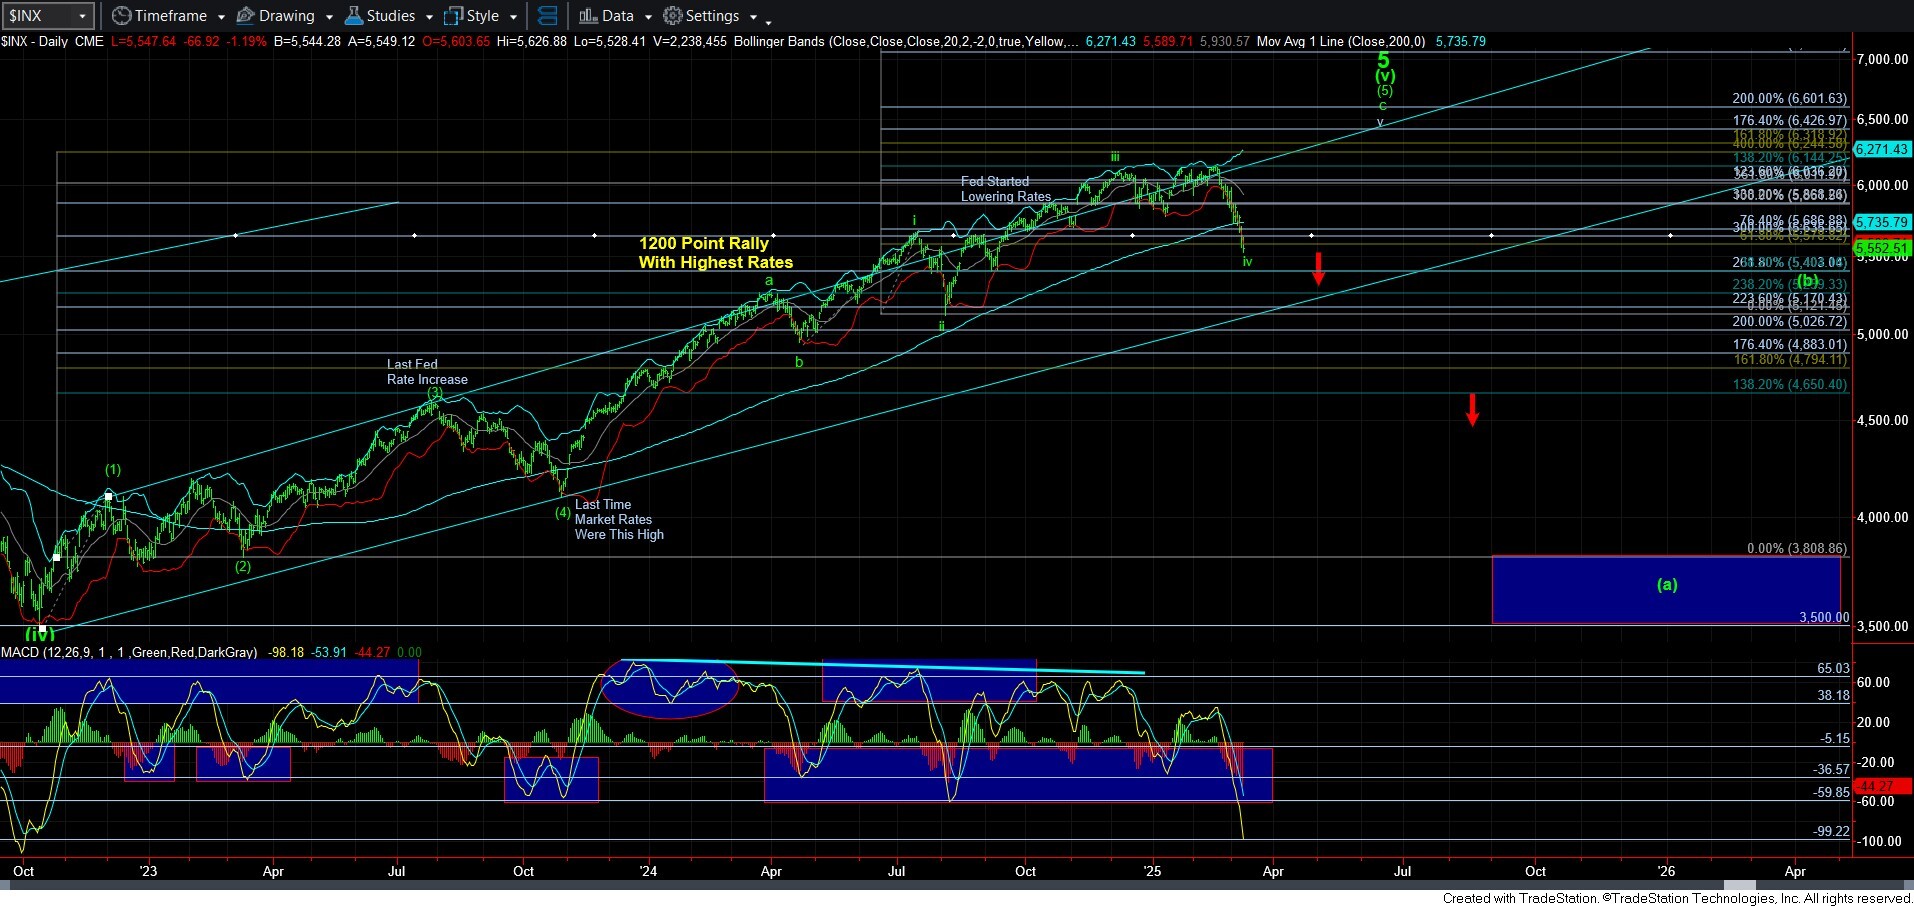
Another concern is that the 60-minute SPX MACD has now lost the positive divergence it was displaying thus far. Yet, we are now approaching the sold off levels last seen at the bottom of wave ii back in August of last year. And, the daily MACD is now at the levels last seen in 2022.
Clearly, the market is in a very treacherous posture. And, the resistance region I have now outlined on the 5-minute SPX chart has taken on much more prominence due to the break-down below 5550SPX. And, should we continue lower, then I would continue to move that resistance down. We will now need to break out through that resistance to make the green count gain again in probability. But, as long as we remain below that resistance, I am going to be a bit more cautious, especially if we see a 5-wave decline after a rally to that resistance box (wherever it may reside once we strike a bottom to this decline).
Personally, I will likely sell my long positions as we get to that resistance now, and then buy back long positions during a b-wave pullback should the a-wave complete back towards the prior highs and over the resistance box. And, I even may consider stopping out on a sustained break of the 5495SPX region.
For many months we had been struggling with the question as to whether we would get one more higher all-time high. And, should the market continue to increase the probability of the red count over the coming weeks, then I will be moving into the red count as my primary, with an alternative count being one more higher high which can still be seen from a bottom in the 5000-5200SPX region. But, breaking below that region, with follow-through below the 4500SPX region points us down to the 3800SPX region for the initial [a] wave of the long-term bear market we are expecting. At that point, I would likely go long for a multi-year [b] wave rally, and there would be no doubt in my mind that a long-term bear market has begun in earnest. But, that multi-year [b] wave will likely take us back north of 5000SPX, which will likely then set up a [c] wave crash in the years to come. You can see this set up on the monthly chart on the weekend analysis.
So, we are going to be taking this one step at a time, and I believe I have been quite transparent in my approaching the market in this manner. I will continue to do so as the market continues to subdivide over the coming weeks and as we glean more information regarding the long-term perspective of the overall market.
In summary, for now, the green count is being pushed to its limits in my view. And, either a sustained break of 5495SPX or a rally back to resistance followed by a 5-wave decline will force me to promote the red count as my primary count.
I also wanted to take a moment to explain why I am being so cautious on both sides of this market, and allowing the green count as much as room as reasonable before I start viewing the bear market as having begun. With the 3-wave structures we have been seeing for quite some time, it has not provided us with the strong indication that a major top has indeed been struck. For this reason, I have been very cautious before I suggest moving into a view that it is now time to be playing this market from the short side more aggressively, as this market has not been kind to short trades for many years. So, I will seek your patience for a bit longer until the market makes it abundantly clear that we are next going to be testing the 5000 region for our larger a-wave of the larger degree [a] wave of the bear market. How we handle the next bounce and pullback will likely provide a lot more clarity to this end.