At Resistance - Market Analysis for Mar 4th, 2025
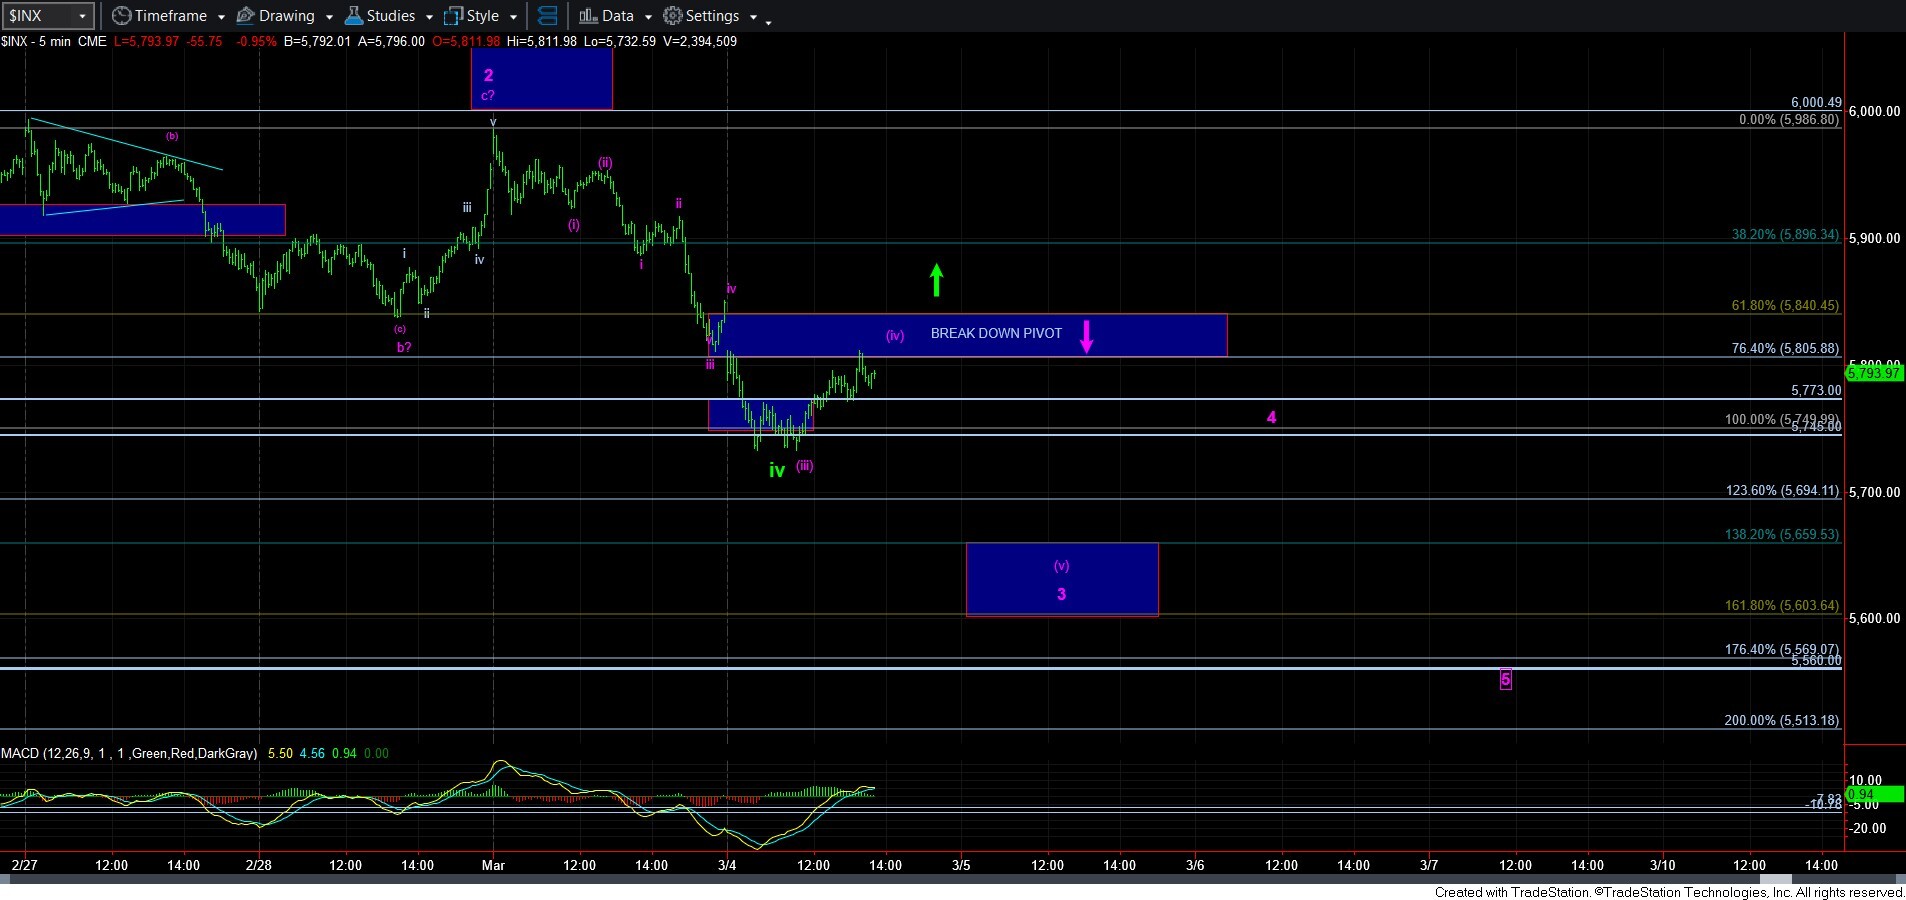
As I am writing this update, the SPX just barely held the support we set for today, and has now bounced back to the pivot resistance. And, this is the region that should tell us if the purple count will keep pressure to the downside, or if the market is going to make an attempt to begin wave v in green after a very convoluted 4th wave completes an unusual [w][x][y] pattern, even as those patterns go.
I sent out quite a number of alerts today in the main room, so I am going to repeat a number of them here, as they do provide the overall picture very well.
“I am sure many of you are questioning whether the marginally higher high we saw in mid February could satisfy the completed pattern in SPX, with the current action being the typical action we see after an ending diagonal completes. Of course, that is certainly possible. But, it is hard to rely on such a truncated view of a 5th wave especially when they are typically very strong moves up followed by even stronger moves down. I don't think we saw the type of strong move up that we would normally expect when we complete an ED.
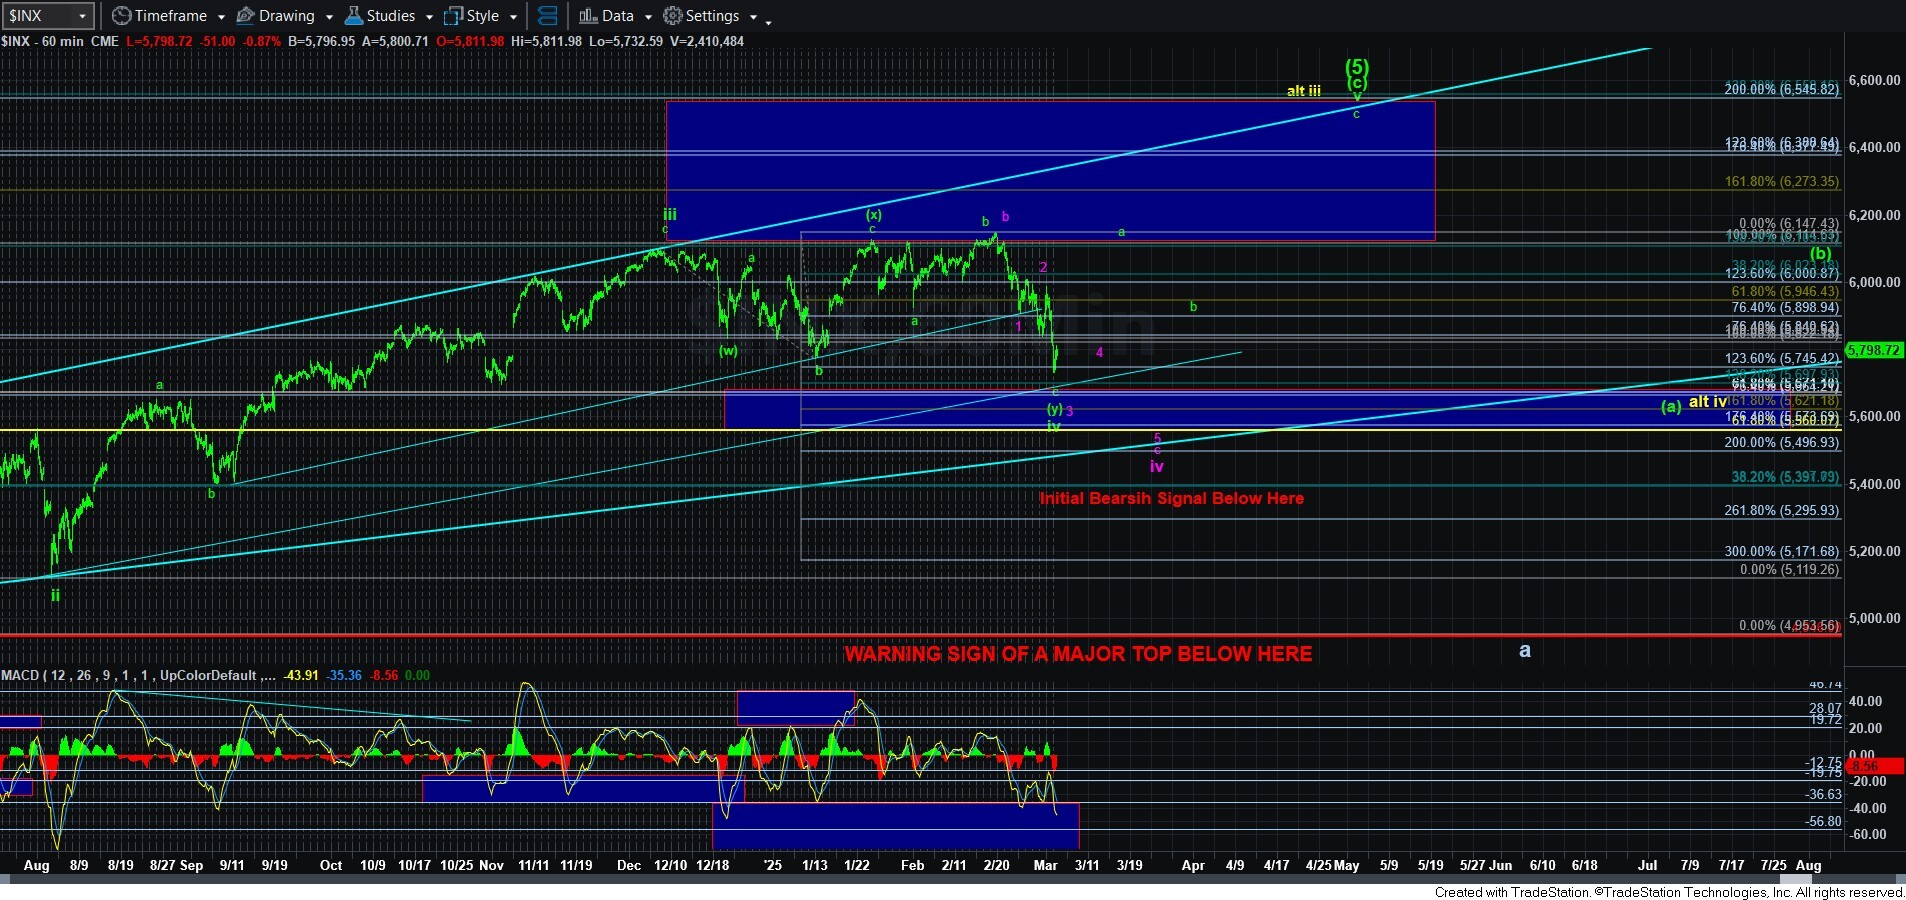
But, as I said, it is quite possible, especially since we are dealing with the potential for a VERY large degree top. Yet, in order to confirm that, we MUST break down below the support box that has been on our 60-minute chart for half a year, and then follow through below 5400SPX. That would suggest we are in the midst of a drop to the 5000 region for the a-wave of the initial a-b-c larger degree decline, which will ultimately target the 3500SPX region.
For now, I just do not have enough evidence to claim that a longer-term top has indeed been struck.”
********
“While the smaller degree technicals are trying to bottom out in SPX, I think this would be a good time to remind you that we are NOT looking for a 5-wave rally. Since we would only be starting a wave v in the bullish count, the rally will take shape as an a-b-c pattern, and the majority of a-waves take shape as a 3-wave structure. So, we will have to follow resistances on the way up AND ALL PULLBACKS must be corrective in nature in order to keep our focus higher. I have outlined this MANY times over the last 6 months. There is still a lot of risk in looking higher, but for now, I am going to keep that perspective until the market proves otherwise.”
*******
So, as the market is now testing our resistance, we will need to overcome this resistance to suggest that the green wave iv has indeed potentially bottomed. I will need follow through over yesterday’s high (5986SPX) to make this more likely.
As far as support below us, our next support is in the 5694-5697SPX region, with the 5697 region being the point at which [y]=1.382*[w] in the green pattern.
As I have also reiterated a number of times of late, take note that the MACD on the 60-minute chart is now in the region from which many prior larger rallies have begun . . . that is, assuming the uptrend has not yet completed. So, whether the market will subdivide lower based upon the purple count, or if the green count will complete this decline with a shorter drop will depend on the resistance noted on the 5-mintue chart. But, the ingredients are now in place for a 4th wave bottom to potentially develop. And, I am going to consider some long positions over the coming days.