B Wave Likely Underway
 By
By
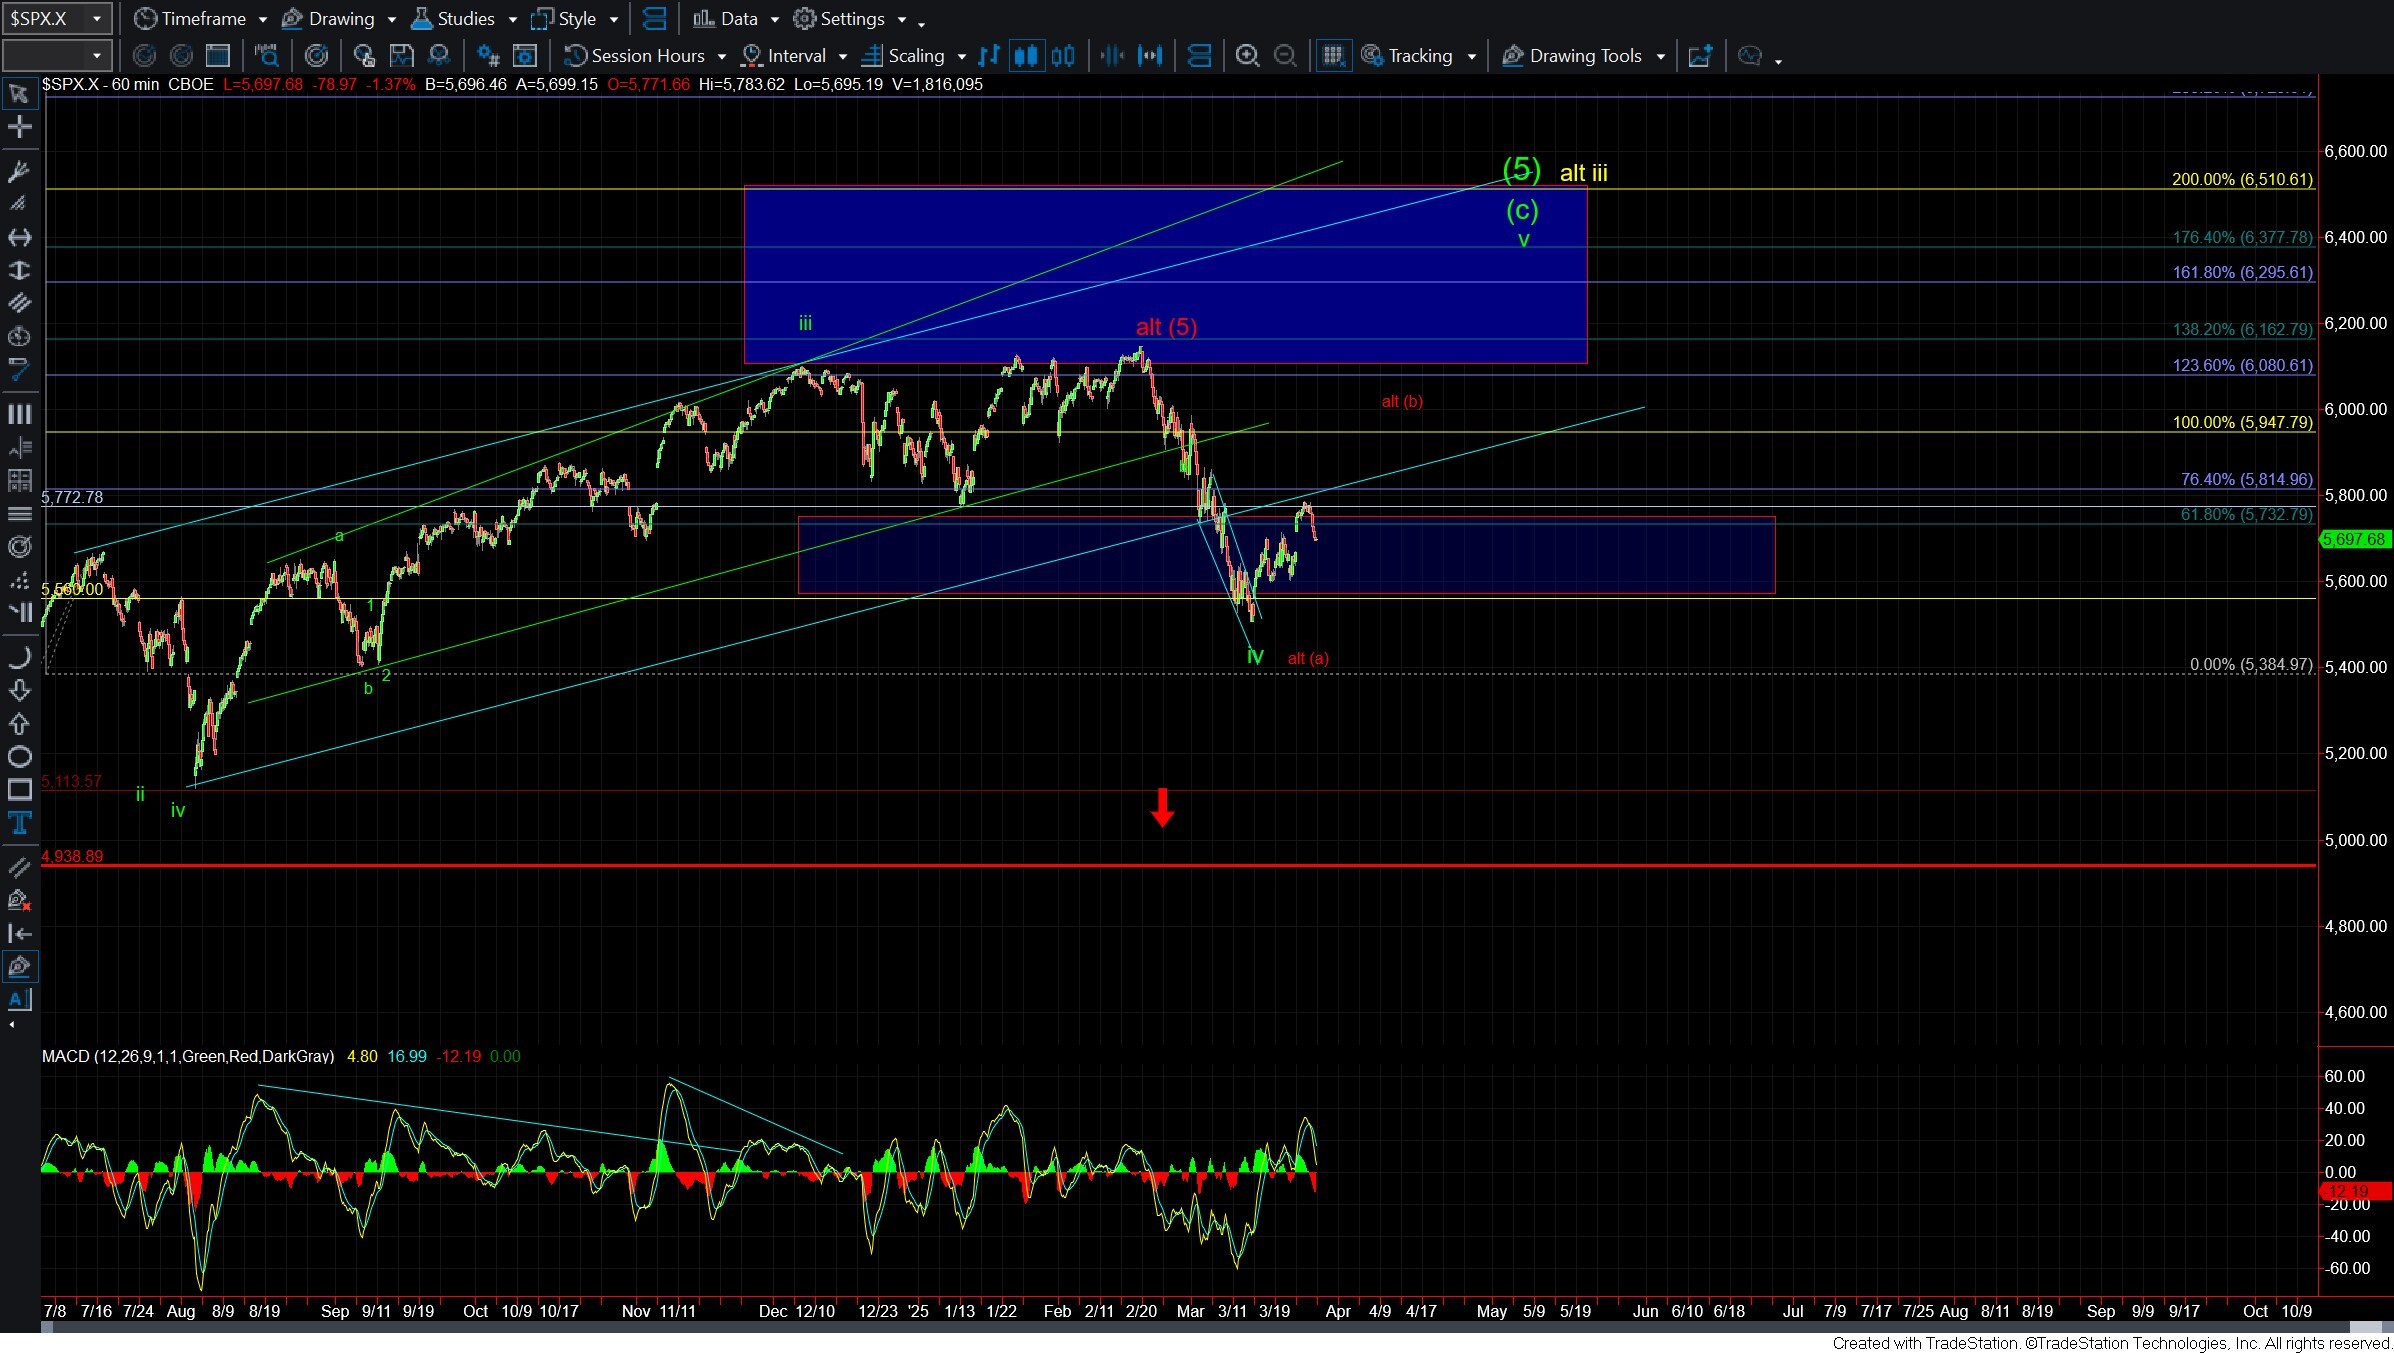
With the move down today below upper support we have likely topped in the initial move up off of the lows. The question we are now dealing with is whether that top was simply a wave (a) of a larger move higher or the top of the red wave b heading directly down to new lows. As of right now, my base case is that this was simply the top of a wave (a) with this move lower being part of a wave (b) lower. As long as we can remain over support for that potential wave (b) this will remain my base case. Should we begin to break that support, then it would open the door to see a move directly to new lows.
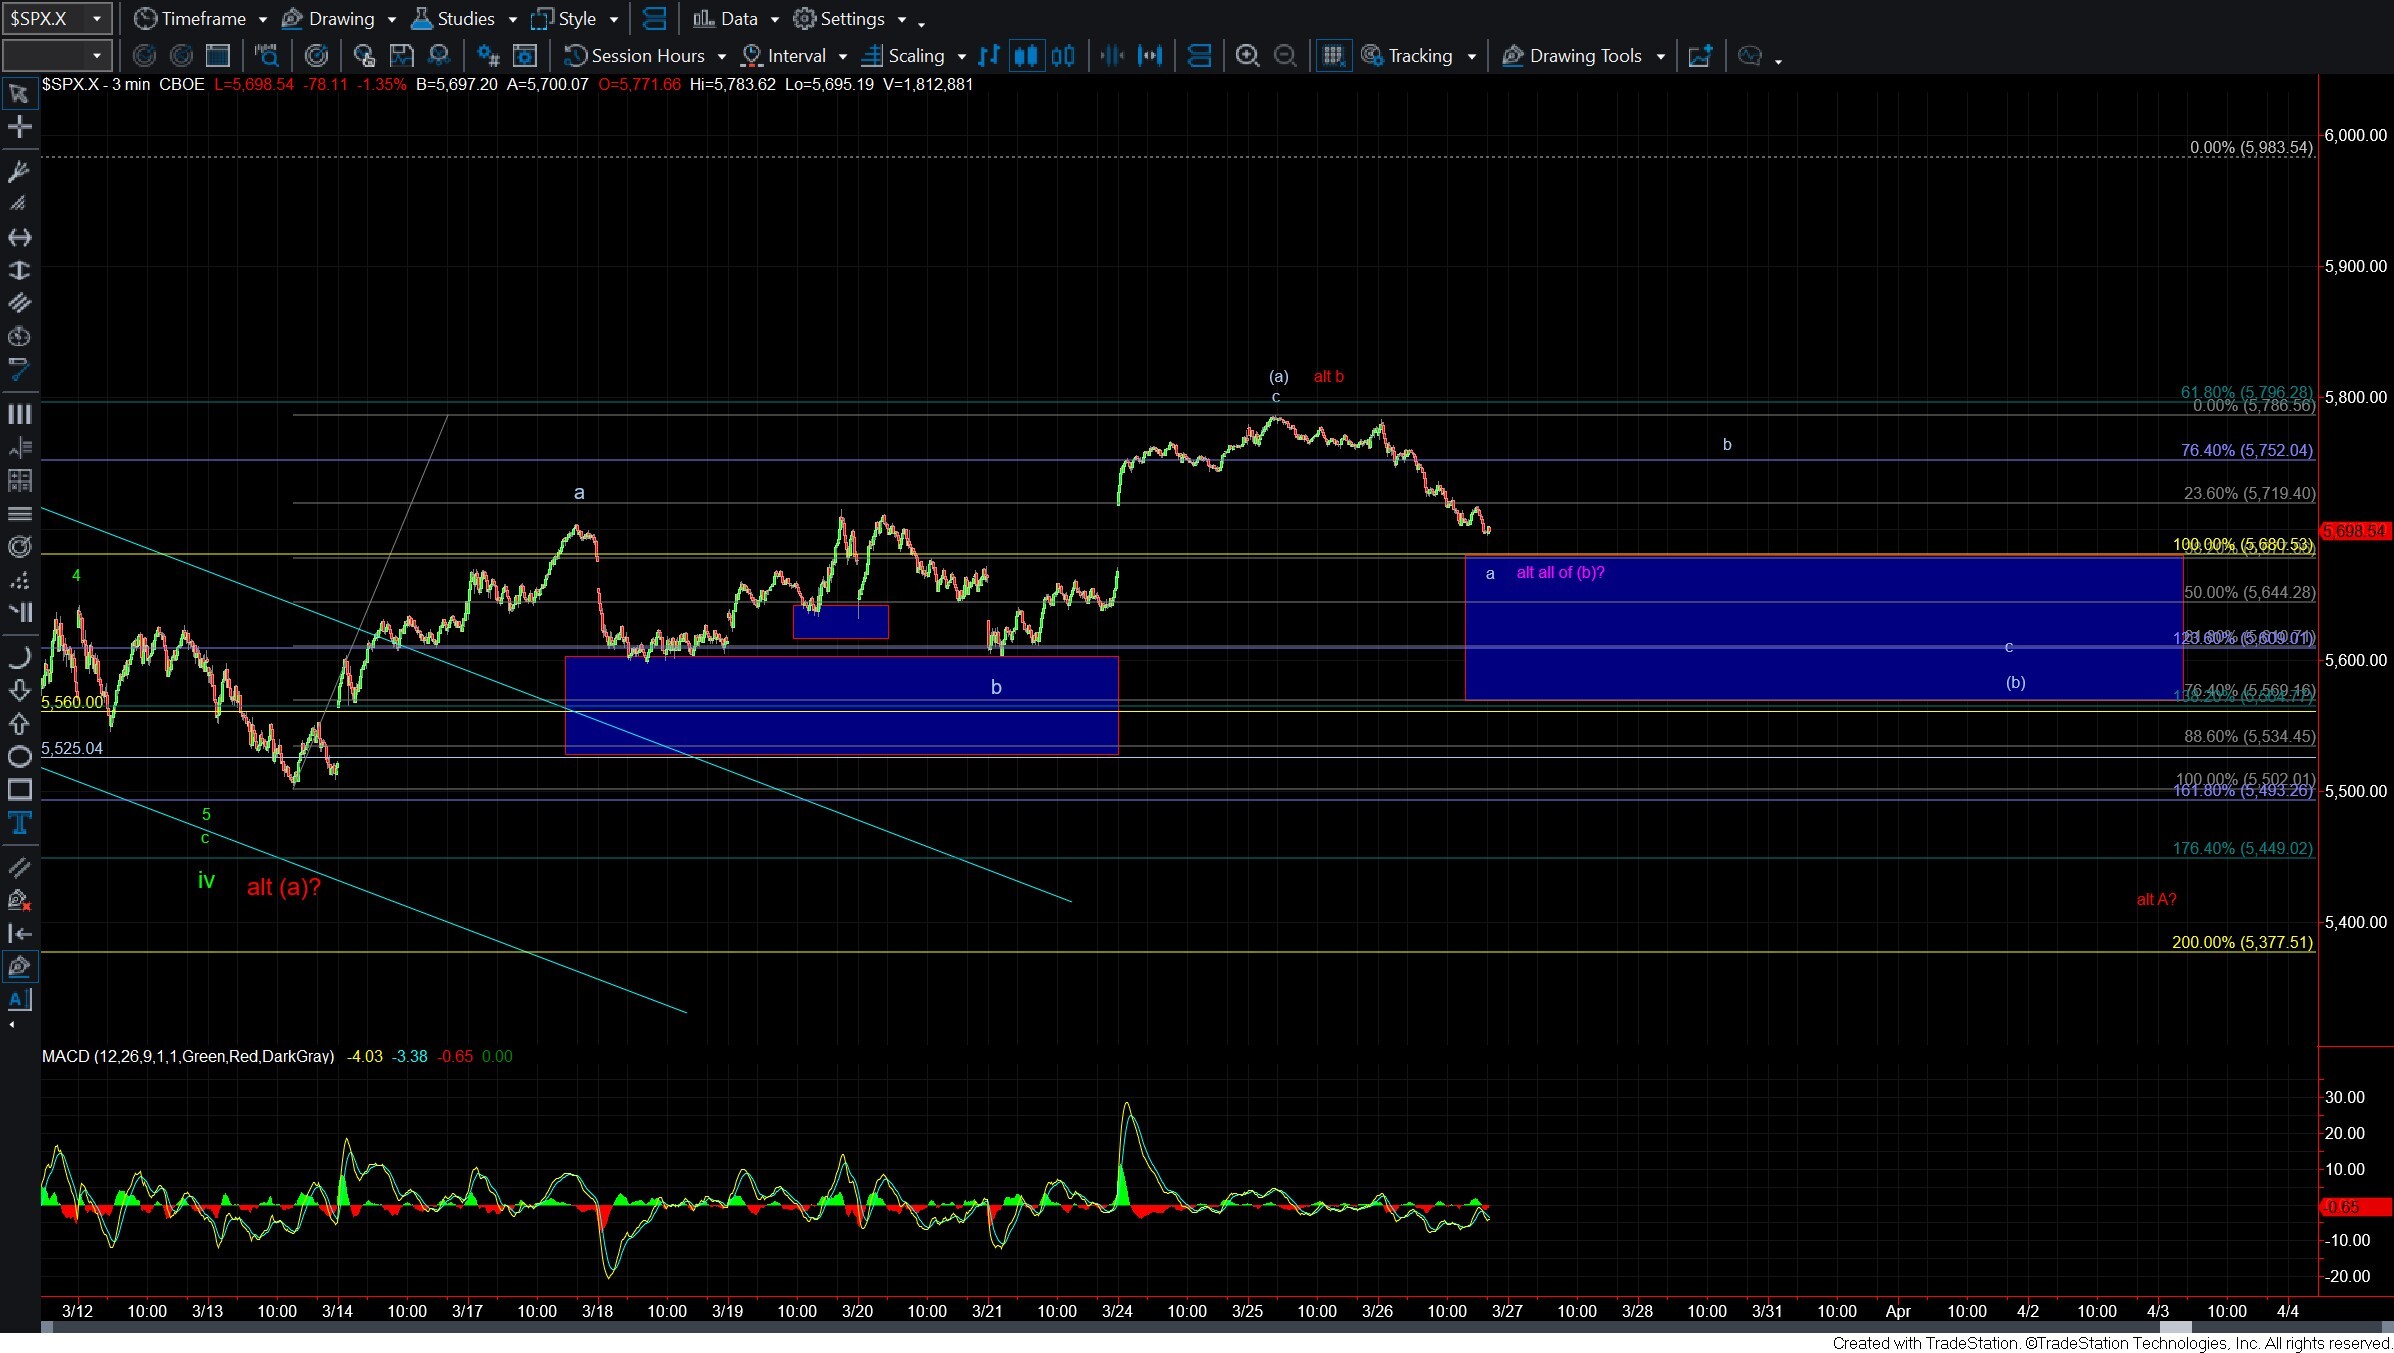
Drilling down to the 3-minute chart we can see that support for the potential wave (b) comes in at the 5680-5534 zone below. Again, as long as we hold that zone then I still am leaning toward seeing at least a wave (c) higher before any further downside action. Should we begin to break that zone then it would open the door for this to be moving lower per the red count that we have been laying out over the past several weeks.
In regard to the structure of this initial move down off of the highs as of right now it is not terribly clear so I can not say with certainty whether we have a five or three-wave start. In either case however, it simply could be the wave a of the larger wave (b) as I have laid out on the 3-minute chart. Likely
We will need to see a full five up to give us an initial signal that a bottom is indeed in place and that of course, would need to be followed up with a break back over the 5786 high. For now and until we see that five-wave move it is certainly possible that we meander in this (b) wave for the next few days as we close in on the upper end of the support zone for the wave (b). If however, we start to see a full five up, then it does open the door for a sharp reversal back towards the 5900 to 6000 region as we still are attempting to see the reversal from the larger Ending Diagoanl to the downside that likely completed on 3/13.