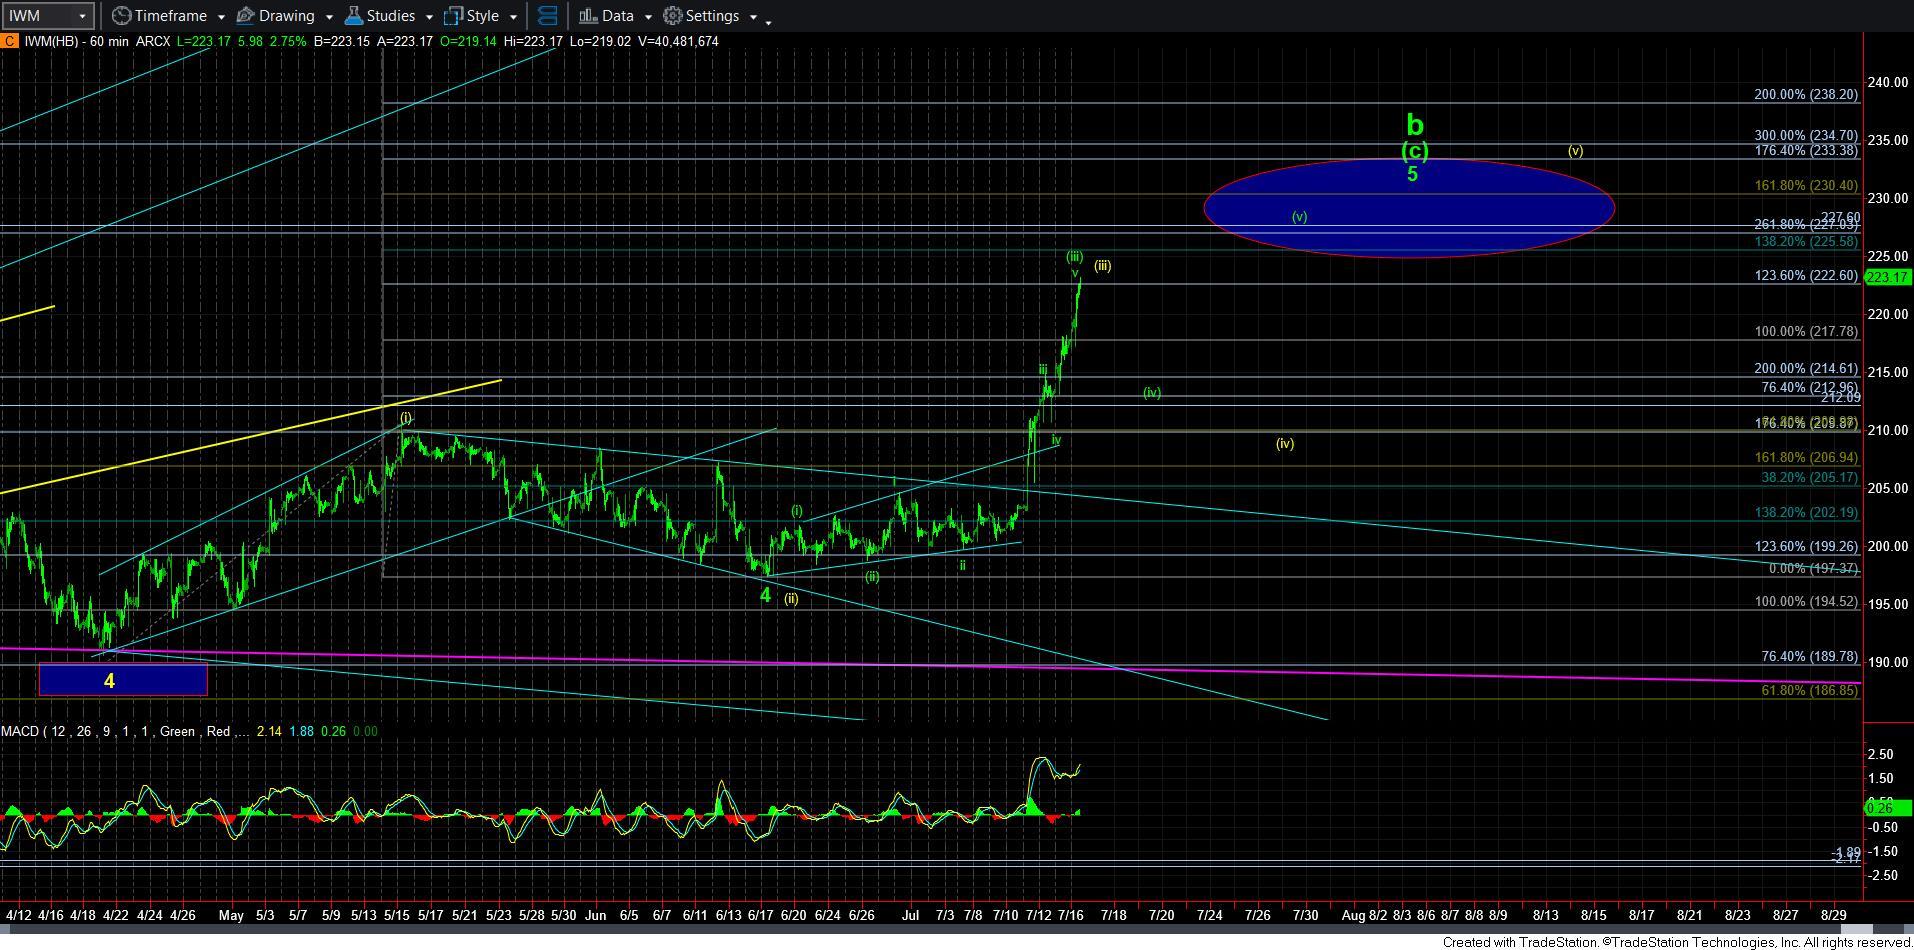
IWM Hitting A Target
The IWM is now hitting the 1.236 extension in the yellow count outlined on the 60-minute chart. This is a typical target for a 3rd wave within an ending diagonal, which is what is represented by the yellow count. Of course, the market can choose to continue to extend to the 1.382 extension in the 225.50 region, and I would not necessarily discount that based upon the manner in which the market has been rallying. But, by all measures, we are certainly stretched.
Support is now in the 213.50 region, which is the .382 retracement region if the market would top out in wave [iii] right now. Of course, if it continues to extend towards the 1.382 extension, then that support would rise. But, depending upon how the market handles the next pullback will tell us which is the operative wave count between the two. Oddly enough, the deeper we pullback, the likely we go towards 233 before this 5-wave rally completes.
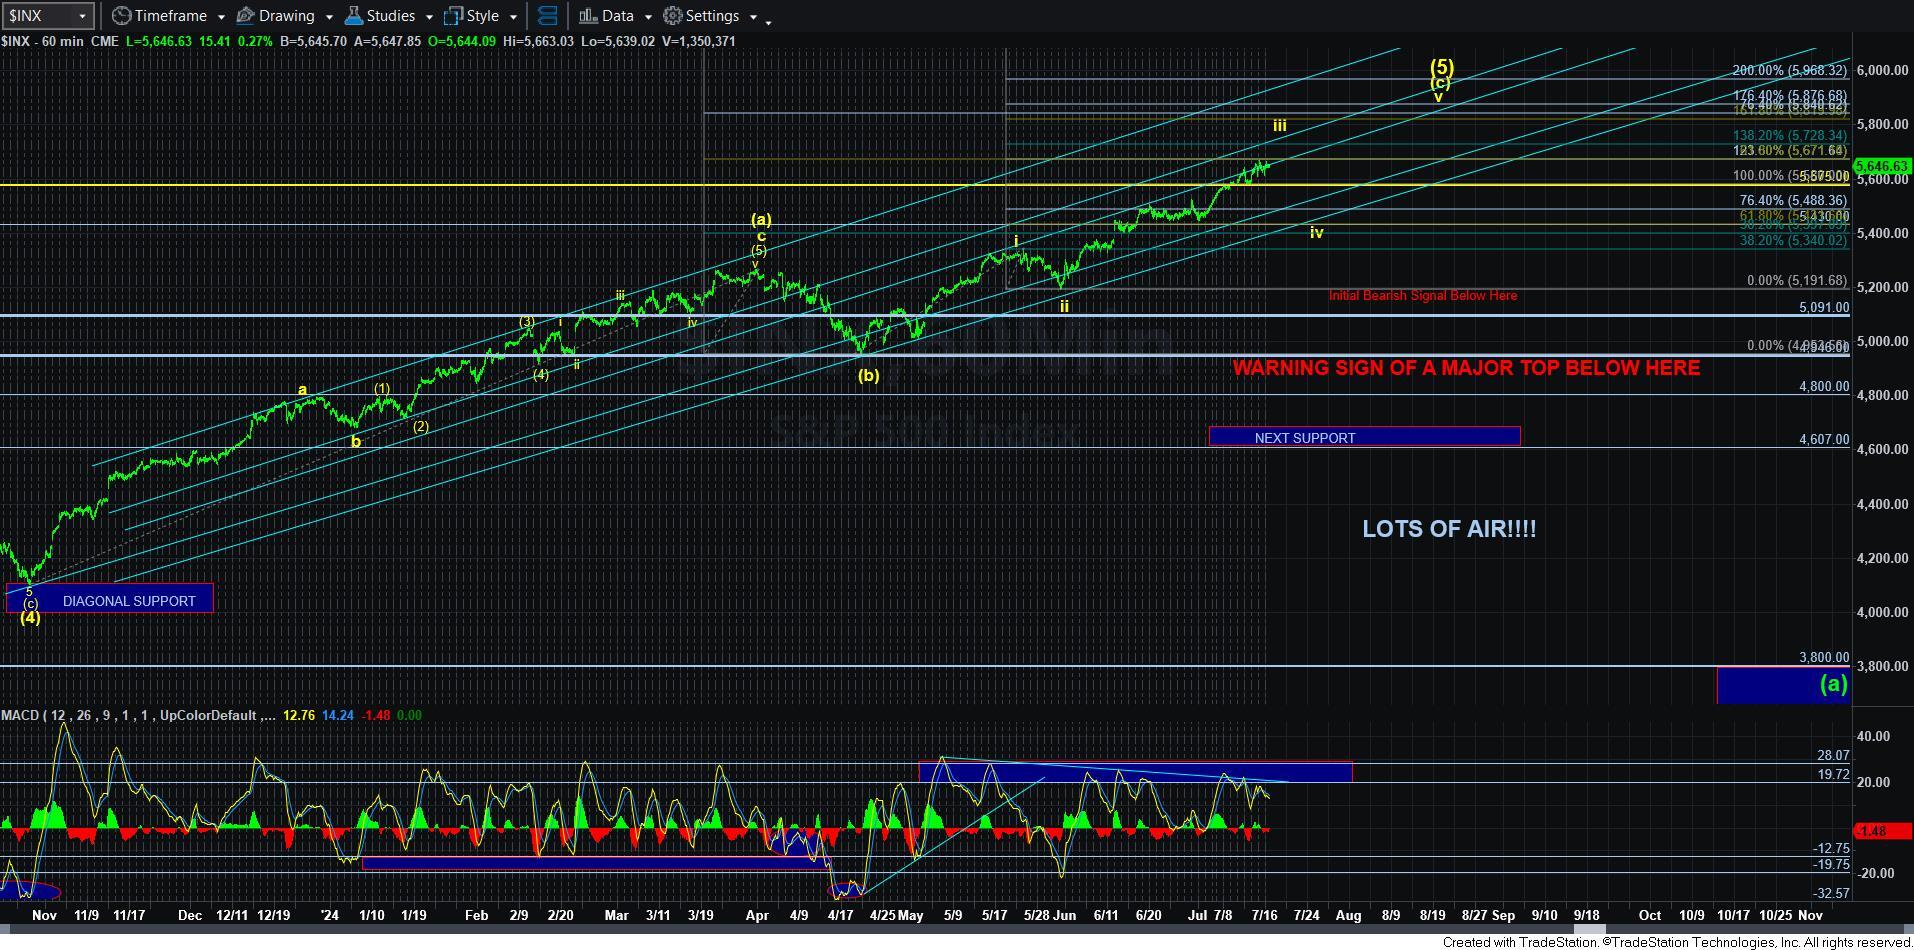
In the meantime, the SPX really has not done anything of significance, so the update analysis on SPX from yesterday remains quite relevant:
In the SPX, our minor support is 5607SPX, and as long as that is held, the next upside resistance/targets are the 5675SPX region followed by the 5730SPX region. A break down below 5607SPX is an initial indication that we are in a wave iv pullback, whereas a sustained break down below 5575 confirms it.
Lastly, again I want to remind everyone that my targets are not meant for timing purposes, but rather the path I expect that we can take.