Just Lookin Around - Market Analysis for Mar 10th, 2025
So, I decided to take a quick look at two of the other indices, and they are both showing signs of an important inflection.
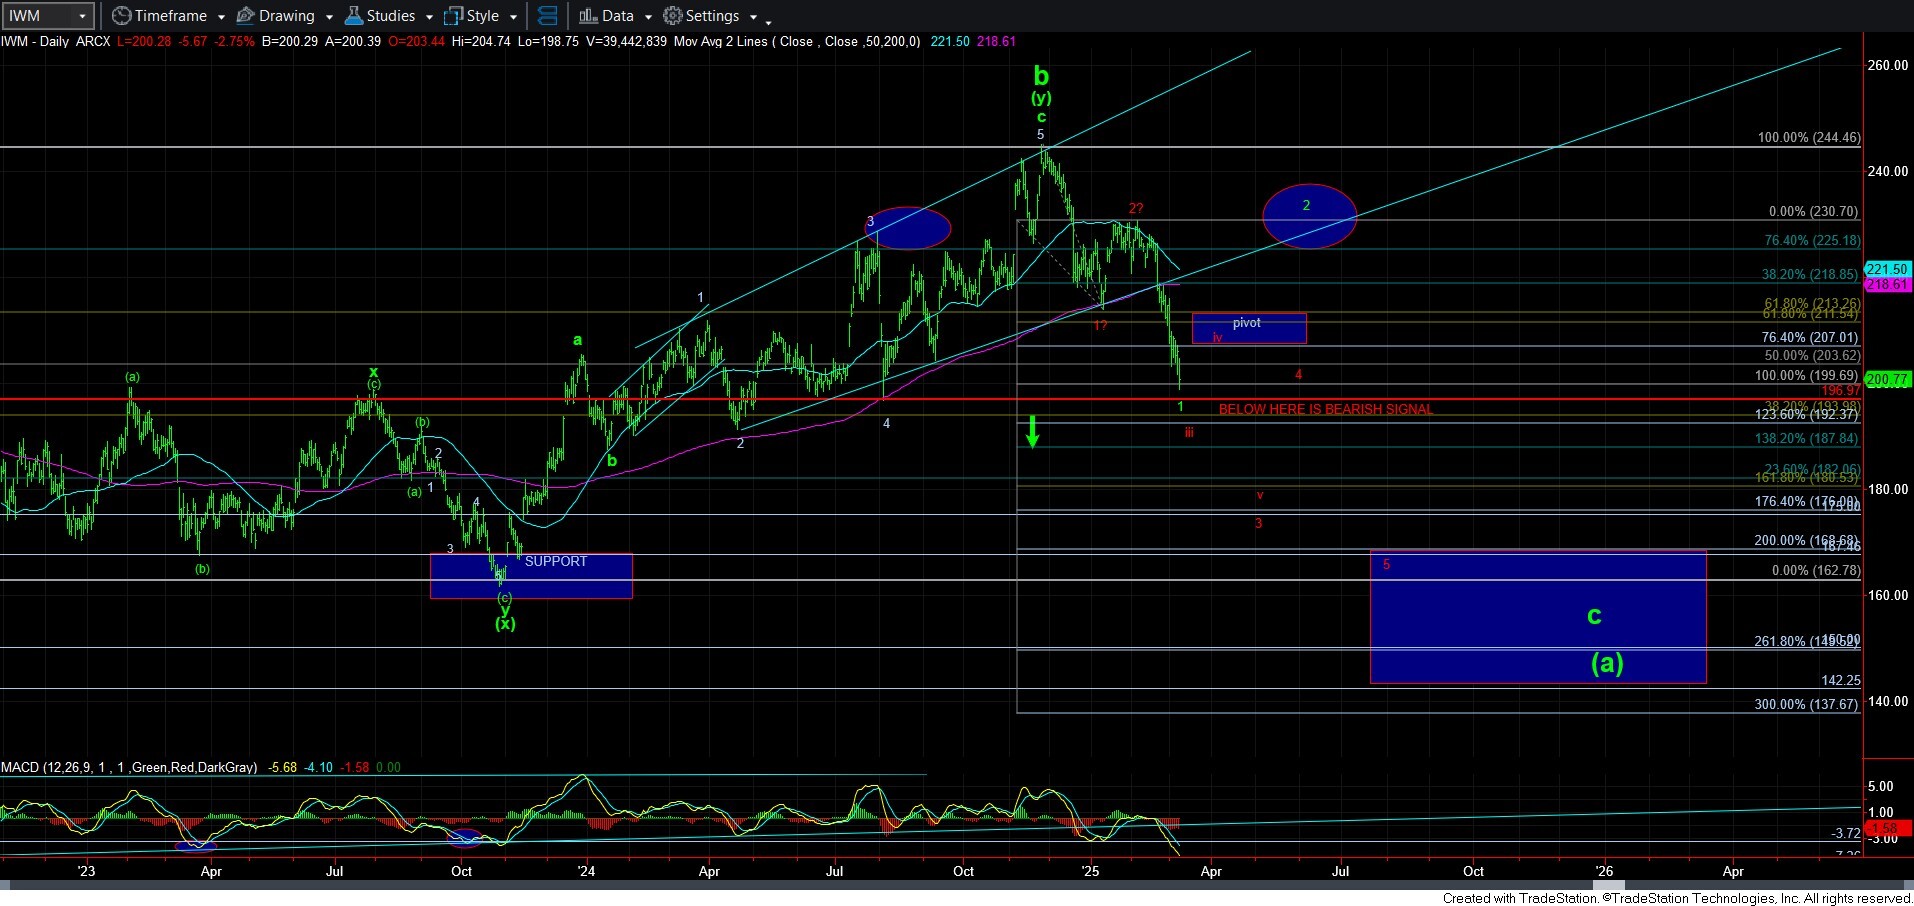
First, the IWM. It is now at a point where, just like the SPX, we really should see a bottom and a rally. Now, that rally is likely going to be a wave 2 in a big ending diagonal down for a [c] wave. However, the deeper we drop here, the more likely we are in wave iii of 3 in the red count, which would mean that the next bounce will likely only be to the pivot. That would then set up a wave v of 3 down.
But, again, as long as we see a bounce before VERY soon, I can still maintain the bigger wave 2 bounce. However, we will have to keep an eye on the wave iv resistance in the coming weeks as well. I assume that if the red count is playing out in SPX, and we see 5 waves down after a bounce, this will likely follow through on the red count as well.
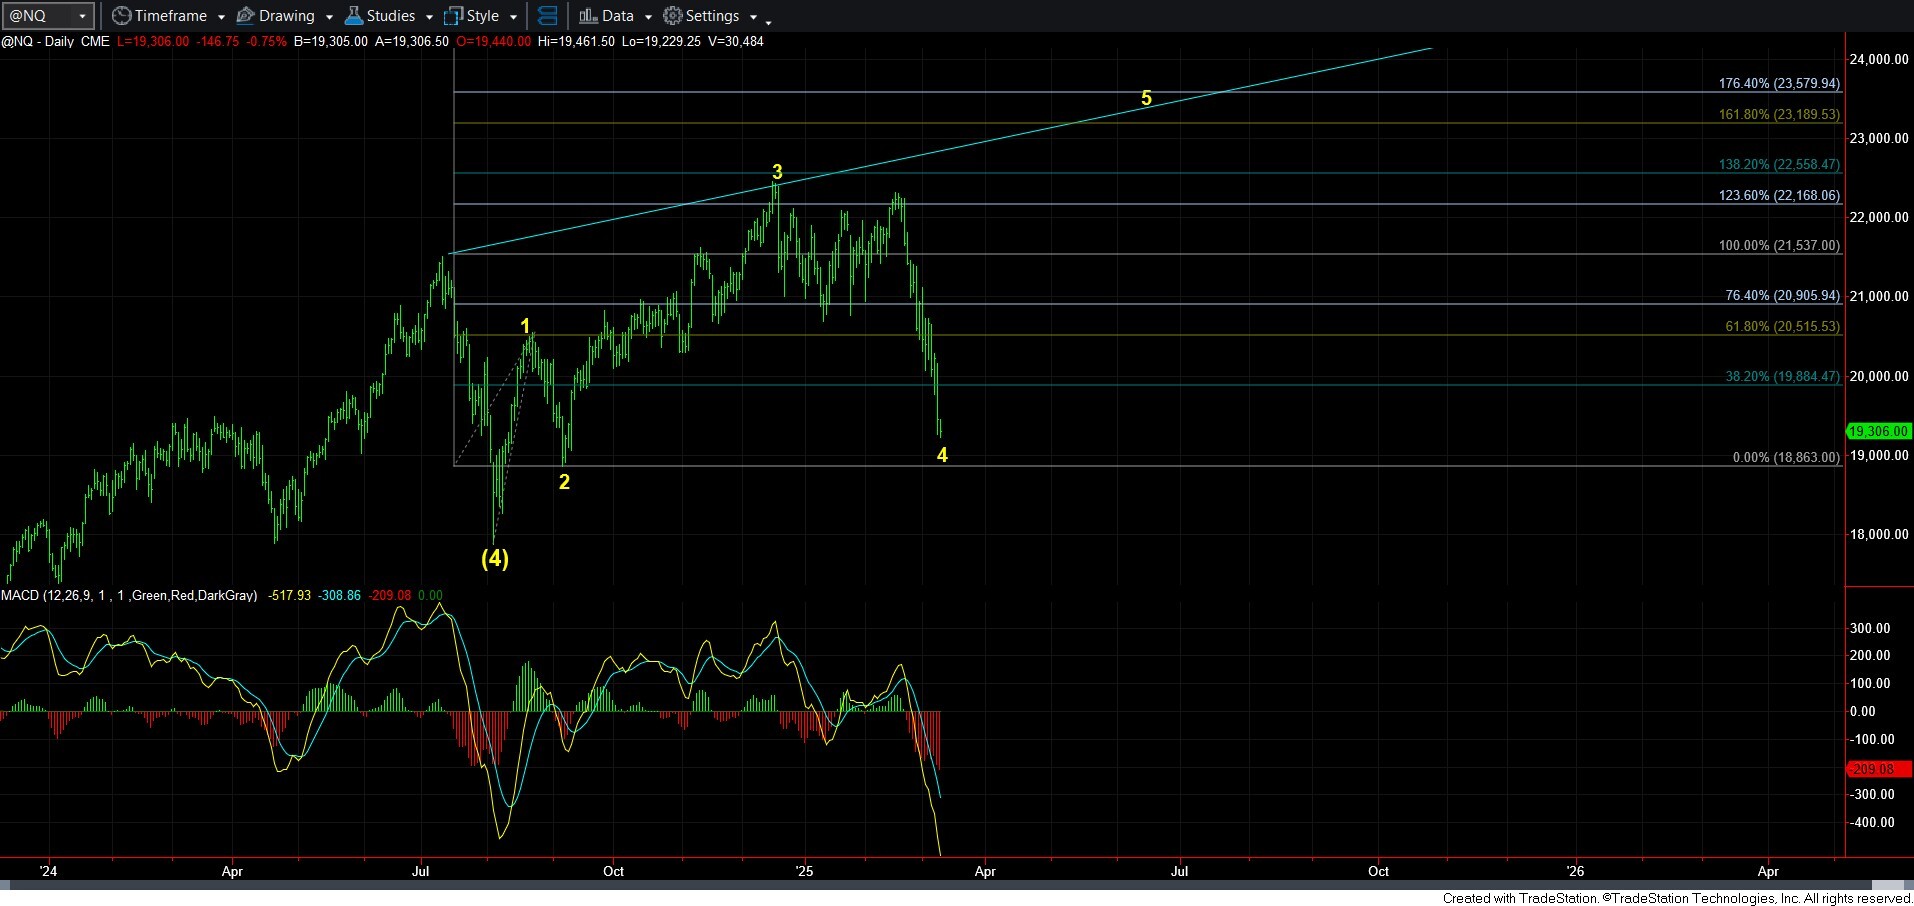
This brings me to the NQ chart. And, I have it labeled with this being a wave 4 in a diagonal, with one more high to go. But, there are a lot of problems with this. While the Fibs work quite nicely with the wave 3 taking us just north of the 1.236 extension of waves 1-2, this drop is quite abnormal for a wave 4. And, if this decline continues and breaks below 18863, then it invalidates that potential completely.
The other side of the problem is that I cannot count a completed wave count into the recent highs. So, this one is a big question in my mind. But, again, if we break below 18863 in the coming days, I have no reasonable count to have me looking for a higher all-time high. Of course, I can come up with a wave count that views this decline as completing a bigger wave [4] with the high being an expanded b-wave, but that is a really a bit of a stretch in my mind at this time.
So, I just wanted to show you some of the other charts that are showing how important is to see a low being struck VERY soon. There really is not much more room left across the market.