Market Slows Down After A Wild Run
 By
By
Today, the market continued to take a breather after three weeks of extreme volatility. Price action remained in a very tight range, leaving the door open for a number of short-term paths to play out. Overall, however, the action on smaller timeframes remains quite sloppy. Because of this, I will continue to focus on key support and resistance pivot levels, which I’ll outline below. At the moment, I don't see a high-probability outcome on the smaller timeframes until we get a decisive break of those pivot levels.
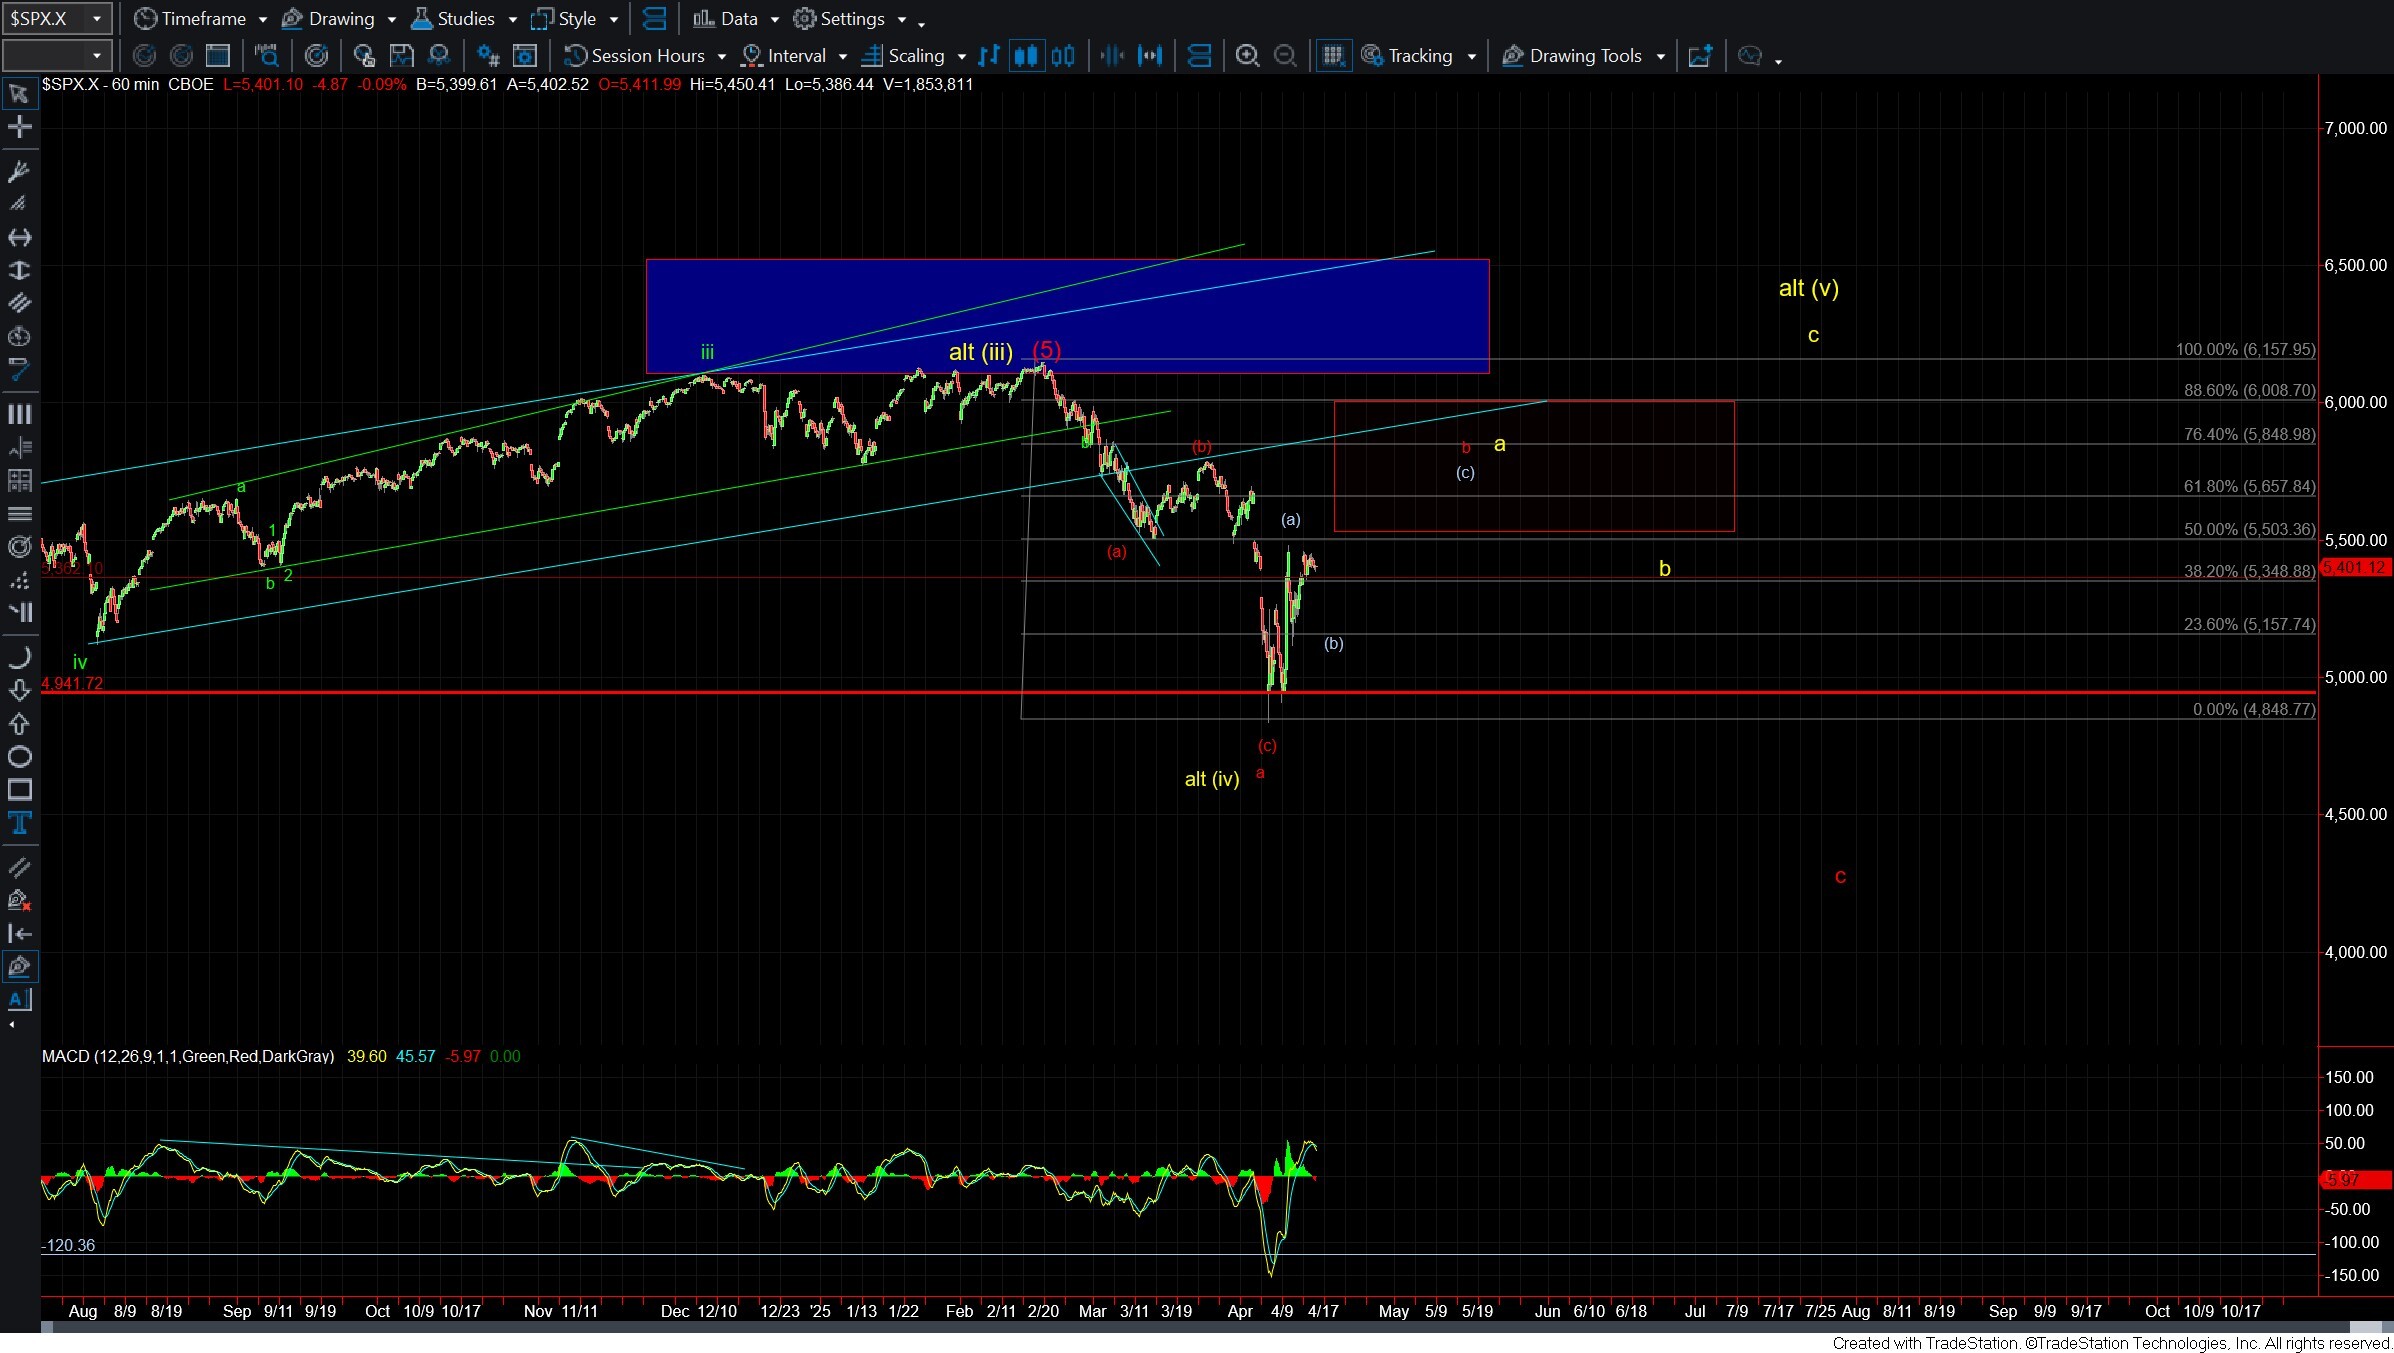
There isn’t much to add to the bigger picture count. The base case still holds that we’ve bottomed in at least wave a, as laid out in the red count. The move off the lows continues to look corrective, which can support either the yellow or red counts. As discussed previously, we won’t know which of these is playing out until we see the structure of the next retracement following a local top. If that move down is corrective, we likely have higher levels ahead. However, a five-wave move to the downside would open the door to a more direct and deeper push lower.
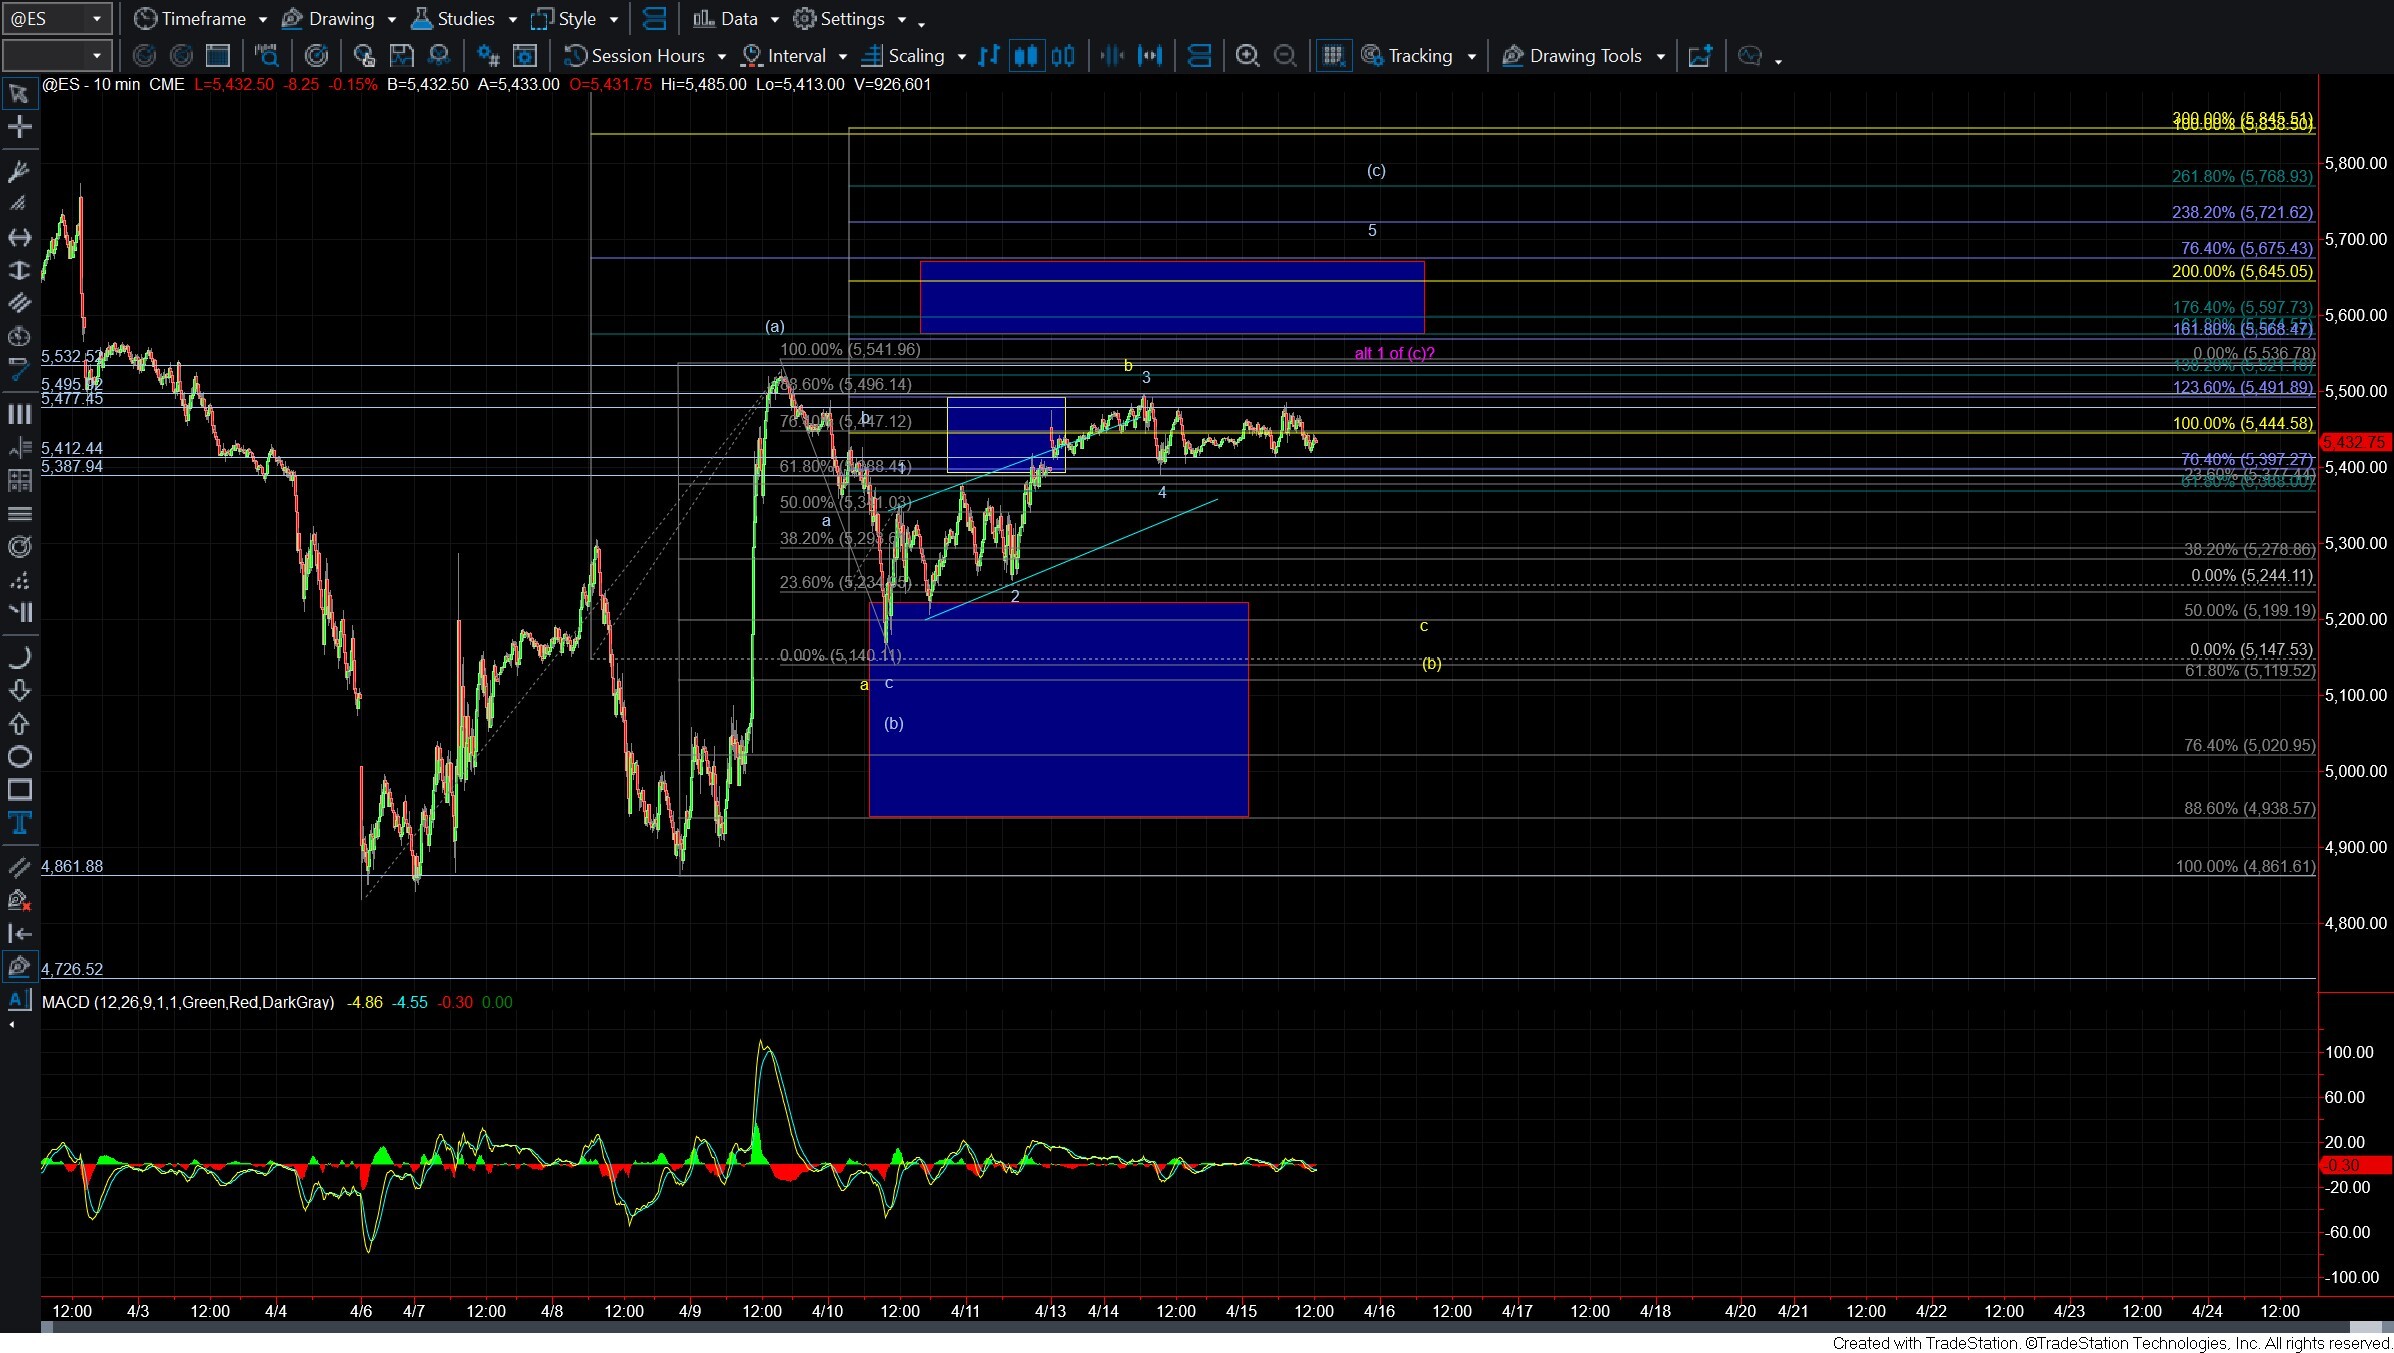
Zooming into the smaller timeframes, today’s range is holding above yesterday’s low at 5387 and below the high at 5495 on the ES. We need to see a break of either level to get an initial clue as to the near-term direction.
A break below 5387 would be an initial signal that we’re heading lower in yellow wave c of (b). If that plays out, support for c of (b) comes in at the 5199–4938 zone. As long as we hold above that zone, I would still expect another push higher to complete the larger wave (c). If that level fails, it opens the door to a more direct decline.
On the other hand, a break above 5495 would indicate that wave (b) may already be complete and that we’re heading higher in wave (c). If we move higher but stall below the 5675 level, followed by a corrective retrace, we could still be forming a wave 1–2 of the larger wave (c). However, a direct break above 5675 would suggest we are completing wave (c) in full, with key resistance coming in at the 5800–5860 region.
For now, I plan to remain patient and let the market dictate the next move. I’ll wait for a higher-probability setup before deploying any capital in this environment.