The Easy Part Is Now Done
With the market rallying to the resistance box on our charts as we wanted to see, the easy part of the analysis is now done. And, the reaction of the market from this box is likely going to determine the direction for the next 500+ point move.
Let’s begin by focusing in a bit more on the rally structure and there are a few points I would like to make.
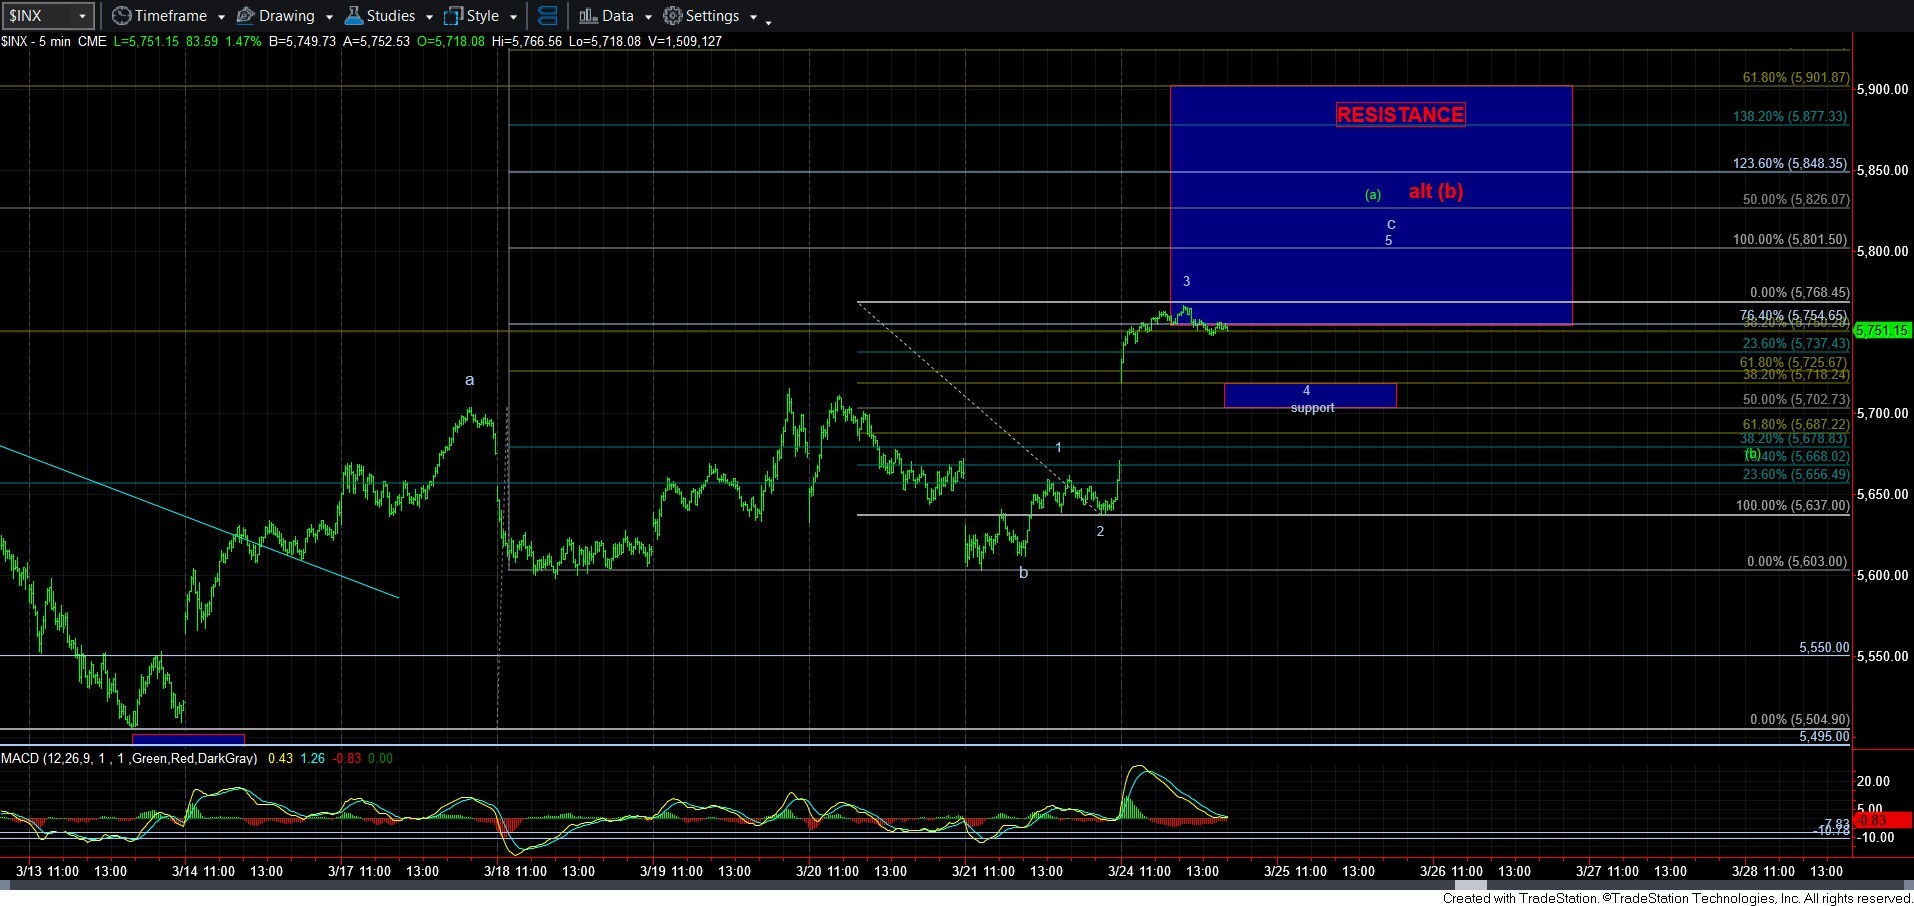
First, I am assuming that the b-wave has a truncated low, as it seems to most cleanly to be viewed with that structure. Second, I am also assuming that this rally today is the 3rd wave of the c-wave. And, as I said in the last few updates, we can identify the target for this c-wave a bit better once we see how extended wave 3 becomes. At this time, I am still not sure that wave 3 is done, so I am going to be a bit more patient before assuming this rally is approaching its conclusion.
I have also added a very liberal support box for a wave 4 on the chart, which represents the .500-.382 retracement of this potential wave 3. The .382 retracement is the traditional target for a 4th wave. Should we extend further in wave 3, I will adjust the box higher. It would take a break down below that support to suggest that this c-wave has completed. For now, I would expect the next pullback will actually be wave 4 in this c-wave, followed by one more rally in wave 5 before this c-wave completes.
As it stands right now, I would have to assume that the a=c point in the 5800SPX region may be the conclusion of this c-wave. While that falls between the .382 and .500 retracement of the last decline, it does not provide us with strong confluence for a top.
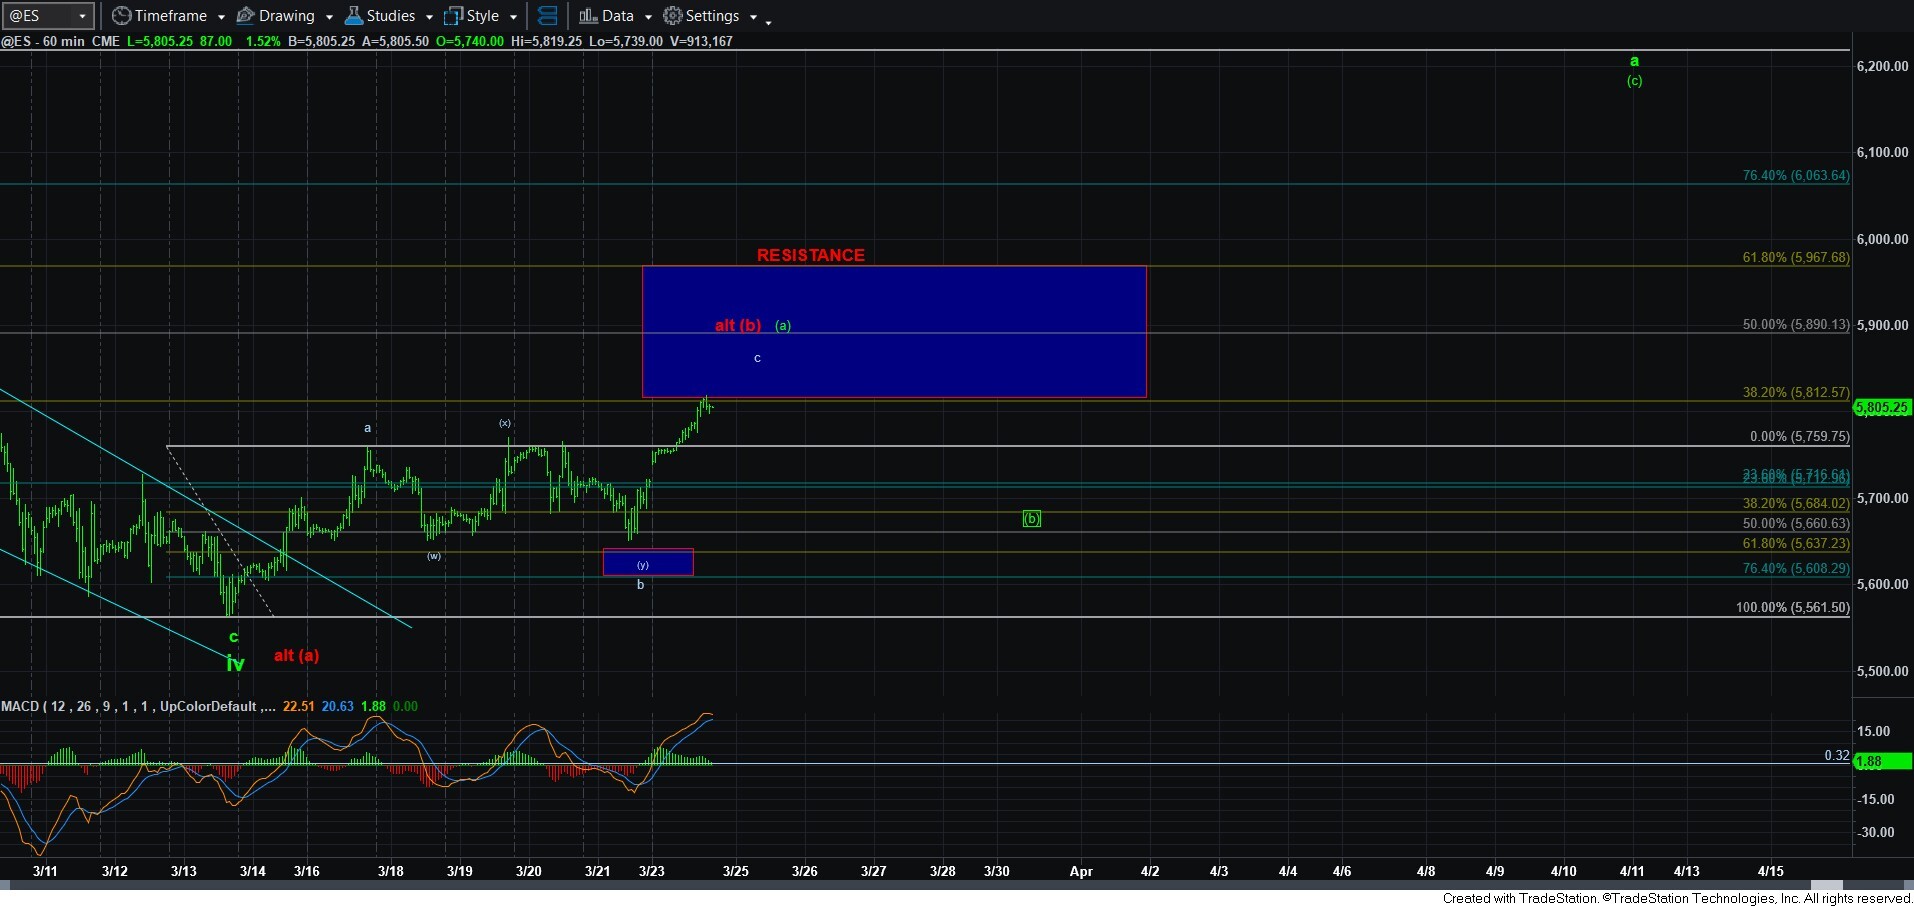
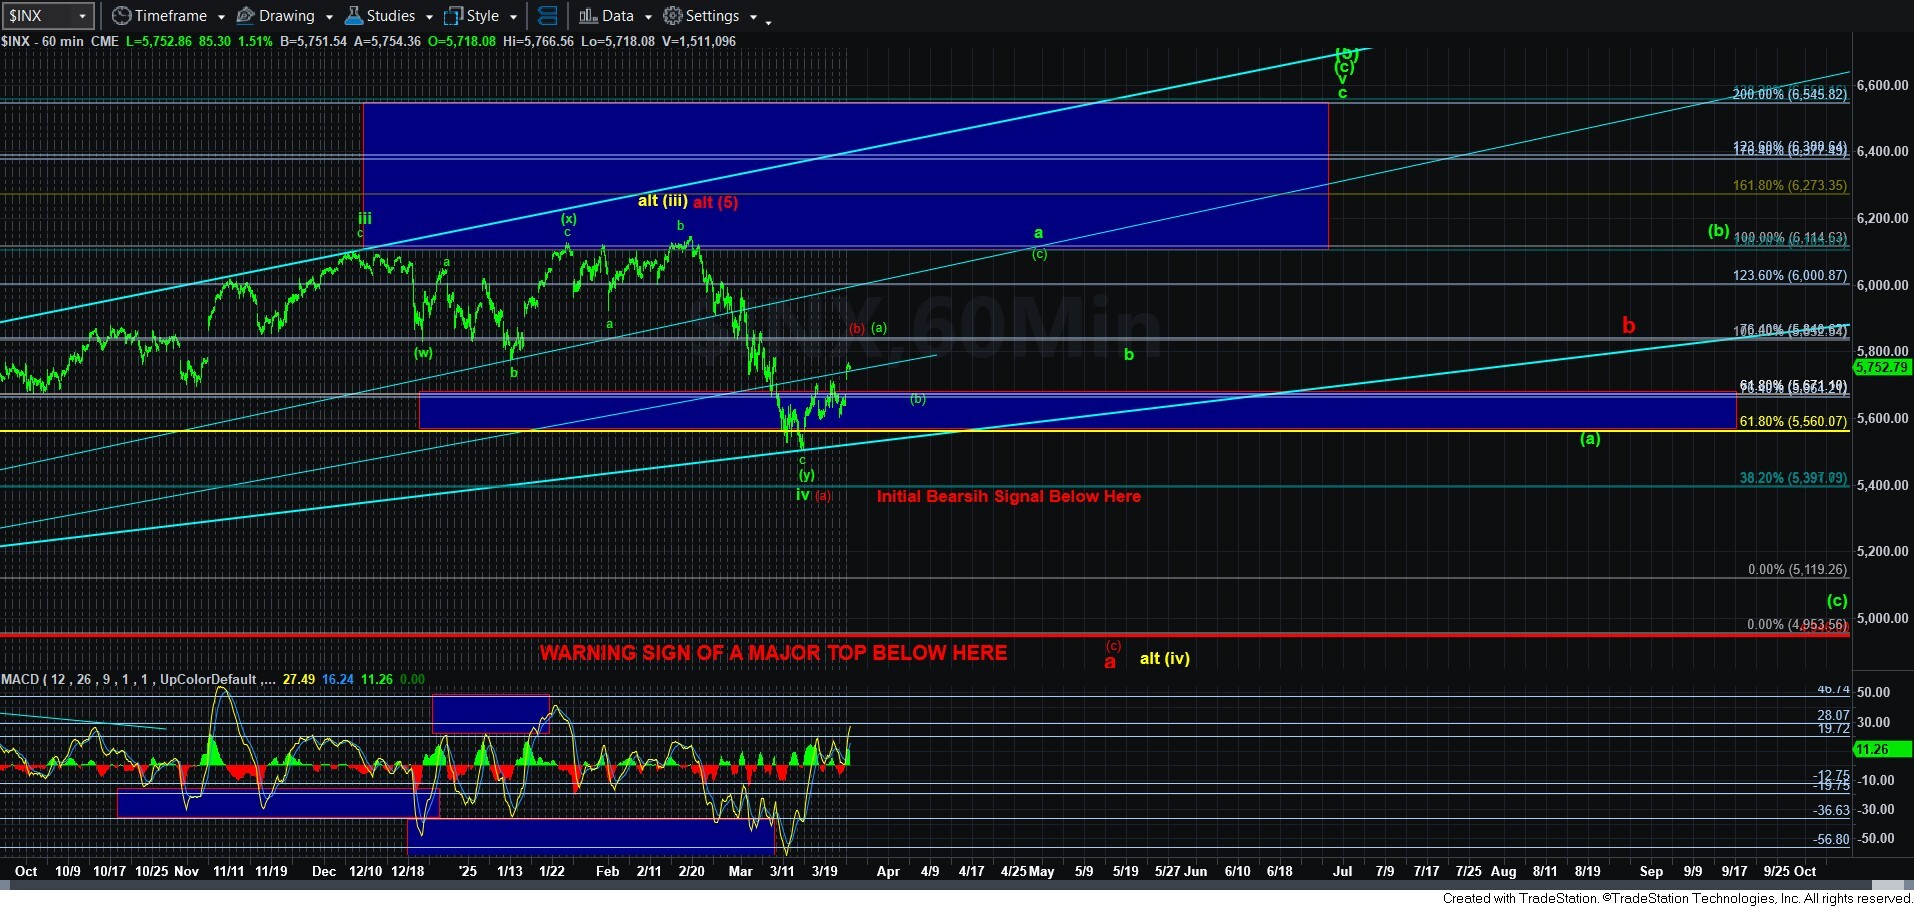
As I have been reiterating over and over during the last several weeks, much will now depend on how the market pulls back from this resistance region once we complete this c-wave. Should we see a clearly corrective pullback, then I will be assuming the pullback is a [b] wave in a larger a-wave of wave v, targeting north of 6200SPX in the coming months. However, if the pullback is clearly impulsive and provides to us a 5-wave decline structure, then I will have to move into the red count and assume the red [c] wave is going to point us down towards the 5000SPX region support to complete a much larger red a-wave.
I also want to note the alternative count should we drop to the 5000SPX region is the yellow count, which I have explained a few times in prior updates. And, that will remain my alternative until proven otherwise, as we will outline should we reach that point. In either case, I believe the rally seen from the 5000SPX region will likely be large enough to buy the drop towards 5000SPX as the [c] wave 5-wave structure is completing. But, I am getting way too far ahead of myself.
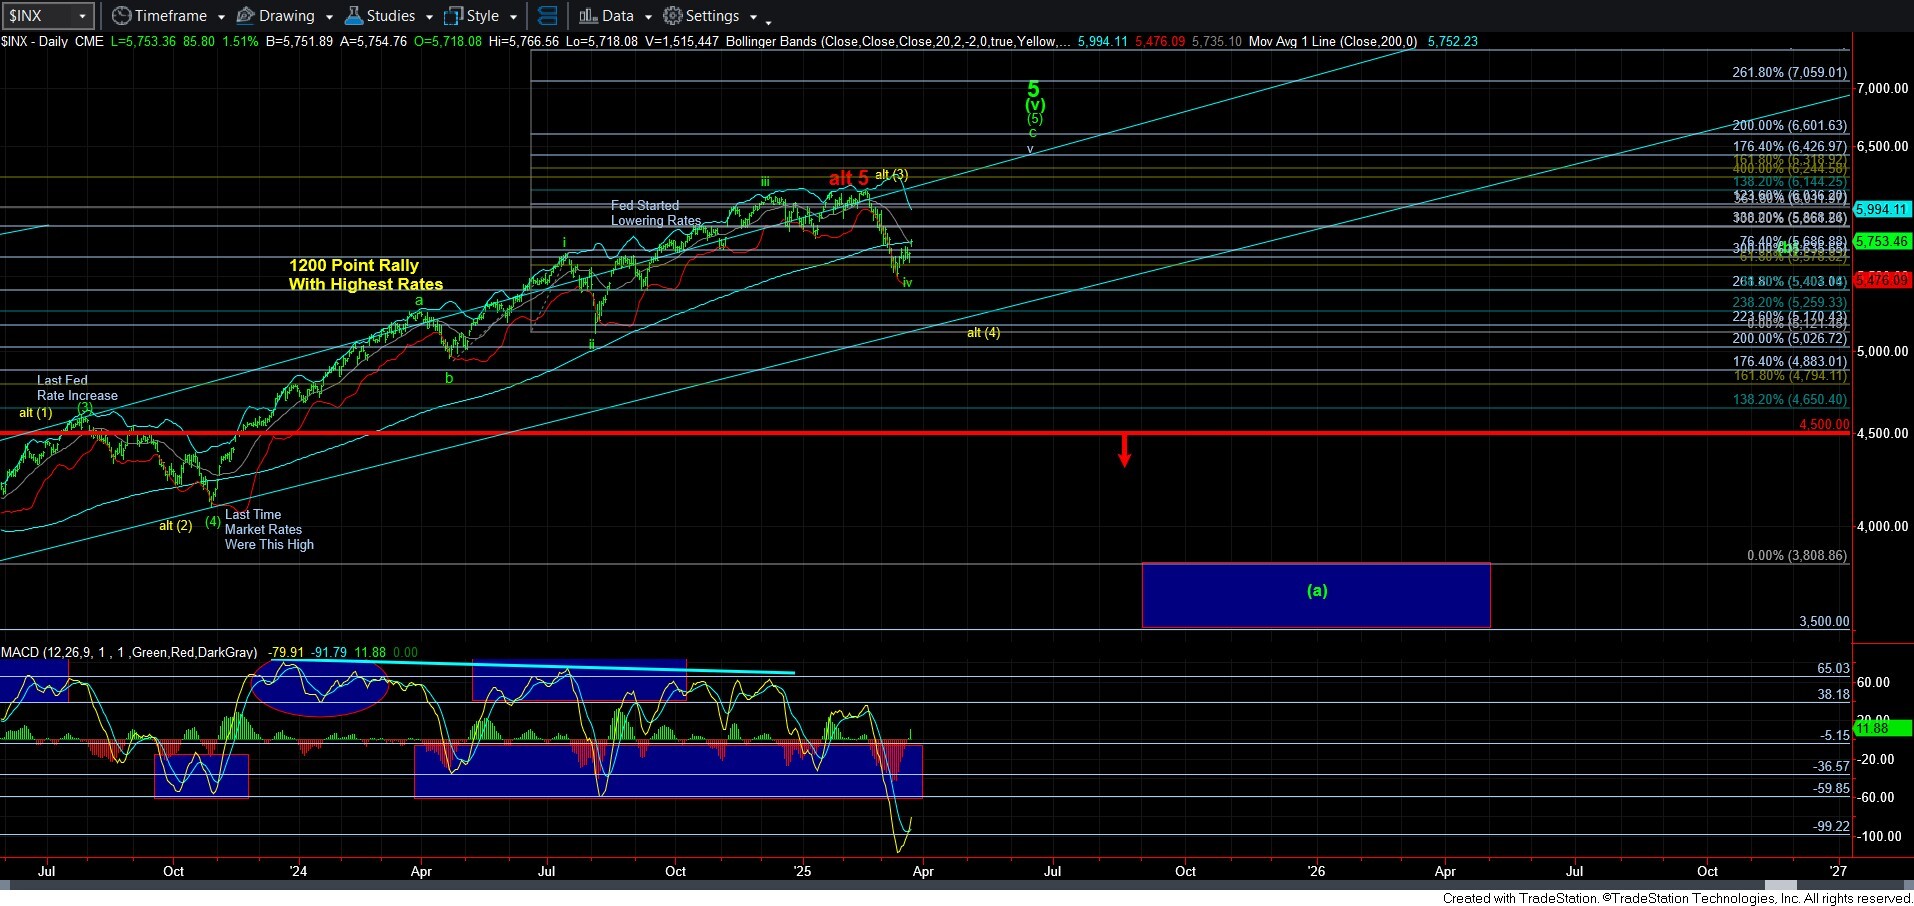
I have also included a daily chart in this update. Take note how the daily MACD has now turned up from an extremely oversold condition, as the market is hitting its head on the 200DMA. Based solely on this chart, I would have to lean towards the green count due to how much room this MACD has overhead to bounce.
So, over the coming days, we will likely complete waves 3, 4 and 5 of the c-wave. Thereafter, I am going to assume we will see a pullback from that completed c-wave. I am still leaning towards the green count for all the reasons I have outlined for some time. However, I will not be standing on ceremony, nor will I retain a stubborn bullish bias should the market tell us otherwise with a 5-wave decline.
I have laid out the parameters, and the market is now going to clarify the path for the coming months.