You Will Know It
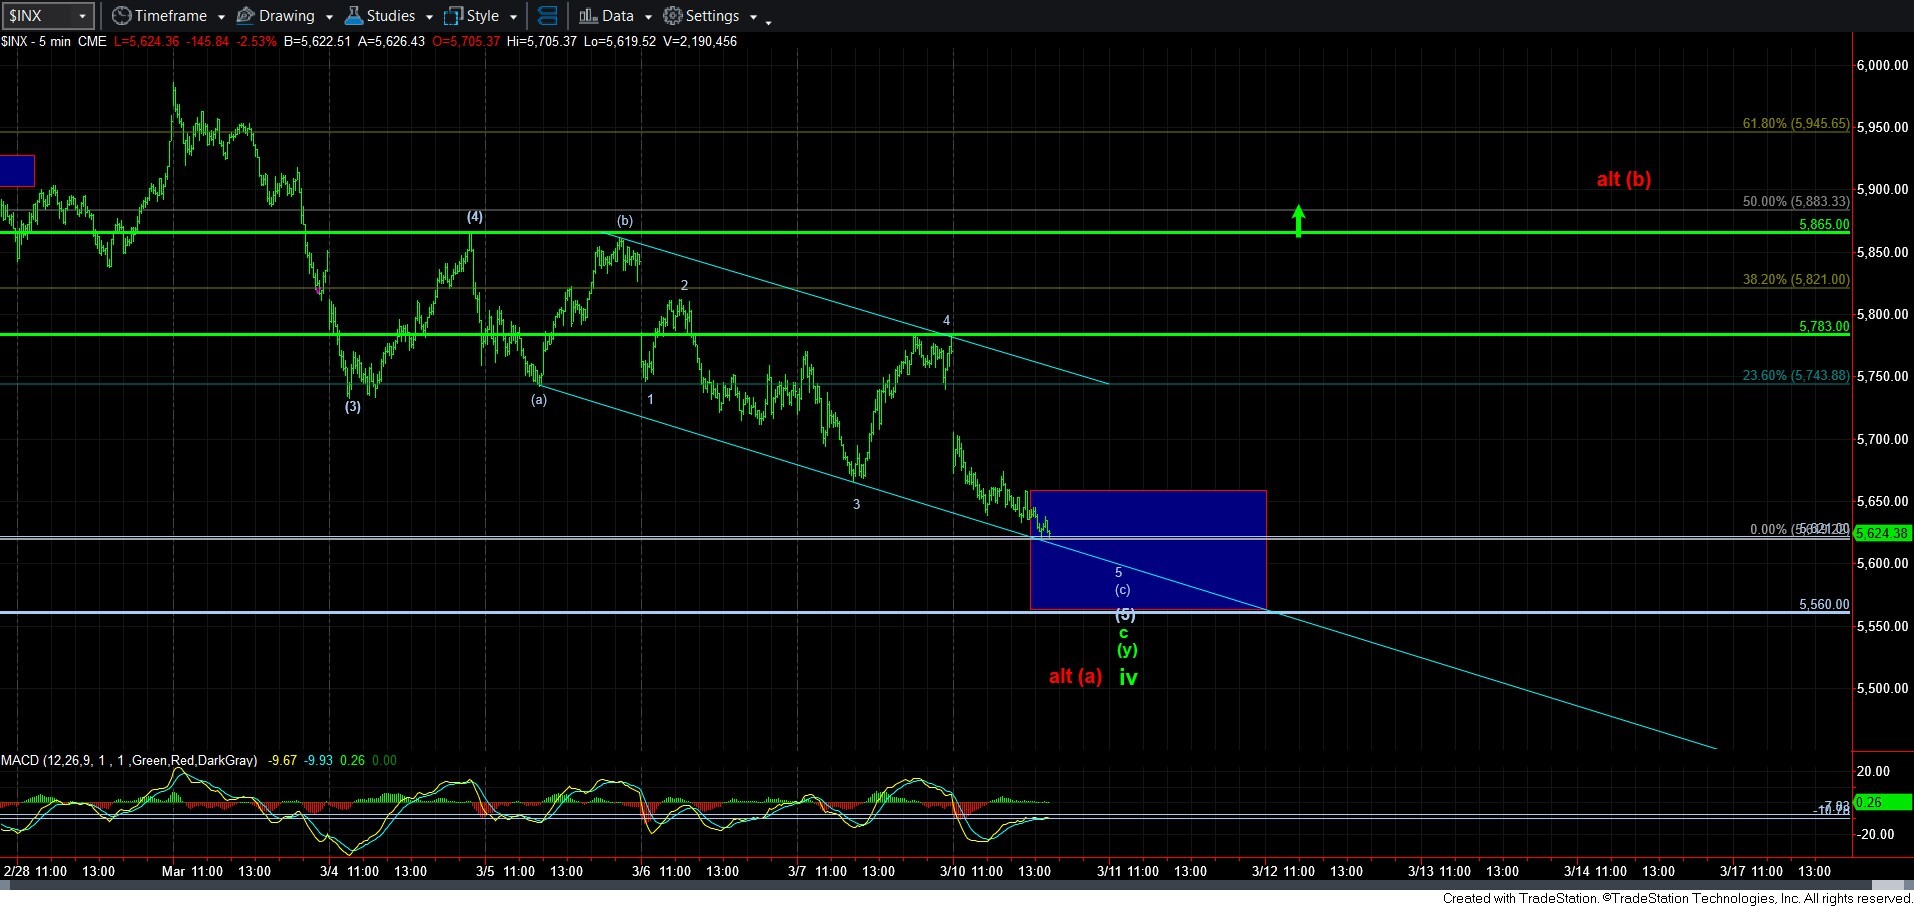
As the market continues to leak lower and lower, we are now in the middle of our support box. As I write this, we are approaching the point at which the [y] wave would be equal to 1.618 times the size of the [w] wave within the 5621SPX region. But, support does extend down to the 5550/5560SPX region. And, until that is breached, I am maintaining my view that this is the wave iv in green, pointing us to a 5th wave yet to go.
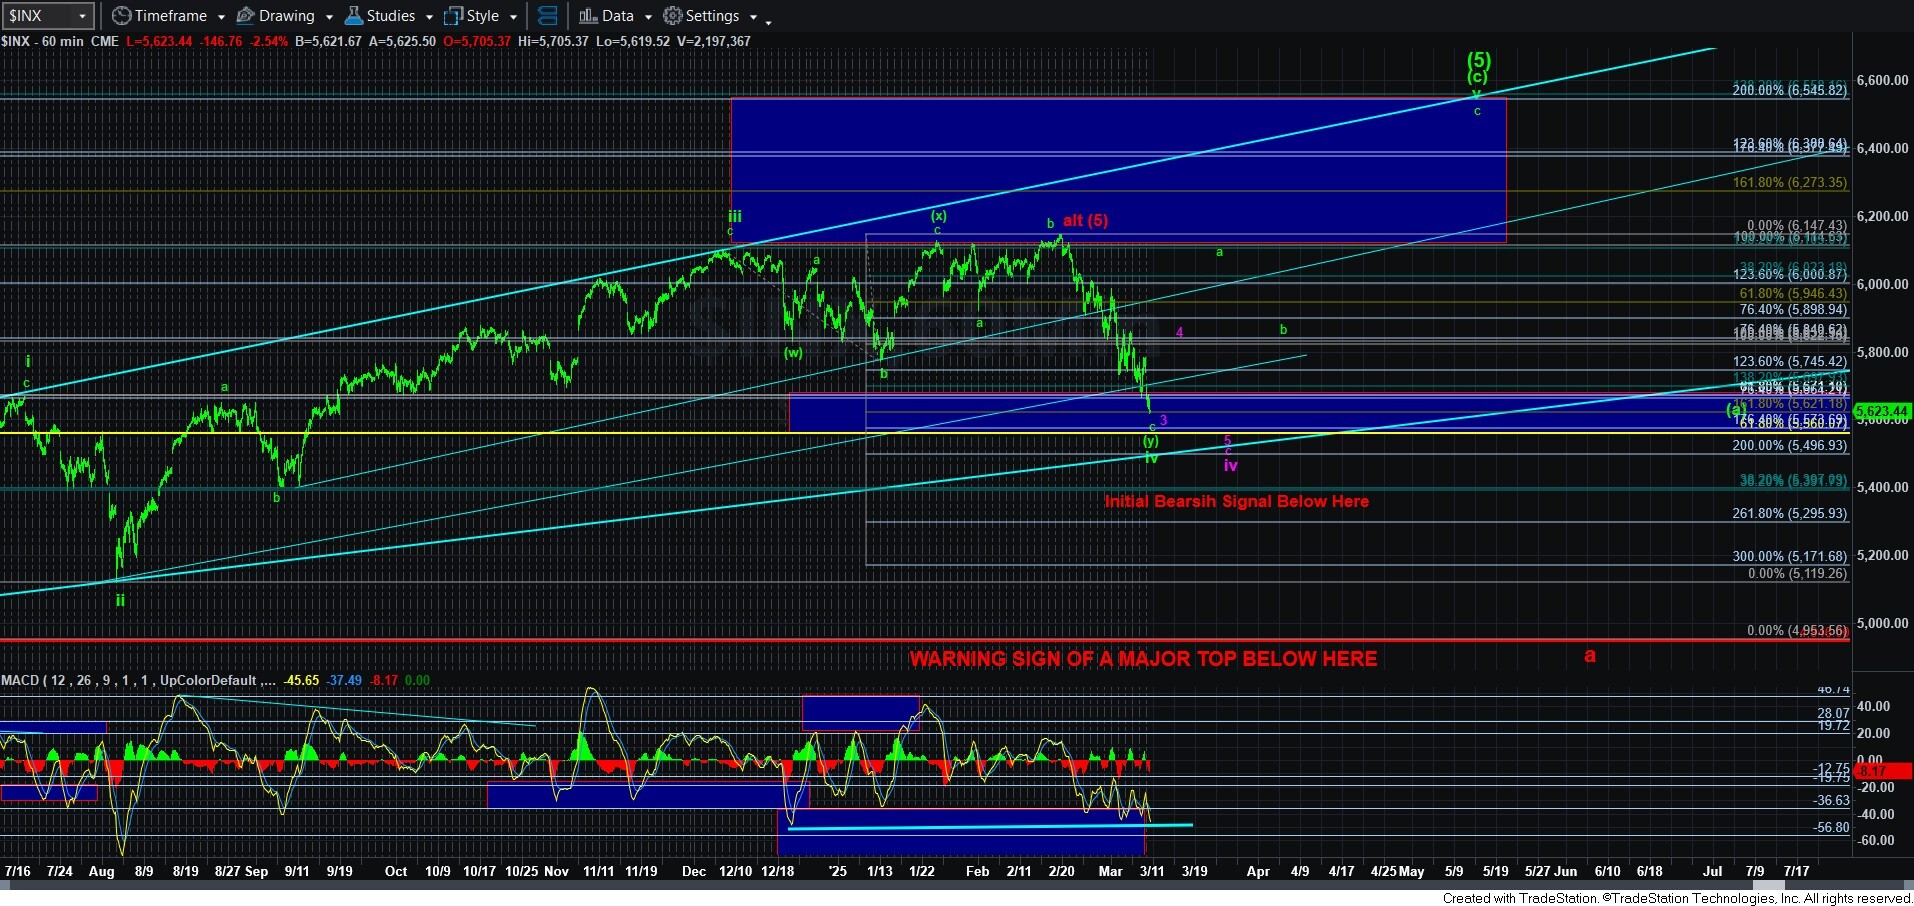
But, of course, should the market break down below this support, and follow through below 5400SPX, that would begin to change probabilities to the top as potentially being in place. While I will have a lot to say about that should we get to that point, I am going to reserve that discussion if it actually does happen.
For now, I want to remind you that this is the support region we have been harping upon for many months. I have noted that I am buyer of the S&P in this region, and I am holding to my plan. And, my intention is to continue to layer into a position, as I am not placing my entire allotment into one entry. I will also remind you that I have significantly reduced the amount of cash that I intent to put into this trade, since we have not seen the CLEAR 5-wave decline I had wanted to see as part of my plan.
So, for now, we remain in the support region. And, unfortunately, while there are a number of ways I can count this decline, I have added one way on the attached 5-minute SPX chart.
Now, since this is likely completing a diagonal down here, one of the hallmarks of a diagonal is that when it completes, the reversal is often quite strong. Moreover, with the growing positive divergences that are still trying to hold in the MACD down here, that also portends a potentially strong reversal. And, when we see the type of reversal that signals this decline has completed, you will likely know it without me even having to say anything.
I have also added resistance levels for a turn higher. Ideally, we need to take out the wave [4] high, at least as I have it counted in this manner (but, there are other reasonable counts for this decline due to the amount of overlap). Yet, a move through that level – 5865SPX – would suggest that this decline is done. And, my primary view is that we will be heading back up towards the highs for the a-wave of wave v in green.
Yet, the one thing I will continue to warn about and track in the background is the red alternative “top-is-in” count. Should we get that break out over 5865SPX, I will be on high alert for ANY 5-wave declines from that point, as that could signal the start of a [c] wave decline in red, thereby making it a much higher probability the high was struck in the market and that a larger degree bear market may have indeed begun.
So, as I have said many times, the action we are dealing with is mostly taking shape in 3’s, which makes this market much more treacherous than most realize. But, we have our support to guide us, as well as knowing that if we do get a rally followed by a 5-wave decline, we may have to switch gears regarding our perspective about this market. And, until the market tells me otherwise, I am going to be adding back a bit of risk into my portfolio after raising a significant amount of cash for many months. But, again, not as much as I had initially contemplated due to the lack of a clear 5-wave decline.