3 Charts Illustrating Moves Off Fibonacci Setups
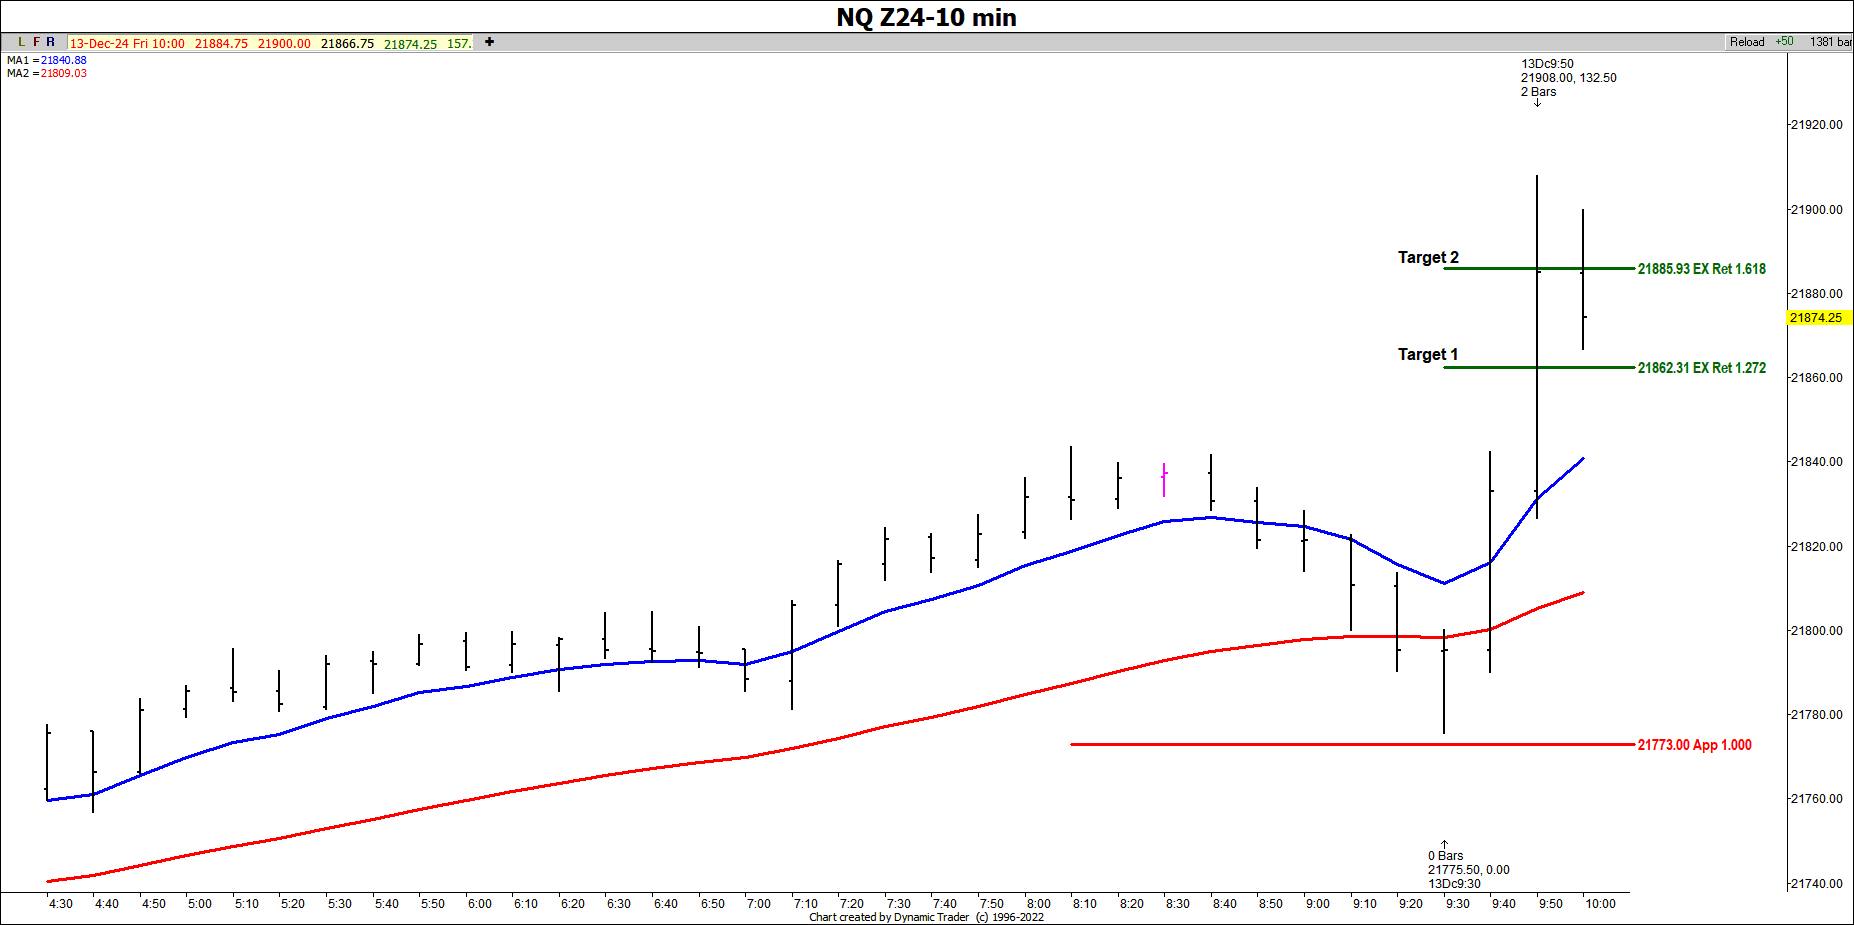
This morning I had a great 10-minute setup in NQ in my live Zoom trading room. The symmetrical support hit and held and so far we've had a rally of 133 points. Also, both upside targets have been met as listed on the chart.
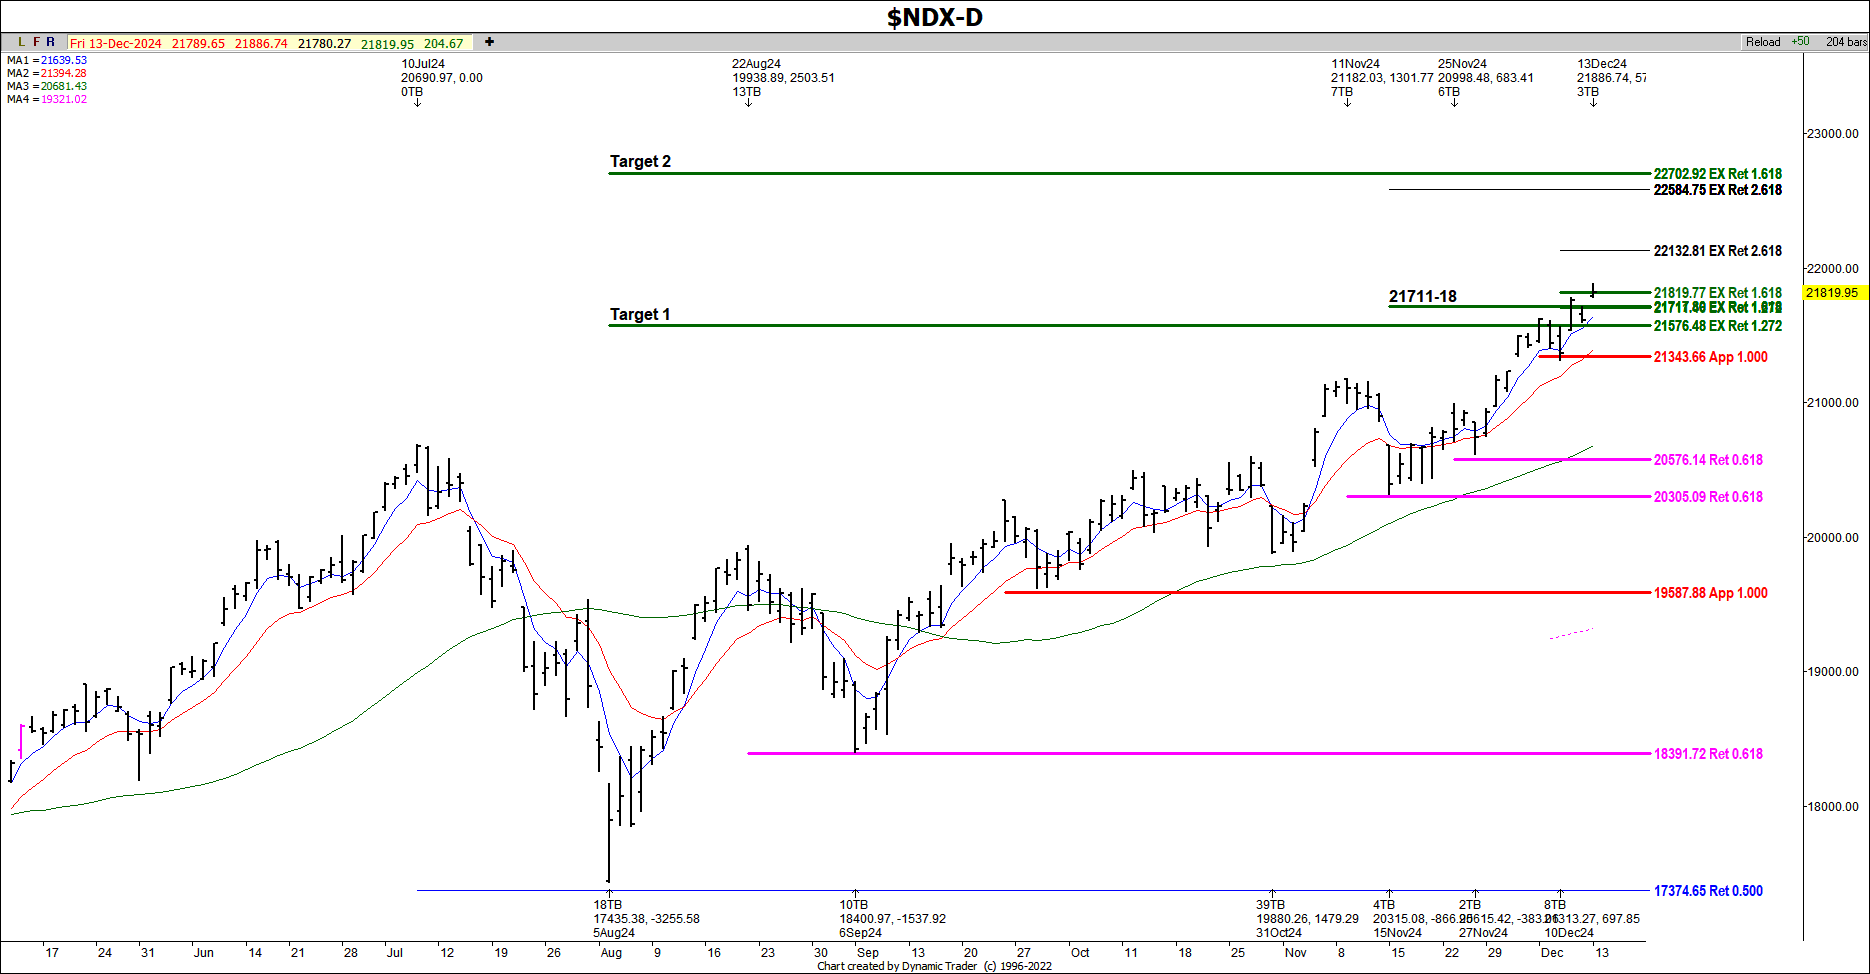
On this NDX chart, you can see many examples of us pulling back into symmetry and/or retracements to continue the move higher. Recently, we met the first larger swing target from the August 5th low and today, met the second target off the Dec 10th low. Targets and dates are listed on the chart. The total rally from the August 5th low is 4451 so far.
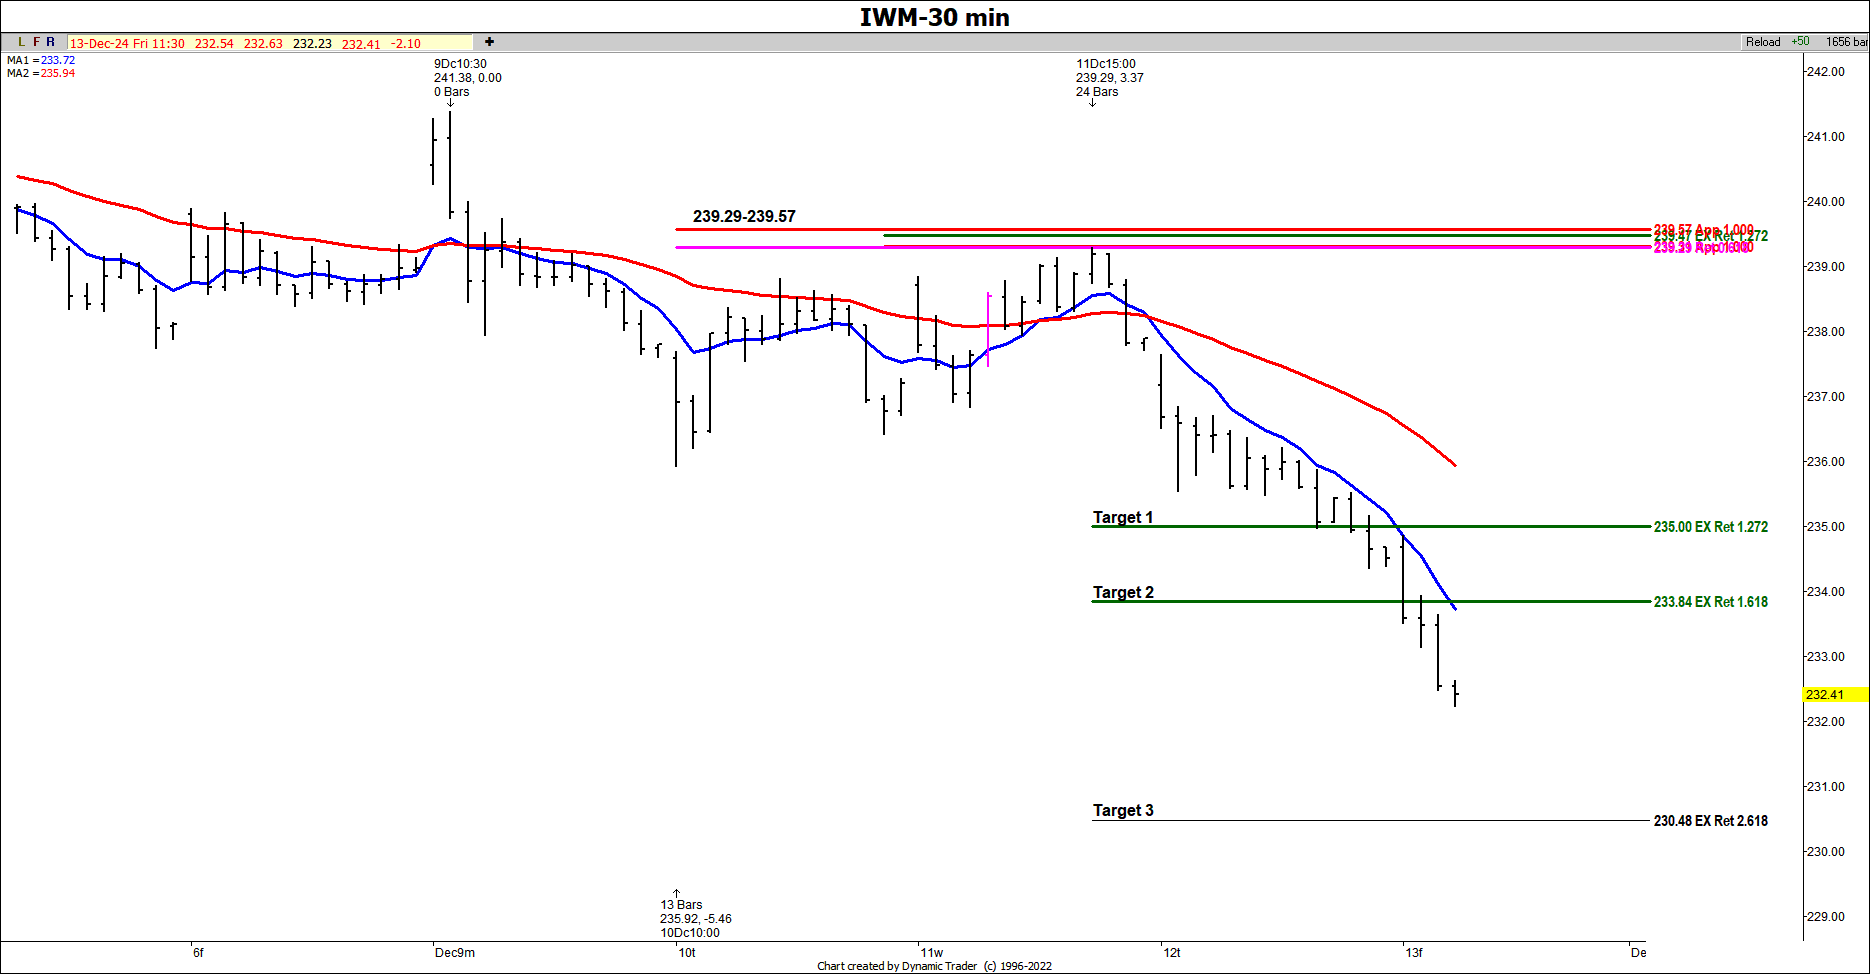
This setup on my IWM 30-minute chart was countertrend, but it was a nice hit and hold of a cluster of resistance and both targets on the downside have been met so far.


