A Lesson From Merrill Lynch History
Herding is real. It is real when it causes the market to move up beyond reasonable “valuations,” and it is real when it causes the markets to move well below reasonable “valuations.” Ultimately, valuation is meaningless, as markets rarely trade at the mean or valuation and those using it as their primary investment focus cannot tell you how far beyond the “valuation” point the stock will run on either side.
Yet, I mention valuation since today makes me feel like Charles Edward Merrill. Yes, this is the same Merrill of Merrill Lynch. For those that may not know his history, several years before the 1929 market crash, he was one of the very few that started to recognize that the market was beyond any reasonable valuation. Then, a little less than a year before the 1929 market crash, he advised all clients of Merrill Lynch to “get out of debt,” and even consider selling out of the stock market. In fact, he even published this perspective as an editorial in the New York Times, without his partner Lynch knowing beforehand. Then, not long after he warned his clients and several months before the 1929 crash, he sold all of his firm’s holdings while his partner Lynch was in Europe, and did not even tell him until after the sale was complete since he knew Lynch would not approve.
Ultimately, this same Charles Merrill changed the face of Wall Street. After the crash that he foresaw, he represented the only brokerage of the time that encouraged the average American to invest in the stock market. But, I digress.
So, I too have been raising cash into this rally over the last year. And, due to the overlapping nature of the market, I am usure how early I have been. You see, there still remains potential for one more major rally to be seen before this long-term bull market concludes.
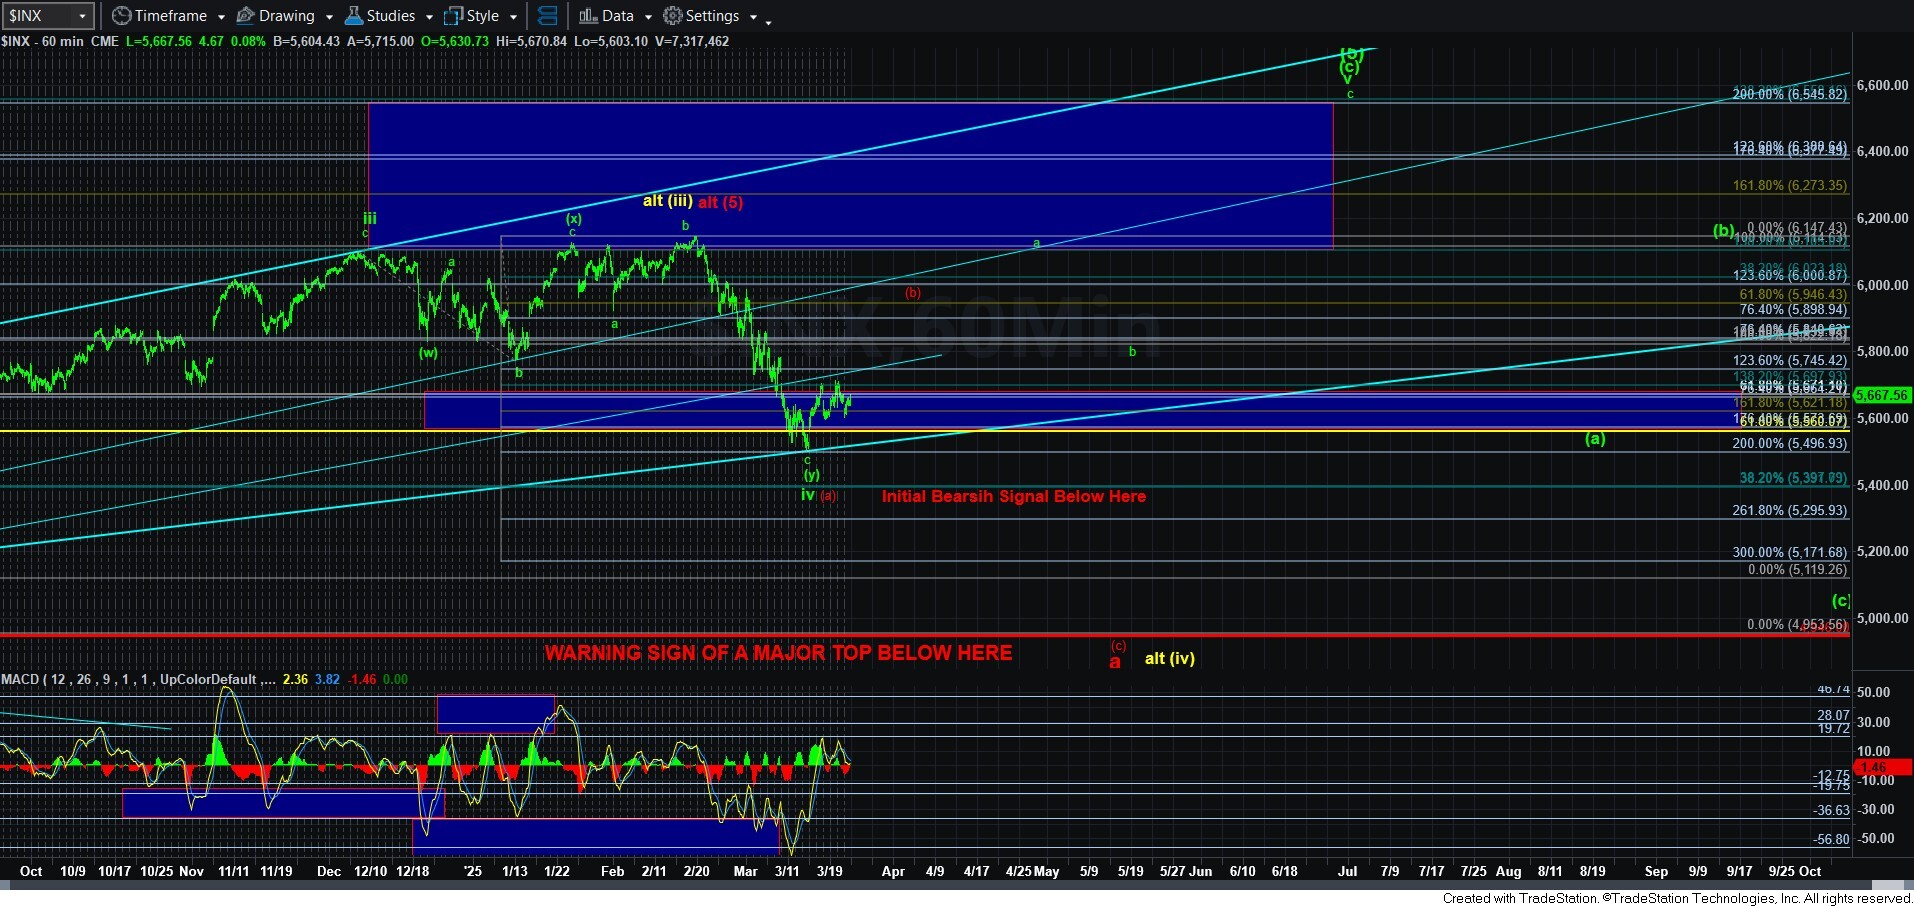
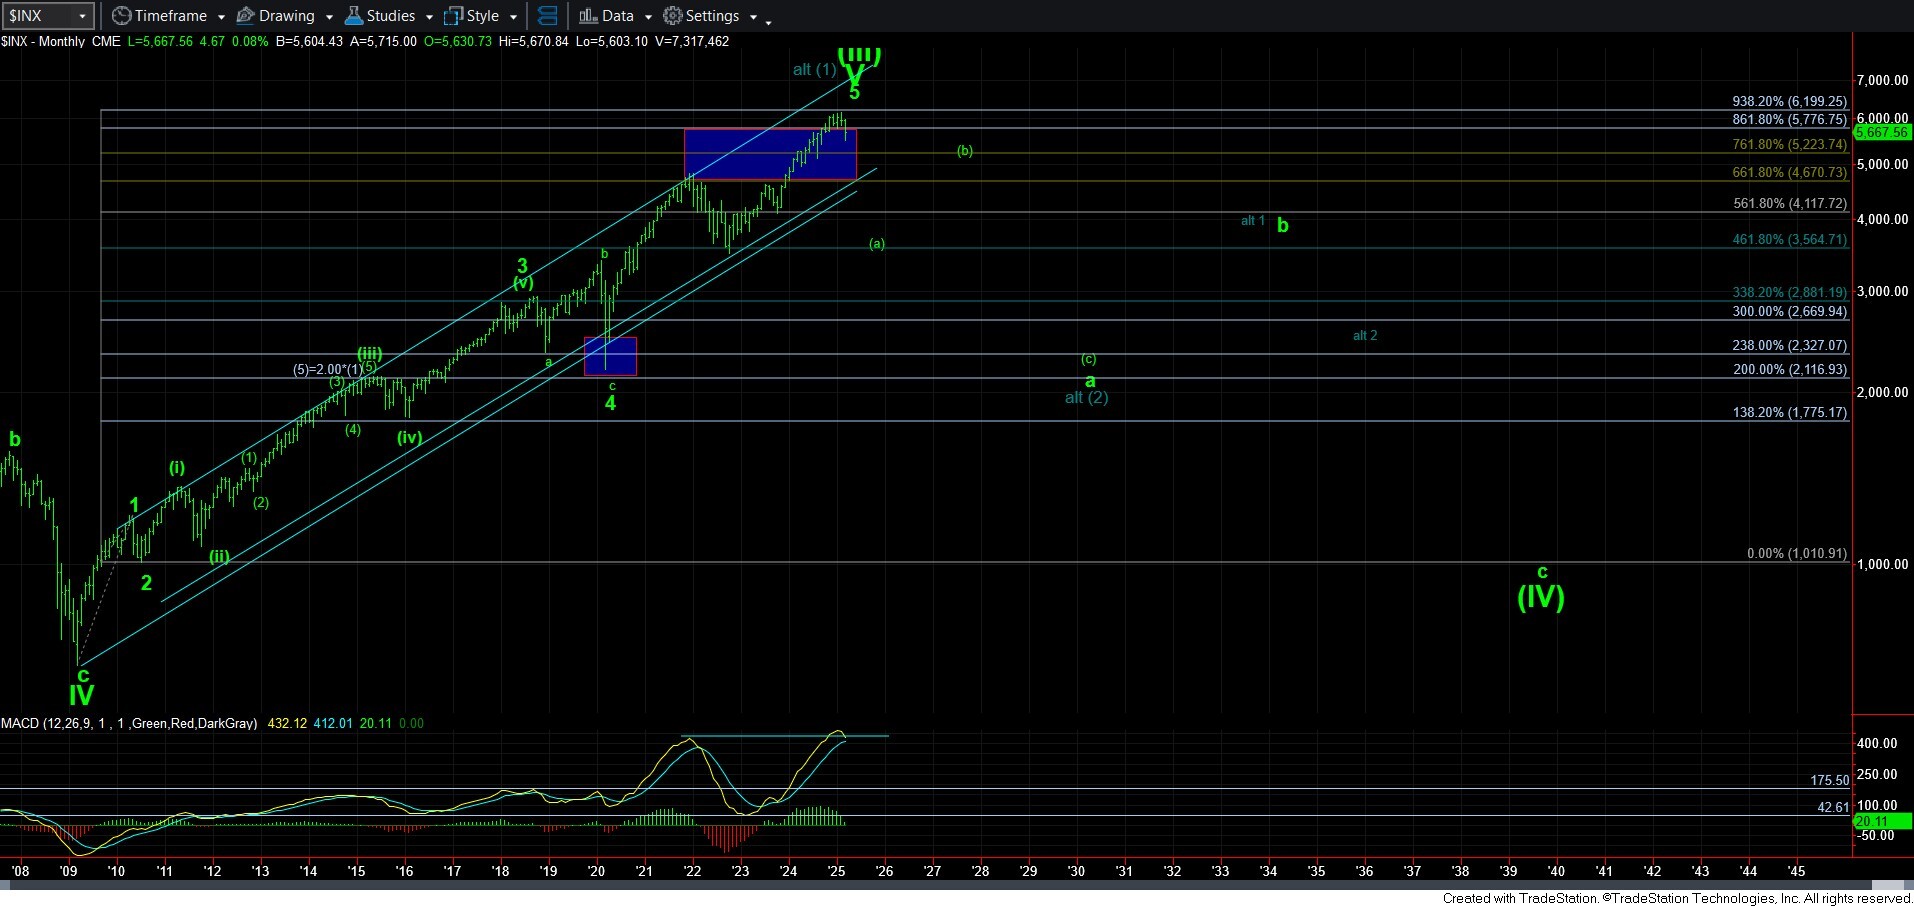
Moreover, there are two potential points from which that last rally can take hold. The first was the one from which the market is attempting a rally right now, which I had telegraphed many months ago. And, the second would be if we were unable to exceed the resistance box overhead, and then begin a drop towards the 5000SPX region. That would be the second point from which one more rally could develop. While I have strong reservations about the potential from the 5000 region (as I have explained in prior updates and live videos), it is a point from which I would likely invest some of the cash I raised in the event I get stopped out of my recent attempt at deploying some of that cash.
But, each attempt will be governed by a huge dose of caution. For example, on the current attempt, I have stops at the recent lows, and I will likely sell my positions once we get to the resistance box. I will likely buy back some of those positions once the market makes it clear that the pullback from that resistance is corrective, and then potentially add on the pullback (the green b-wave) after the market exceeds that resistance box. Yes, I am approaching this market with a healthy dose of caution.
Now, let’s talk about the move to the resistance box.
With the rally thus far off the lows, I am quite disappointed as to how the market has not rallied more strongly to the resistance box overhead. In years past, when the market has been this oversold, it usually has rallied much stronger towards this retracement region. So, this is yet another reason we need to approach this market with a healthy dose of caution.
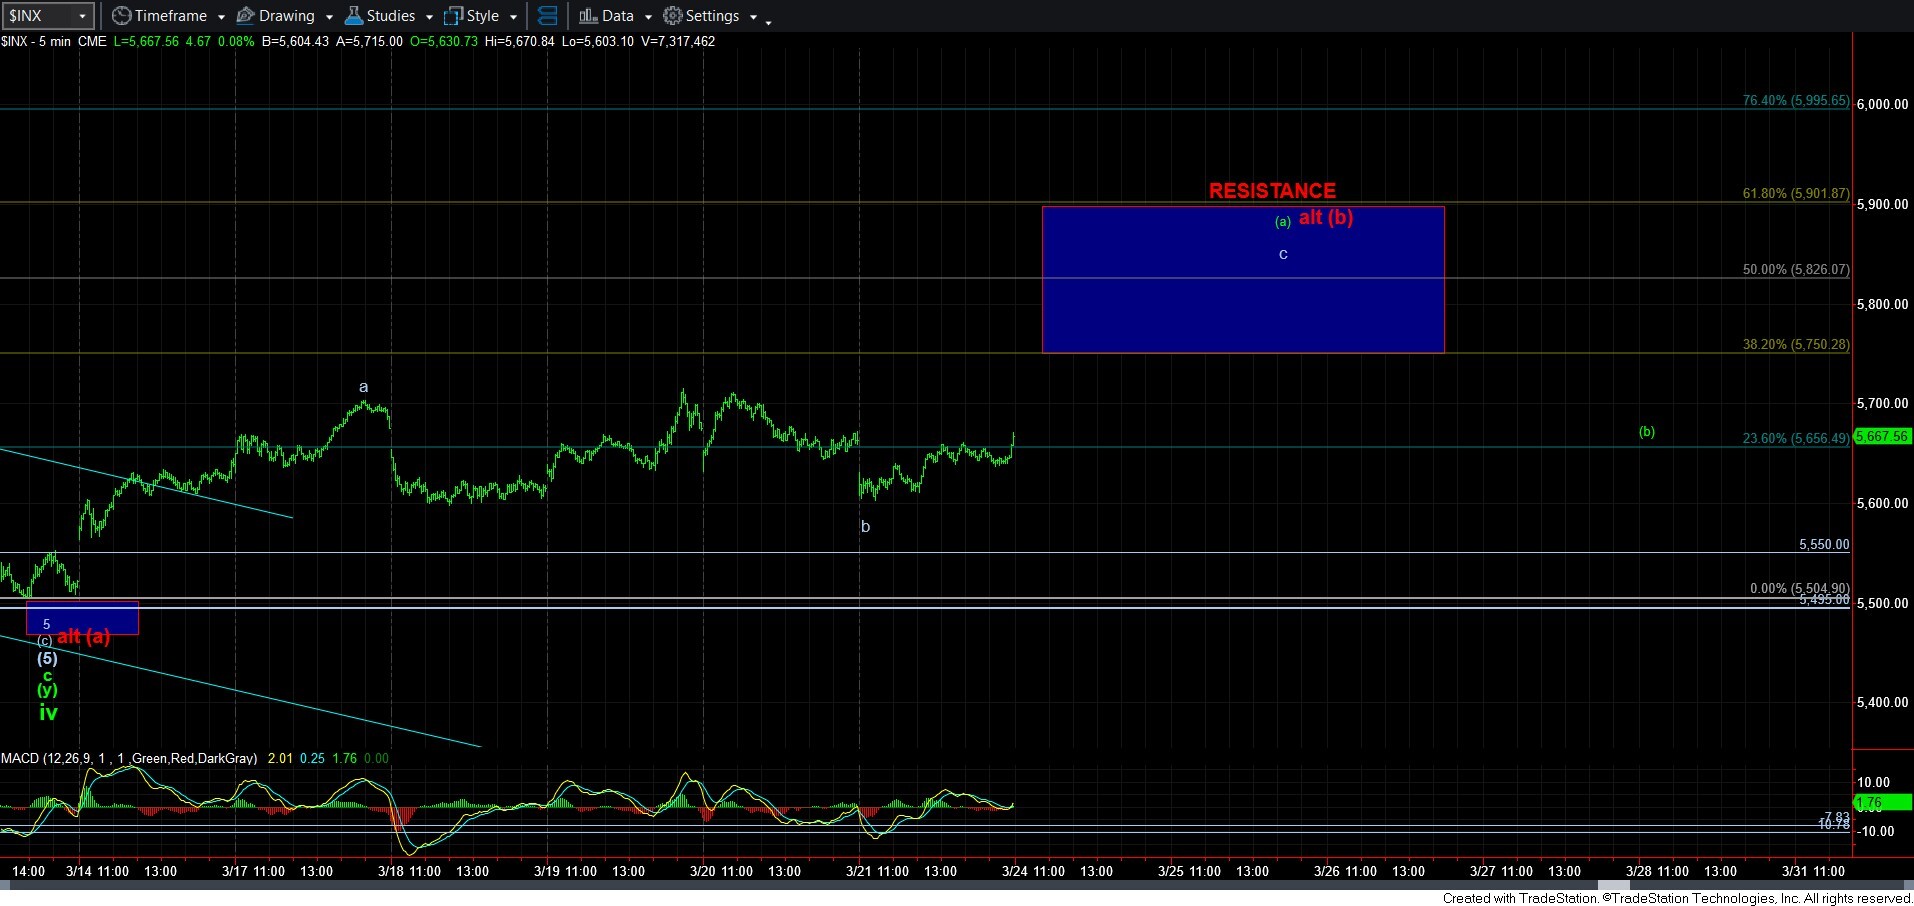
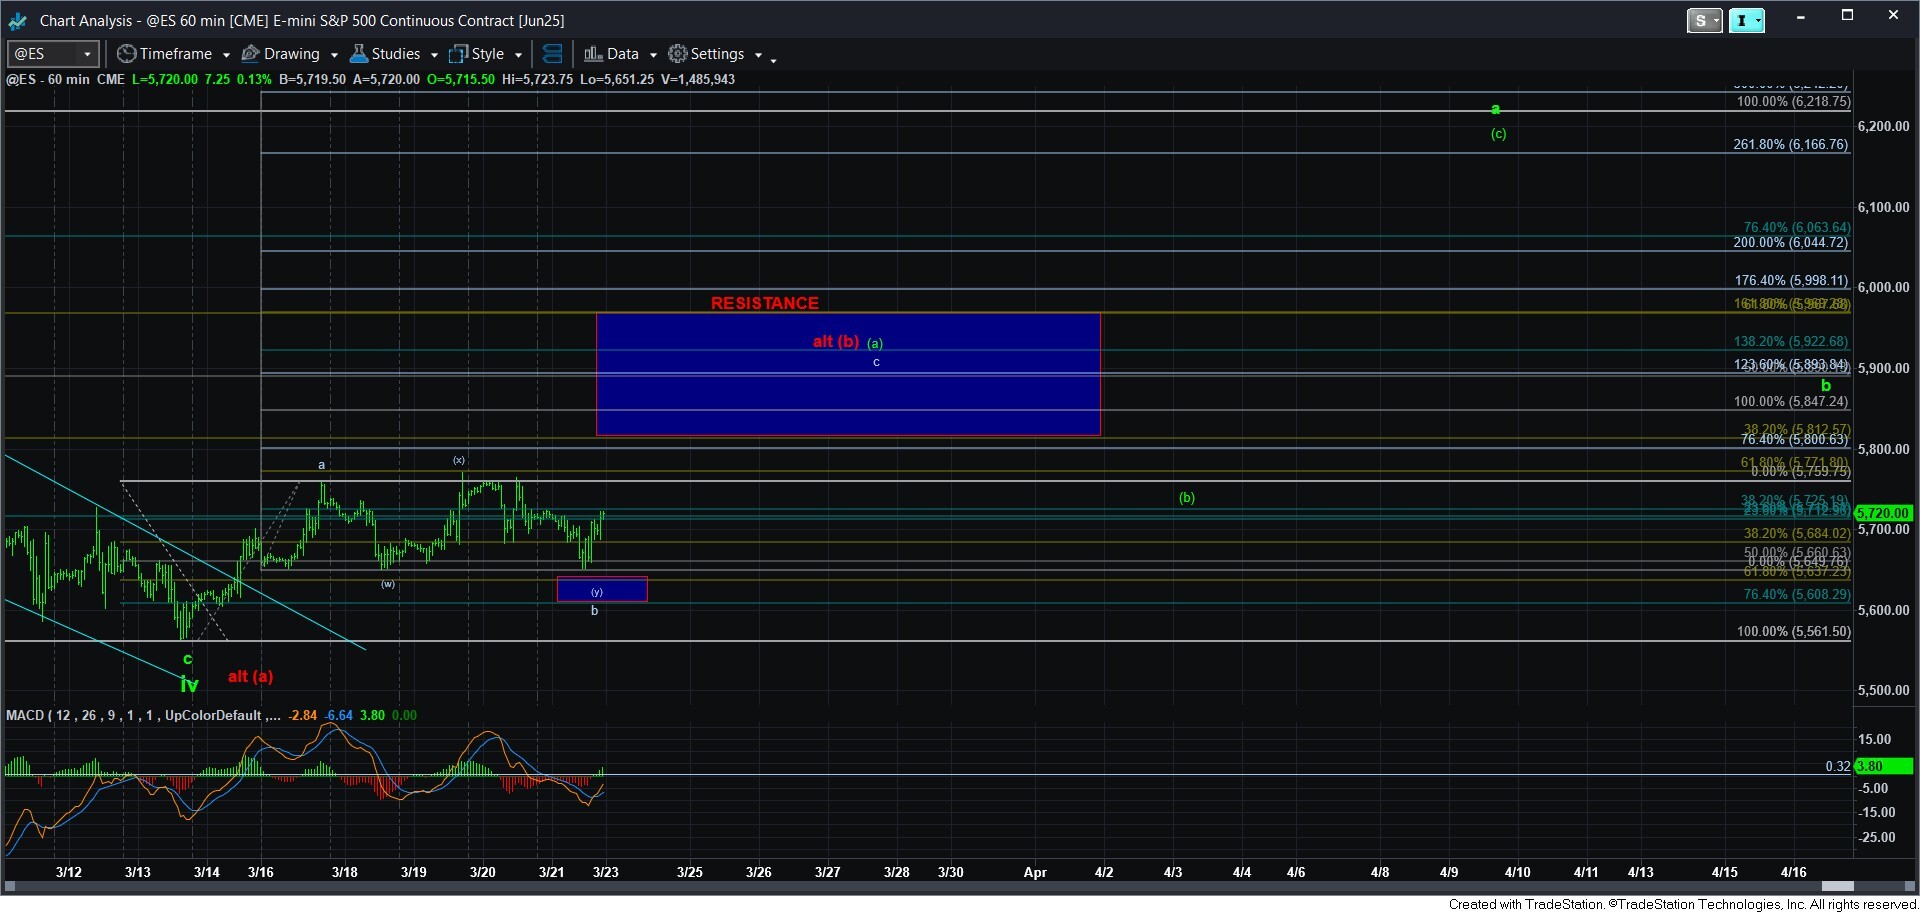
You see, the market has taken a relatively long time to seemingly complete a b-wave pullback off such an oversold condition. But, for now, that is how I am viewing the consolidation we have seen this past week. While the market can still see one more lower low into the support box on the attached ES chart, as long as that box holds as support, I am looking up for a c-wave rally into the resistance box overhead.
The reason I say that there is potential for one more lower low is that the rally off the low on Friday can only best be counted as a leading diagonal. And, as many of you know, I do not trust that type of structure for a strong trading cue. The other potential was that the rally on Friday was a 4th wave in an ending diagonal for the [c] wave of the b-wave pullback, which would suggest one more lower low into the support box early in the coming week. For now, I have it counted as completed as a [w][x][y] pattern, but I wanted to explain that I am not confident in that micro perspective. But, my main view is still looking for a c-wave rally to take us to the resistance box overhead as long as that support box holds.
Based upon the current structure, I am really not yet sure how deep into the box the market will take us. You see, there are 3 calculations with potential confluence right now, two of which seem a bit better. First, c=.764*a just below the .382 retracement and the bottom of the resistance box. But, the next two provide better confluence and would seem to fit the bigger pattern better. Those points would be the .500 retracement in the 5890ES region wherein c=1.236*a, and the 5965ES region wherein c-1.618*a. So, we will have to rely on the size of the 3rd wave of the c-wave to tell us which of those targets will represent the most likely stopping point for the next rally.
Now, here comes the most important point, which has been reiterated many times before. Much depends on how the market pulls back from that resistance box overhead. Should the pullback be clearly corrective in nature (the green [b] wave), then I will remain in the green count pointing us higher one more time in the coming months. However, should that pullback be clearly impulsive, then I will likely be viewing it as the start of the [c] wave down to the 5000SPX region, as presented by the red wave count.
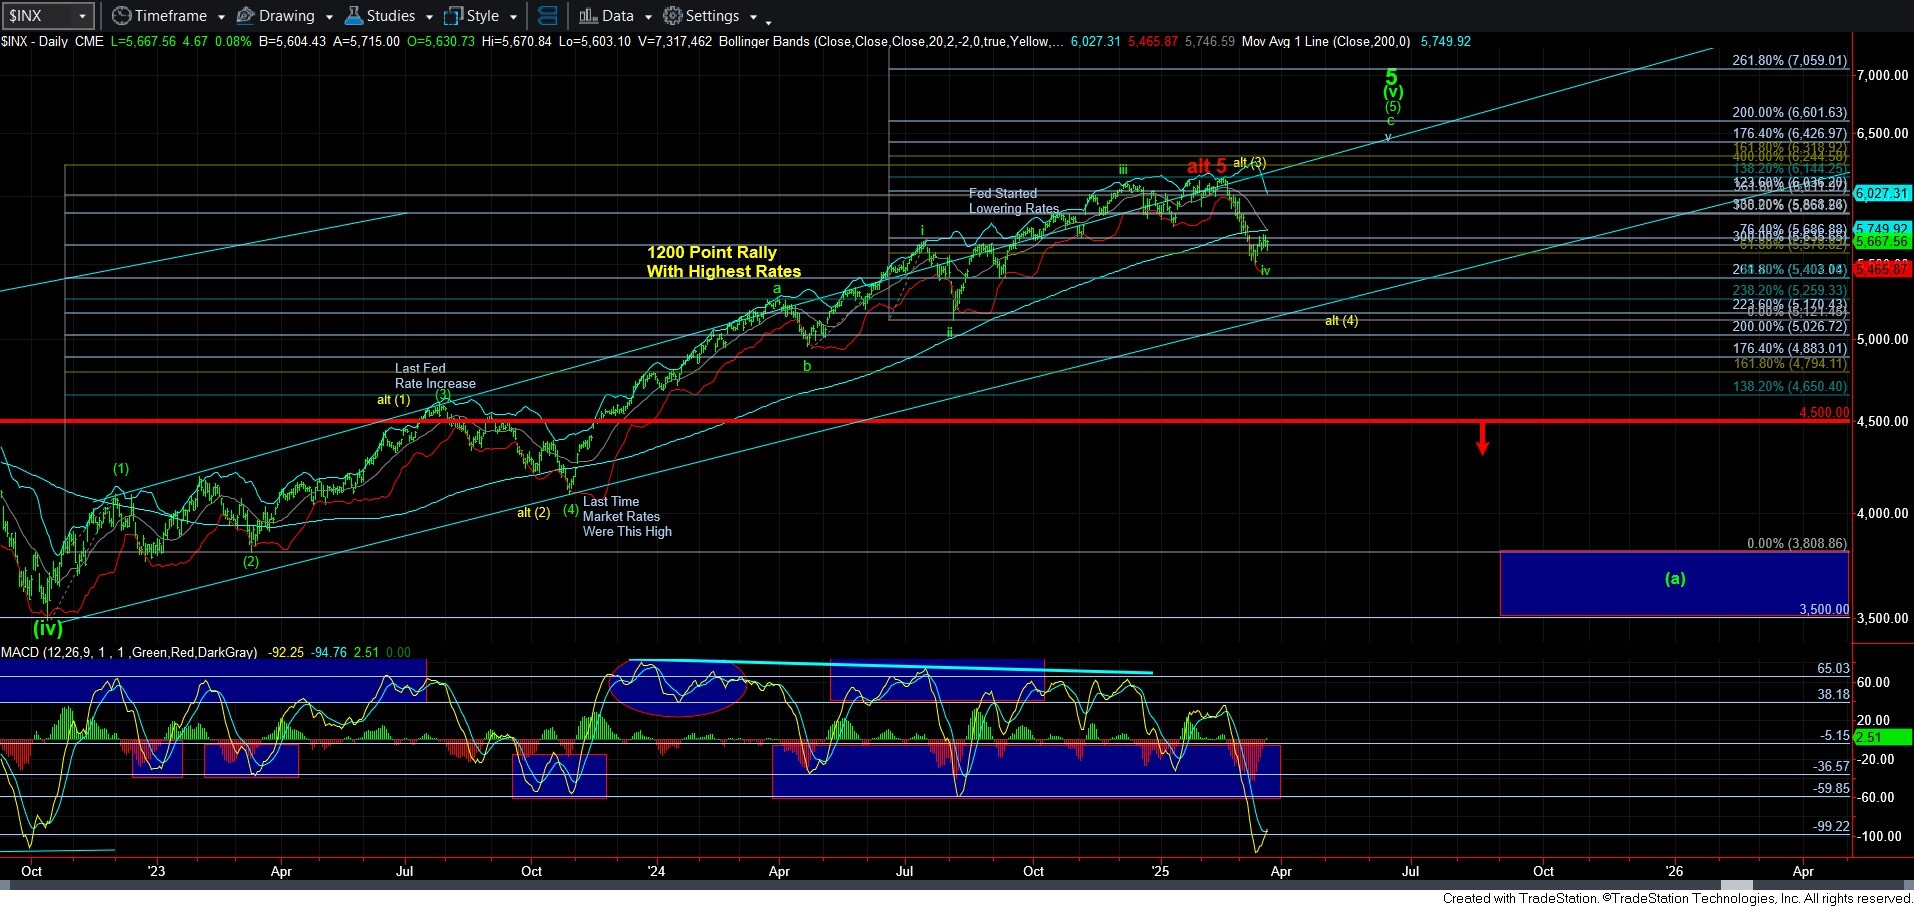
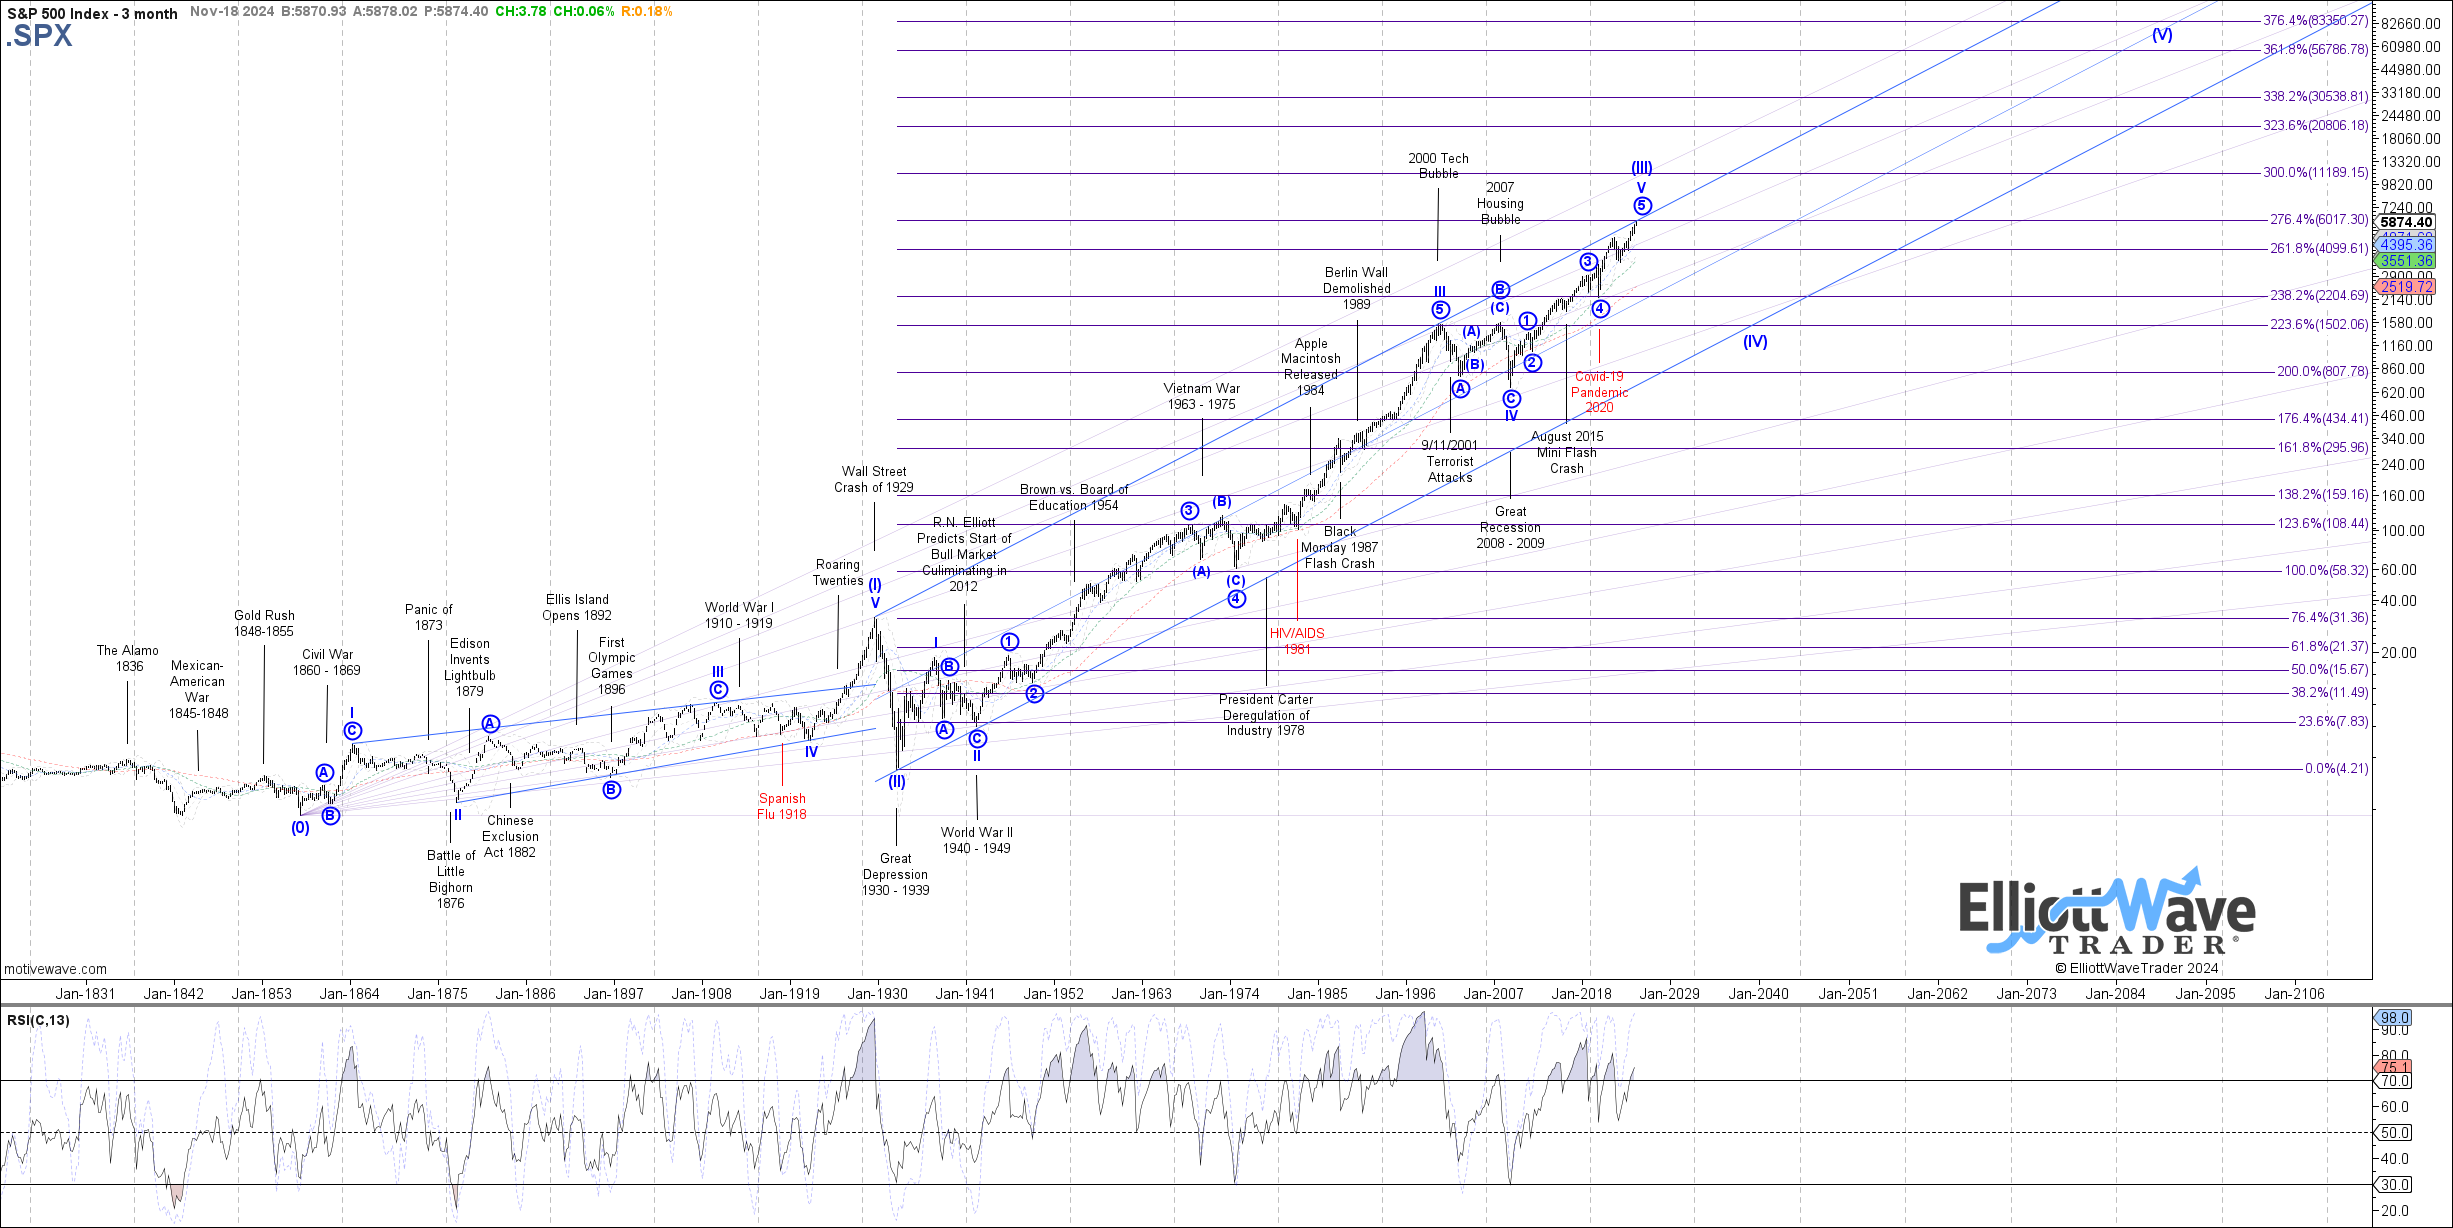
So, no matter if you agree or disagree with my views and approach to the market, I want you to at least be cognizant of the risk inherent in the big picture of our market today. As you can see from the attached 100+ year chart of the SPX, we are likely approaching what many would consider a generational market top. We are likely the concluding a 90+ year 3rd wave rally off the 2nd wave low struck at the bottom of the 1929 market crash. And, we are doing so in our own roaring 20’s. While the manner in which we can drop from this generational market high we are developing will likely be different than the 1929 crash (based upon Elliott’s theory of alternation), the overall result to the world of finance likely will not, other than it can potentially last a lot longer.