Anatomy of an NFLX Fibonacci Trade
Royal setups are some of the highest probability trades that we look at in the Fibonacci service. This essentially means that all of the moving averages on my daily chart are on the side of the trade.
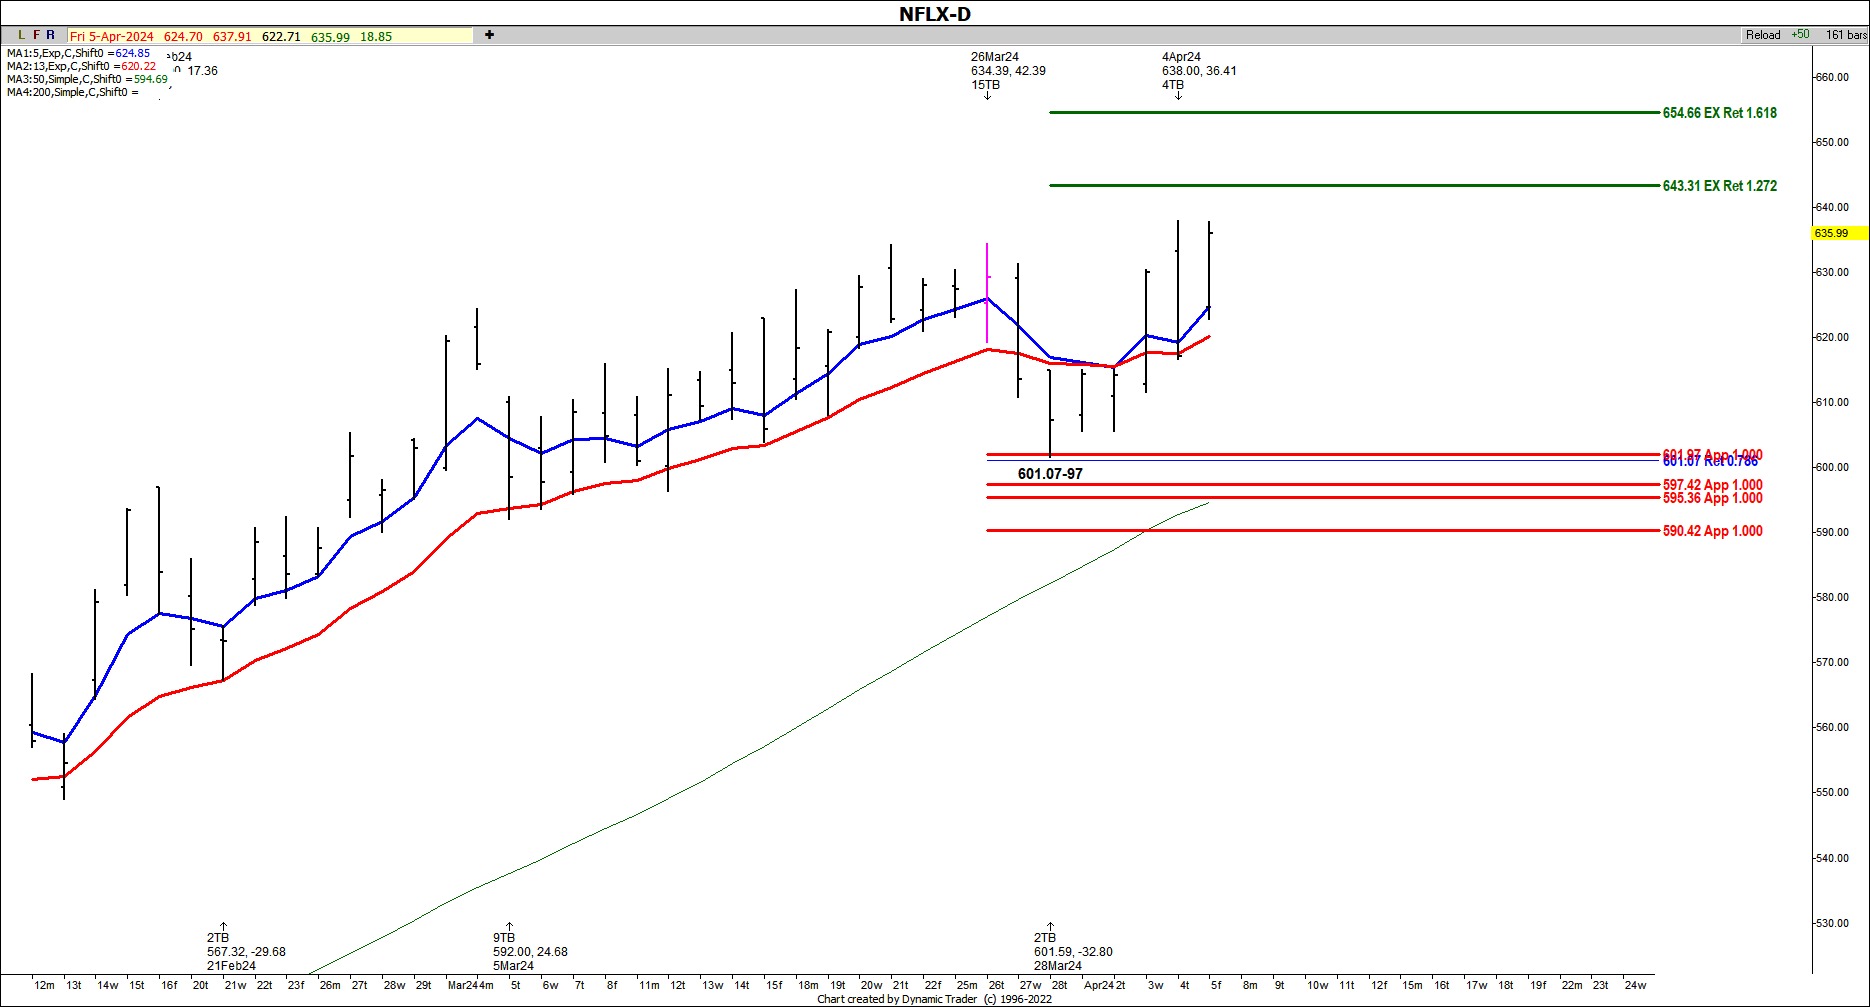
For example, I use the 200 simple and 50 simple moving averages on the daily chart, along with a 5/13 ema combo. When price is clearly above the 200 and 50 simple moving averages and the 5/13 ema combo is bullish with the 5 ema above the 13 ema, then buying a pullback into a zone is considered a higher probability setup.
One of the royal setups we saw late March was in NFLX stock. When NFLX pulled back into the 601.07-97 decision point with a symmetry projection and a .786 retracement, all the averages were on the side of the bulls. Price was above the 200 sma and the 50 sma, and the 5/13 ema combo was in a buy mode. The actual low was made at 601.59 directly within this price support zone.
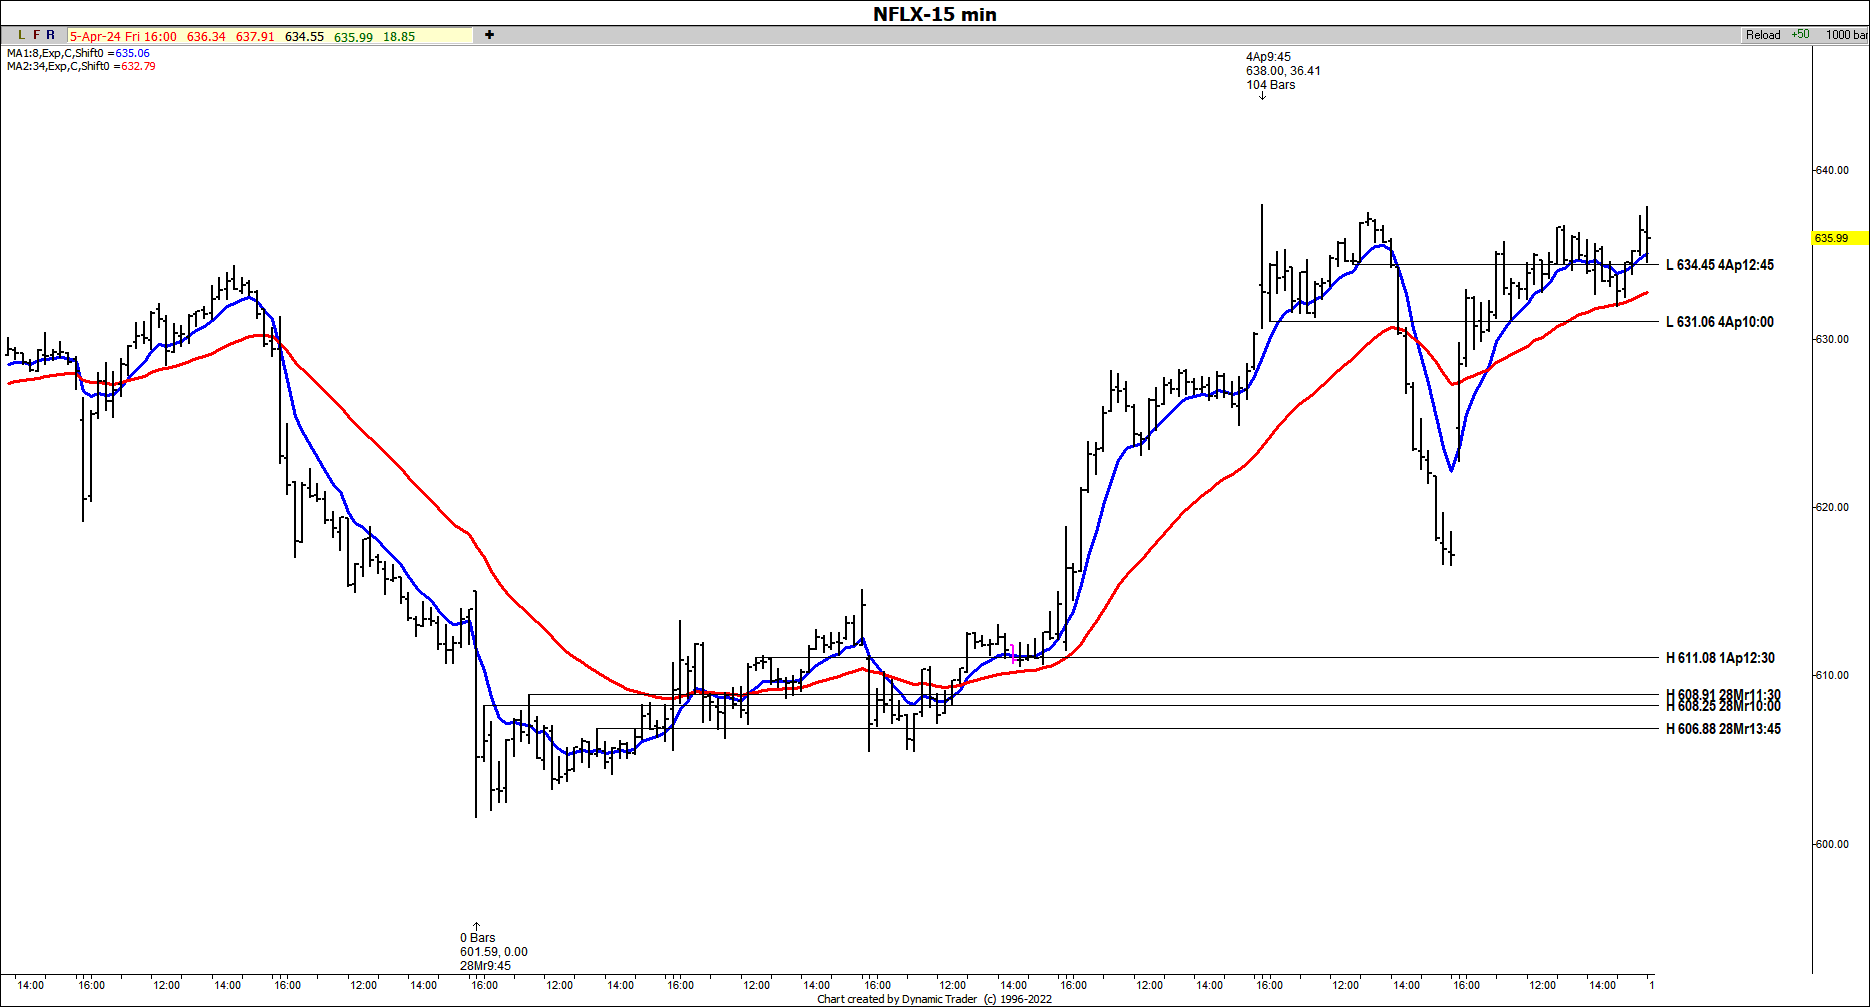
Our first buy trigger was for a swing trade entry after the 15-minute chart triggered a buy entry against the zone. This happened when we saw the 8/34 ema combo on the 15-minute cross to the upside. I also wanted to see it take out a prior swing high -- see on the 15-min chart three swing highs that it took out while making the moving average crossover.
The buy entry would have been around the 611 area when we had a clear crossover to the upside. The initial rally off the price zone was $36.41. If you used a prior swing low for a trailing stop, you could have been stopped out of the long at around the 634.45 area, or at around 631.06 depending on how tight of a trail you used. Remember the way to make money with this work is Setup + trigger = trade entry and then you manage it.


