Anticipating The Low In the SPX
Many market "timers" never actually use the TIME AXIS of the markets to help determine where to watch for possible market turning points. This is one of the things we do in the Fibonacci Markets & Stocks service on EWT.
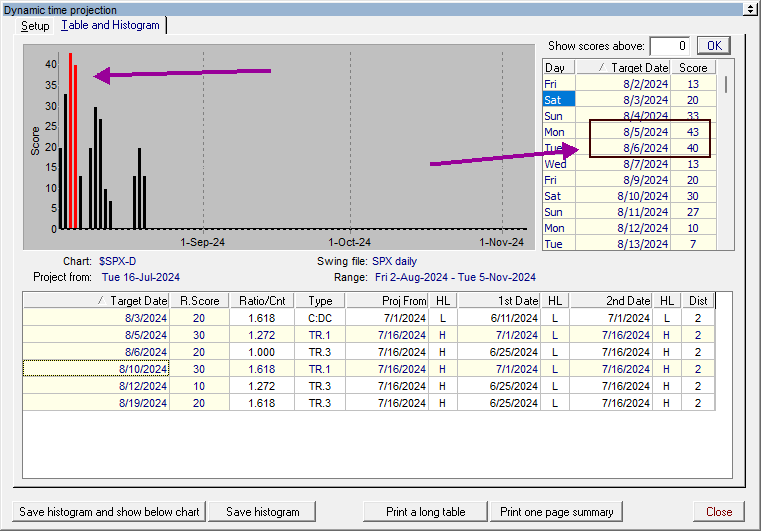
For example, when the SPX was going straight down we were wanting to know where we might put in a low. So we used the Dynamic Trader timing histogram, which measures the time between key highs and lows that we identify on the chart and then shows us where we have standout clusters of timing factors.
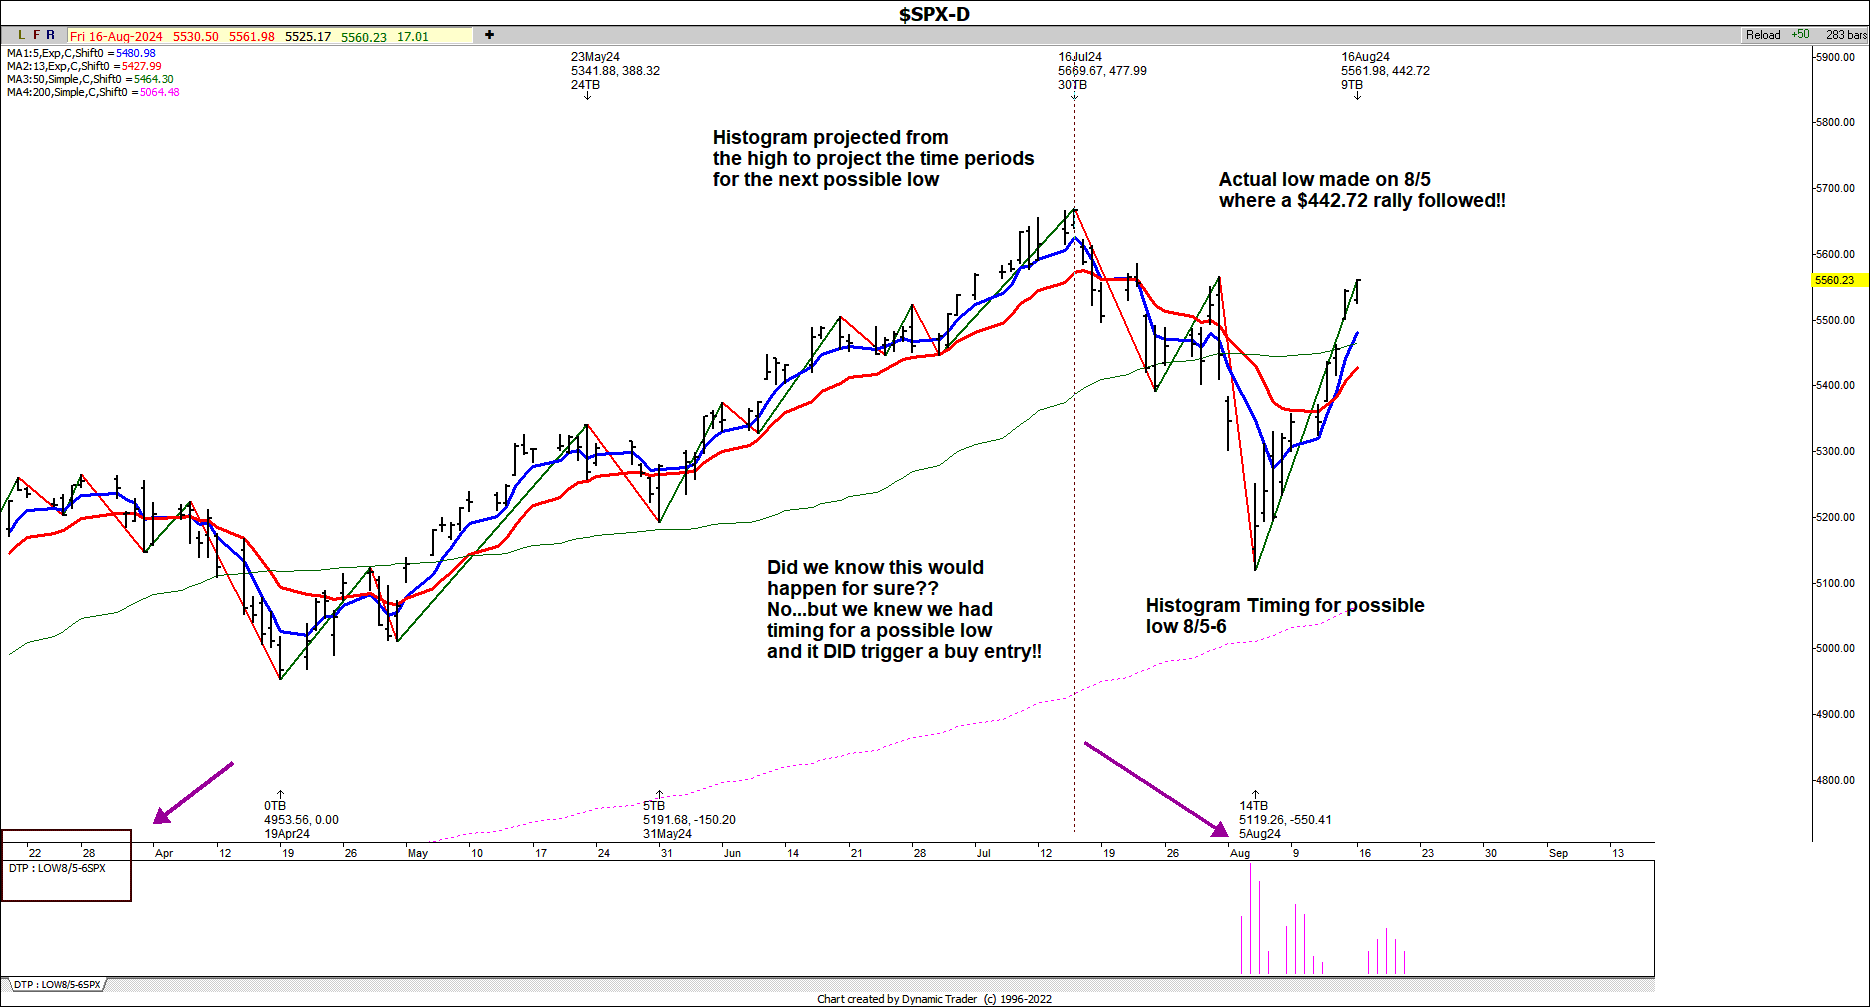
In the example of the SPX, August 5th and 6th stood out on the report, and the actual highs and lows used were also visible. Since the SPX was going straight down into this time window, we were anticipating a possible low and reversal back up as the market was plummeting. The actual low was made on August 5, which was followed by a $420.64 rally off that low.
On the actual SPX chart, you can see that the histogram is below the chart, and on the left it tells you which dates are the standout. It's a great visual to have as far as knowing when the higher probabilities for a reversal are indicated. We use the histogram (calendar day projections) in our service, especially for intraday timing, and we also use the outright timing cycles for these reversals.. If you were short the SPX or ES, this would have been very helpful information for you to have.


