Awaiting Wednesday Before Monthly OPEX Week for Market Clues
The head and shoulders pattern we have been tracking pretty much invalidated last week with the sustained move through 2810 area. So we were right on the expectation of a bounce off the lows at 2730, but I certainly did not expect us to get through 2810 area this easily.
In this current week before OPEX week, we'll look at Wednesday for clues on what to expect into OPEX. Generally, we get a nice pullback into the Wednesday referred to as WWW -- the Wednesday of the week before monthly options expiration week. And after this pullback, we typically get a rally into OPEX week.
This time, however, we are moving higher into WWW, so we have the possibility of setting up a decline into OPEX. This is certainly a less likely scenario if you look at all monthly OPEX’s. However, if you look at quarterly OPEX’s alone, the odds increase greatly for the bearish outcome to play out. Dec 2018 is one that comes to mind, as the market bounced into the Dec 12 WWW and then fell HARD from there. Not saying this has very high odds to happen, but it is something worth watching. Our Razzmatazz waves also seems to support this view.
Having said all this, though, we are currently flat the market and waiting for our indicators to tell us what to do next.
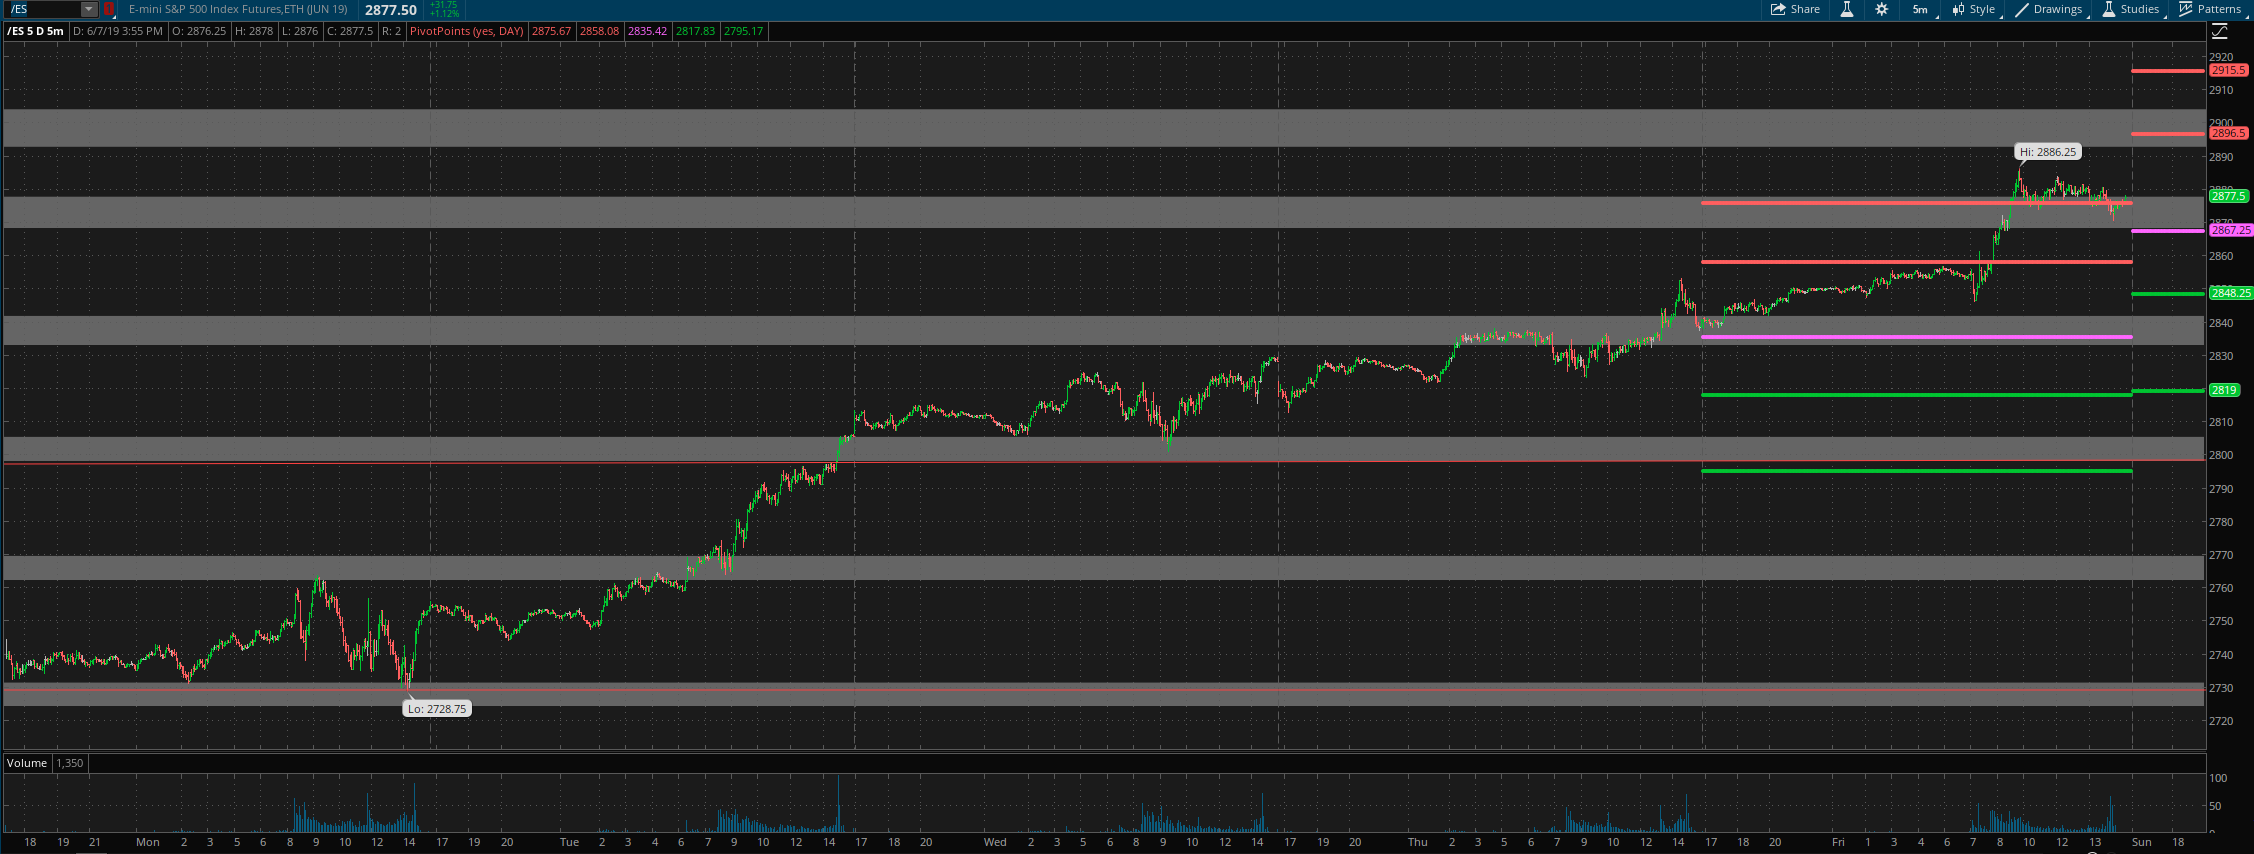
ES Grey Zone areas: The grey zones on the ES 5 min chart below are what I draw in on a discretionary basis. They are support and resistance areas from which the market is most likely to react. If we test a zone from below, it is likely to be rejected and fall lower to test support zones below. If we test a zone from above, it is likely to take support there and begin a move higher. So these zones can be used for intraday trading and/or as entry points for positioning for swing trades. These zones are drawn in based on what the market has done there previously both on smaller and larger timeframes.
On the upside, we have grey zone resistance at 2893-2904 and then 2929-36. On the downside, we have support at 2877-68 and then at 2840-33.
ES daily pivot is at 2867. Resistance R1 is at 2896.5 and R2 is at 2915.5. Support S1 is at 2848 and S2 is at 2819.
All the best to your trading week ahead.


