Barrick Gold Corporation - Taking A Shine To Copper
 By
By
Barrick Gold Corporation (GOLD/ C.ABX) - Taking a shine to Copper (Technical Analysis)
Written by: Mark Malinowski and Zac Mannes
Barrick Gold Corporation maintained a flat production year in 2024, but maintained the cost discipline necessary to take advantage of significant top line growth to provide excellent free cash flow.
We called Barrick a copper growth play back in July of 2024 and it’s even more clear now.
Guidance for 2025 shows a flat production level compared with 2024 but the company remains poised to to take advantage of record gold and copper prices. Management continues signalling that they feel their stock is undervalued.
Further out in time, Barrick is guiding to increase production by 40% by 2029 through increased investment abroad but that appears less risky than it looks on the surface.
Technical analysis shows potential opportunities for investors, with Wave Setups providing clear risk-reward parameters based on Elliott Wave and Fibonacci Pinball principles.
Introduction
If Newmont Mining (NEM) is the injured All Star on the team that is set to rebound from injury to come back better than ever; then Barrick (GOLD) has been the injured player that has been getting paid a lot of money to sit on the bench and do nothing. Some people might think of Barrick as the player that has not reached their potential. Maybe they just need to change the coaching staff? Or are they actually operating in the middle of the pack again and making a charge for the finals in the next few years?
The price of Barrick has reflected a view that the company is currently going nowhere fast as it has traded in a relatively tight range over the past 9 years. In fact as of writing, going back to June 2016, Barrack (GOLD) is up ~1% over that time period, while the metals they mine have increased in value ~ 140 %.
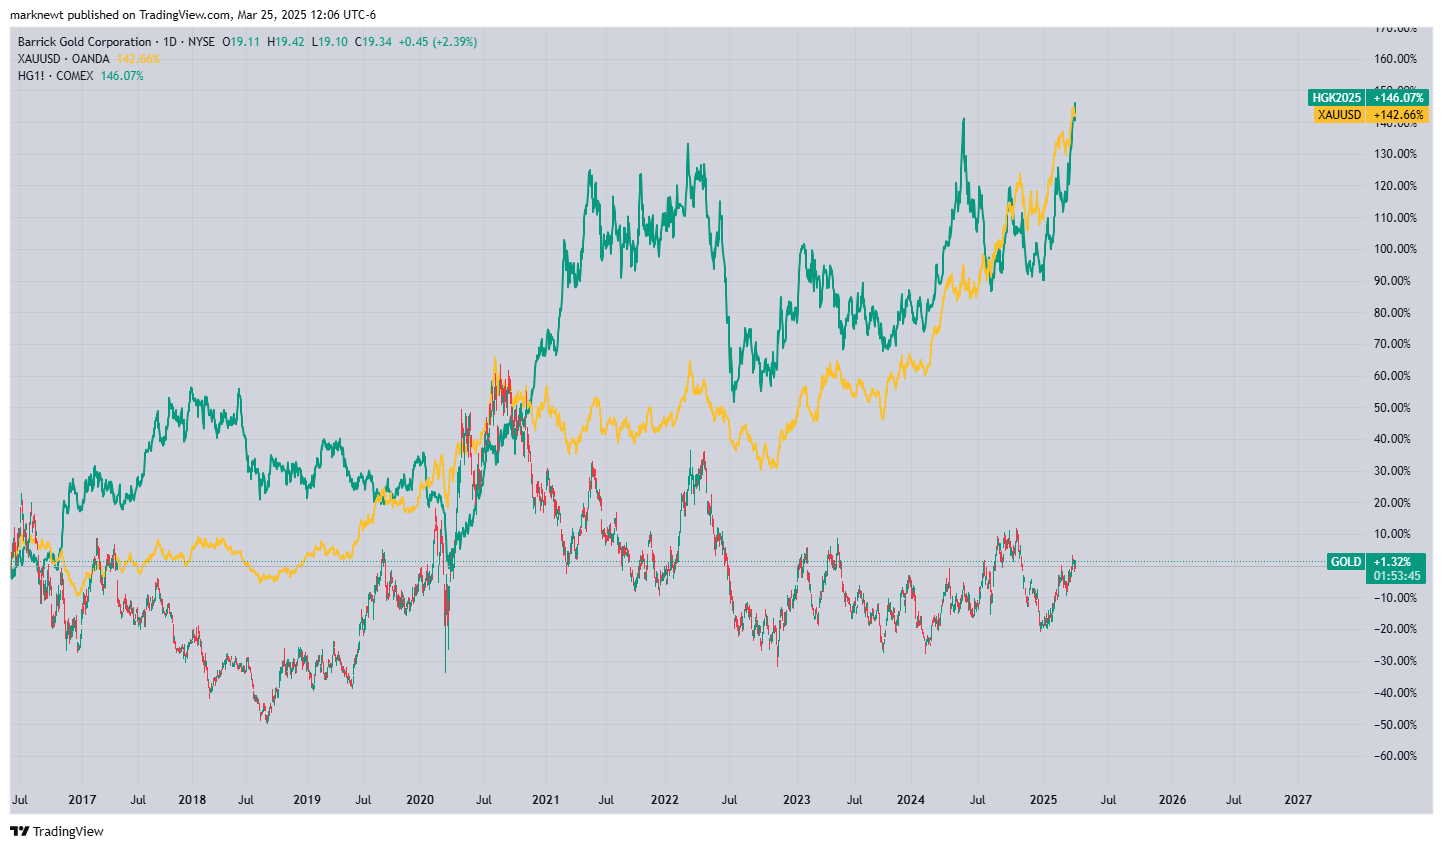
Percentage Performance of Barrick vs Spot Gold vs Spot Copper June 2016 forward
While some analysts have only recently cottoned on to Barrick as a copper play, we saw this clearly 8 months ago. Looking back in July 2024, we penned an article on Barrick and how they compared with Newmont and Agnico Eagle. Large new copper mines are the focus in their growth profile, but as usual they are taking on a higher risk profile than other companies might. However, they are funding it without borrowing and doing it one step at a time.
Barrick Gold Corporation (GOLD/ C.ABX) Fundamentals
Full Year 2024 vs 2023
The largest impact on the annual report for Barrick Gold was the price of gold. It is really clear to see when: one, there is a large number of top line and bottom line financial numbers that increased significantly over 2023 (even more so compared with 2022); two, costs were slightly up while production remained mostly flat. Free Cash flow more than doubled at ~$1.3 B in 2024 compared with ~$650 MM in 2023 and ~450 MM in 2022. This reflects the fact that the company maintained some discipline with their spending while they watched the price of gold ramp up over the entire year. Free cash was mostly returned to shareholders in the form of dividends. So mostly positive news in the near term. Debt and cash remained flat year over year and the balance sheet is one of the least levered in the industry.
Share Repurchase Program - 2025
Barrick has renewed their share buyback program and has authorized up to $1 B for 2025, after purchasing $498 MM in shares in 2024. To me this represents management’s continued belief that the stock price is undervalued.
2025 Forward Guidance Review
Three things stand out for me when I look at the forward guidance that Barrick provided in February.
First, they are projecting a flat to slight decrease in total production. How much of an impact this has on the bottom line depends on two things they can control.
Primarily, for gold production, output depends on when the Loulo-Gounkoto mine in Mali is able to resume production and at what rate. Barrick (80% owner) has been in a dispute with Mali since 2023 when the government introduced new mining rules. The mine represents ~14% of Barrick’s gold production. Operations were halted in January after a seizure of 3 tonnes of gold by the military government from the site. This past week, there has been a report from Reuters, of a forecasted increase in gold output from Mali, based on a resumption of operations at Loulo-Gounkoto. If Barrick can negotiate favorable terms and resume operations soon, the loss in output could be minimized to 5% or less.
Barrick Annual Report 2024 - Financial Review Page 19
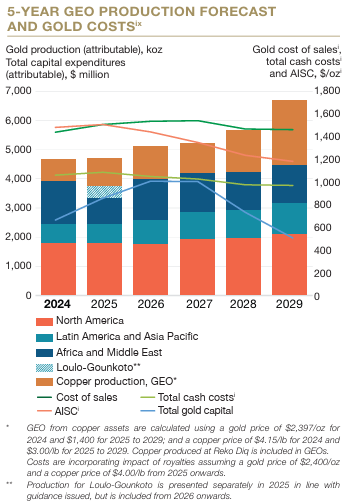
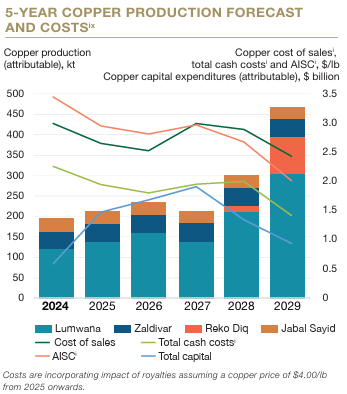
Secondary for projected output is a ramp up in copper production. The range in output is estimated at 3% to 18% increase year over year. While this might not seem like much, cash from copper operations could result in an increase in total output. The copper output step change is really focused on 2028 and 2029.
I noted that Barrick is forecasting a much better average in the area of cost control than other major producers I have looked into recently. This does not mean they have not seen a steady increase over the last several years.
2022 | 2023 | 2024 | 2025E | |
Copper AISC ($/lb) | 3.18 | 3.21 | 3.45 | 2.80 - 3.10 |
Gold AISC ($/oz) | 1222 | 1335 | 1484 | 1460 - 1560 |
Table 1: All-In Sustaining Costs, AISC, Barrick Gold Annual Report 2024 Page 1, Page 92
This will require continued discipline over the next several years as they build out production at the Lumwana Super Pit and commission/ ramp up Reko Diq. I do find this to be believable based on Barrick stating they have 10 year individual mine plans now in place. The question is can they execute to meet those plans. All-In-Sustaining-Costs, AISC, is expected to be flat for 2025 and ramp down in 2026 through 2028.
Third, Barrick pushed some important projects closer to the final hurdles. They did this by converting resources to reserves in several of their gold and copper projects. Attributable contained gold reserves grew by 12 million ounces after 2024 depletion. Attributable contained copper reserves grew by 12.4 million tonnes after 2024 depletion.
The combination of these three things is the start of putting Barrick back on the growth radar. Keeping the bottom line flat to trending up, managing operational costs and growing reserves are three positives I see for the company over the next 12 months.
Longer Term - Growth
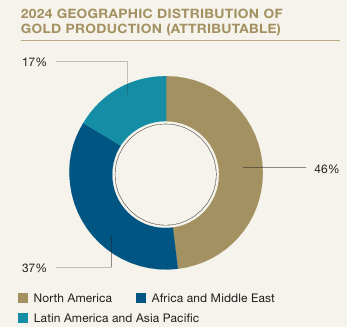
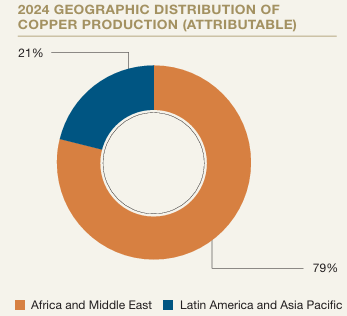
Barrick currently produces just under half of their gold from North America. While copper production is primarily focused in Africa and the Middle East at just under 80% of total output.
Barrick Annual Report 2024 - Financial Review Page 5
Looking at the Barrick forecast charts, gold and copper production are being guided at different rates of growth in different operating regions. The majority of growth is focused outside of North America. As a result, some might be concerned that there is a significant shift in the company's geographical risk profile over the next 4 years. However, when looking at the totals, only 7% of production is shifting from North America to Africa and the Middle East. The growth plans also represent a 45% increase in total production.
Operating Region/ Forecasted Production Estimates | 2025E GEO | 2028E GEO | % Total Production 2025 | % Total Production 2028 |
North America | 1800 koz | 2100 koz | 38.3 | 31 |
Africa and Middle East | 850 koz | 1750 koz | 18.1 | 25.5 |
Latin America and Asia Pacific | 2050 koz | 3000 koz | 43.6 | 43.8 |
Totals | 4700 koz | 6850 koz | ~ | ~ |
Table 2: Data from Regional Highlights, Barrick Annual Report
Recent reports have suggested that costs are increasing on the Reko Diq project in Pakistan by as much as 60% (50-50 ownership with Pakistan and Barrick). However, challenges of this nature are far from new news given the fact that the project was in arbitration back in 2011 through 2017. A settlement agreement was only reached in 2022 allowing the project to restart. Higher financial risk is part of the territory that Barrick works in and should be something that every investor is aware of.
Summary
Clearly Barrick Gold is showing that they can manage their money and manage their operations despite operating only 6 Tier One gold mines compared with Newmont’s 10 Tier One gold assets. Their production curve is set to remain flat over the next couple of years. The clear advantage they have is steady state operations with record high gold and copper prices. The growth of their production curve is just around the corner with a ramp up hitting a peak in the next 24 to 36 months.
The primary disadvantages are related to geopolitical instability risks. Barrick operates in 14 countries which does spread risk essentially across the globe. However, with 60% of their production coming from non-North American locations, the geopolitical instability risk is evident with the issues they have experienced in Papua New Guinea, Mali and Pakistan over the last decade.
Barrick has relied heavily on CEO Mark Bristow to negotiate his way through these issues of changing regulations, forced contract changes, and military coups. In my opinion, he continues to navigate difficult issues in challenging environments like no other. The not so distant future challenge will be in finding someone with his skillset to replace him when the time comes for him to retire.
Technical Analysis of Barrick Gold Corporation (GOLD/ C.ABX)
Where did we start?
Barrick Gold has been covered by the Stock Waves/ Metals, Miners and Agriculture service from the start, 14 years ago. We have published many articles about potential upside over the past several years, but this has remained a challenging long term, buy and hold investment. Instead we have watched it operate as a diagonal with some rather sharp moves in both directions.
Where can we go?
Here is the picture we are looking at today. Of course, for our members we provide support levels and direction calls based on structure off the lows as well as forecasting of targets and support levels based on established Elliott Wave and Fibonacci Pinball principles.
This chart presents a diagonal structure, which to the seasoned investor can provide for many opportunities, up and down. These fluctuations can be used to manage one's positions, like trimming and reinvesting around a core. Similarly reducing the cost basis through more advanced strategies like selling covered calls. For the less familiar, this can feel like whiplash, or worse yet, selling low and buying high. We guide our members with predetermined levels to watch for buying and selling in the bigger picture and we will do the same for this Newmont setup. Some of those levels have been removed from this chart for members only.
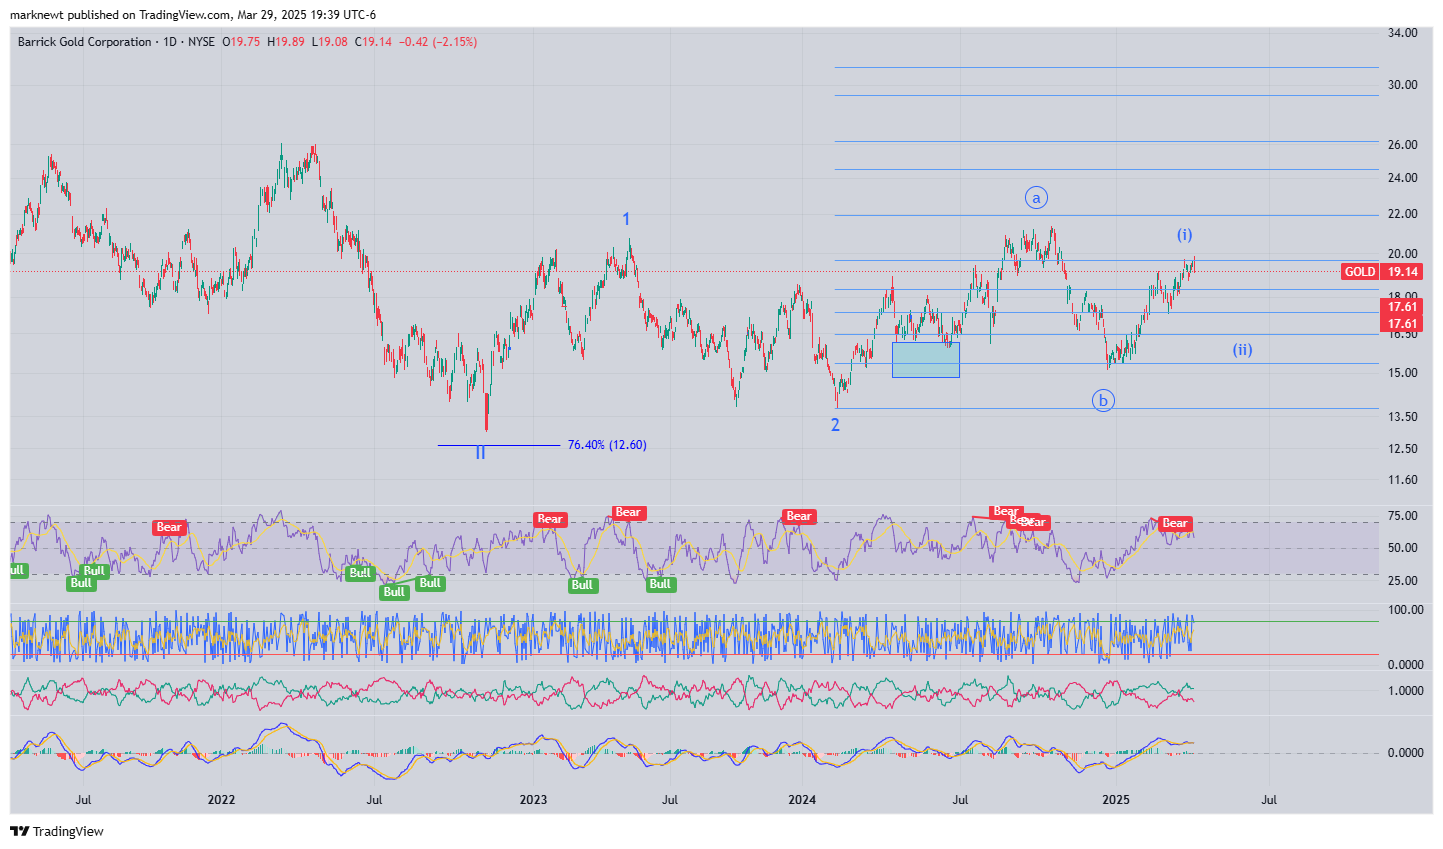
Chart 1: Barrick Gold - Mark Malinowski, Analyst
Zac Mannes, senior analyst, recently opined on the Barrick Gold (GOLD) chart:
"Elliott Wave provides an organized construct and method for providing context to other technical analysis patterns. Here on GOLD we have a series of higher lows. We can talk about this in terms of specific EW nomenclature but the major takeaway is that it is a nested bullish pattern as long as support in the $15 region holds."
What is a Wave Setup?
A Wave Setup is when analysts identify clearly defined risk:reward parameters on a chart that has the right proportions and structure aligned with Elliott Wave and Fibonacci Pinball principals.
These Wave Setups provide clear parameters that are updated regularly by analysts to provide targets, support and invalidation pricing levels based on Fibonacci pinball applied onto Elliott Wave patterns. Only the best of the best make it to Wave Setups.
There are other individual gold, silver and copper stocks and ETFs in the mining space that are regularly updated. Some also presented new Wave Setup conditions with good RR. Multiple daily updates and weekly videos analyze metals, any and all mining companies, soft commodities and agriculture related tickers. The Metals, Mining and Agriculture service offers one week trials for new members.
Disclosure:
I/We have a position in Barrick Gold(GOLD/ C.ABX) at the time of writing. I/We may add, trim, or stop out of positions as per the support and invalidation levels provided to members.
