Bitcoin: Shut Off The Narrative, You Might Miss The Top
 By
Ryan Wilday
By
Ryan Wilday
Bitcoin: Shut Off The Narrative, You Might Miss The Top
As published on Seeking Alpha
Catching Up
It has been more than four months since I have been able to write an article. What started as a fun and busy late summer traveling precipitated into a challenging late 2024 working through a health scare with one of my family members. In the meantime, Bitcoin (BTC-USD) jumped out of its summer doldrums, after a brief breach of my key $50,600, into an unstoppable march toward my long-term target zone.
I did have time to visit Rena Sherbill at the Seeking Alpha Podcast to discuss my concerns that Bitcoin breached $50,600. In that conversation, I was giving Bitcoin a chance since the breach was brief, lasting roughly 15 minutes.
Early in November, I was invited to sit down via Zoom with Julie Morgan of Seeking Alpha and fellow analyst Florian Grommes at Seeking Alpha's Election 2024 Investment Forum. By then it was clear that my caution was no longer warranted and that Bitcoin was on the path to a breakout in November.
Now that I have some time to write, I wanted to catch you up on how I see Bitcoin pulling into a price region I have been looking for since 2021.
Current Price Action
First of all, I want to explain how important the region between $125K and $195K is in Bitcoin's price history. Elliott Wave analysts look for price structures to culminate at the confluence of Fibonacci levels. Those levels are derived from targets of multiple degrees. Confluence across degrees gives us high probability zones for price to either top or bottom. In the current situation, I am watching for a major top, one that may usher in one of the most difficult periods in Bitcoin's history.
I see four degrees of confluence between $125K and $195K:
The 1.382 extension of Bitcoin's waves one and two is at $146K. That is based on Bitcoin's long-term, monthly chart, for which I am watching three alternatives. However, in all my alternatives, the zone just above $125K is a key target zone.
After Bitcoin completes a third and fourth wave, Bitcoin tends to top between the 1.236 to 1.386 extension of the third. Tracking the five-wave rally that started at the 2018 low, my target zone is $125K to $195K. That target is generated by the third wave that occurred from 2020 to 2021.
The 2.0 extension of the first and second wave formed off the 2023 low targets of $95K. The 2.0 extension is the base case for a typical fifth wave. This is slightly shy of our target zone; however, that target has been pierced without the 2023-24 rally showing completion. So, there is more to go.
In the attached monthly chart, I use the black arrows to point out the important structures that led to this target. The blue arrows point the way to the target. I can point out a couple more structures that point here, but these are the most important.
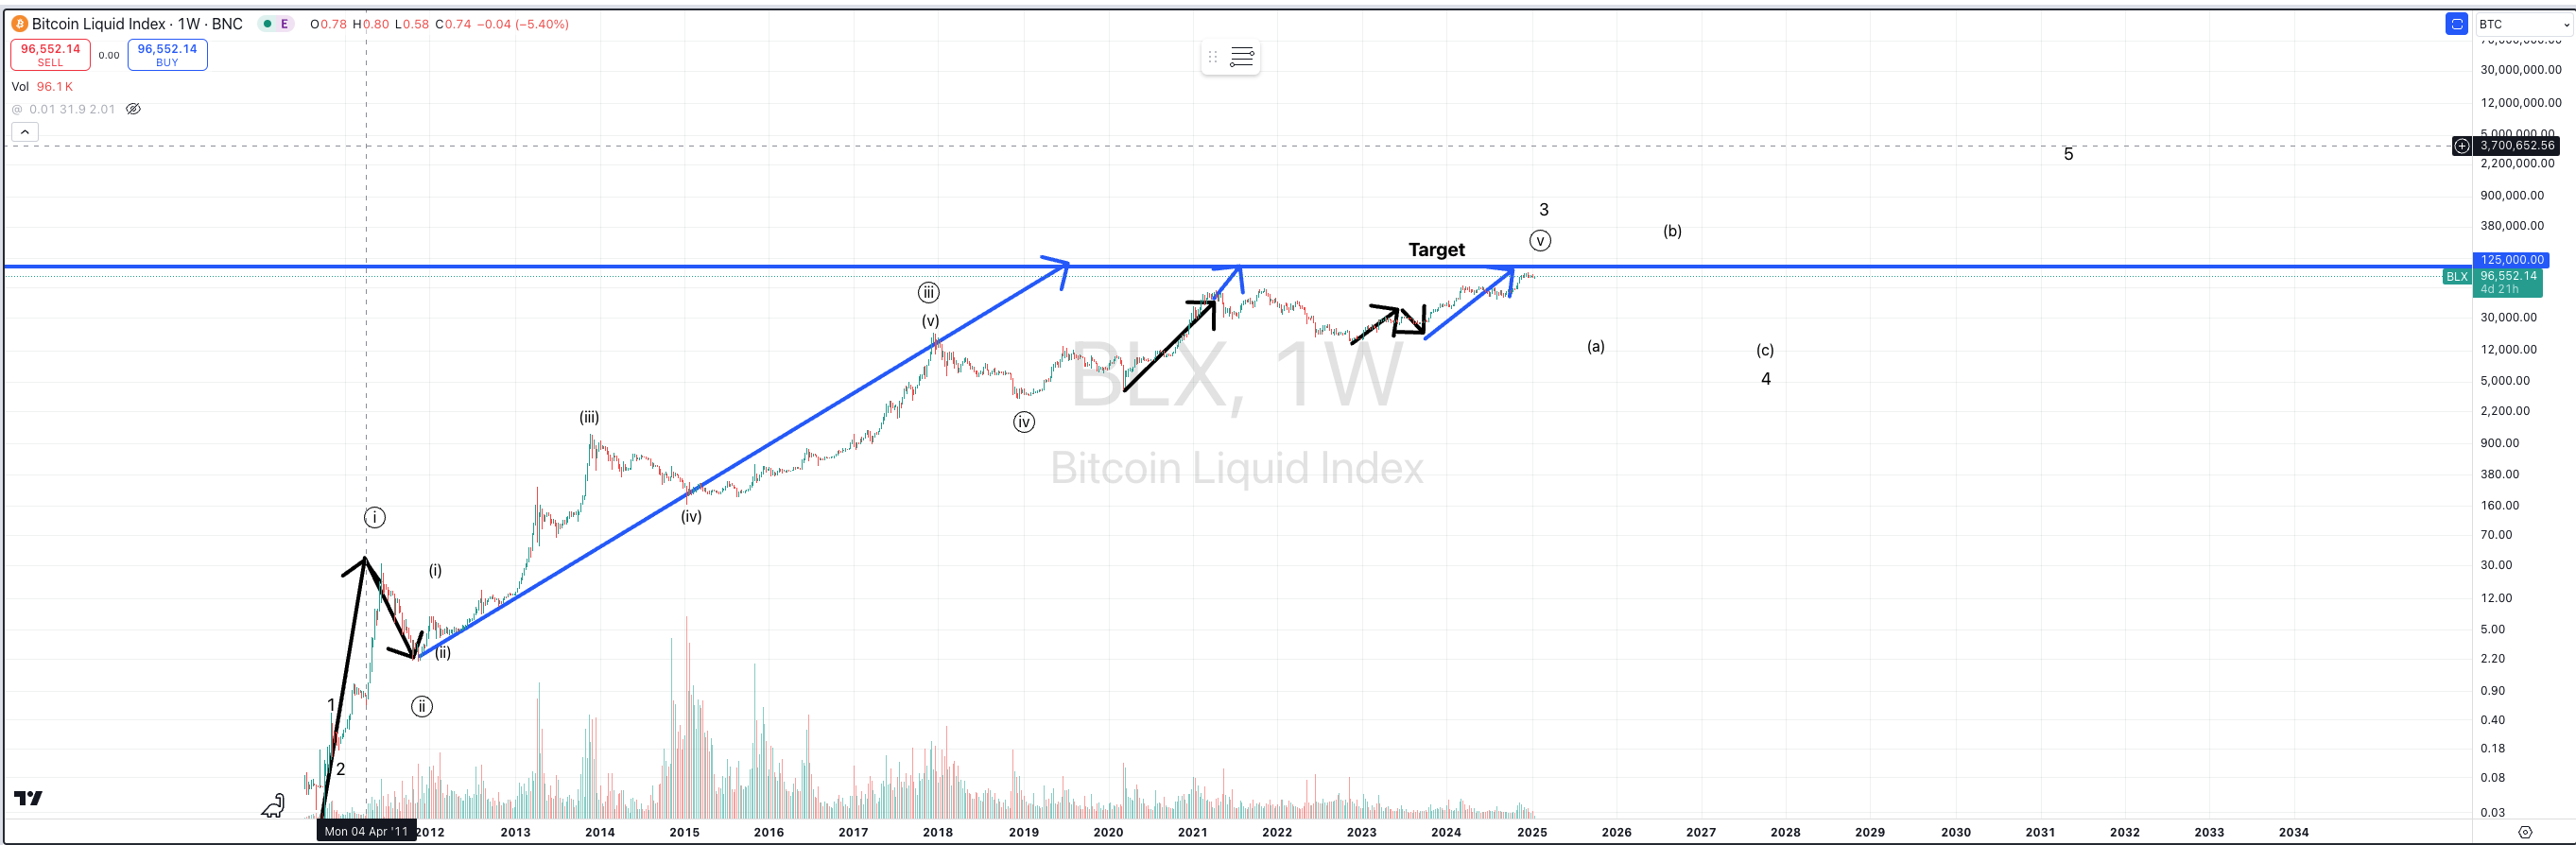
Finally, as of writing, we are watching a fourth wave forming into the $80K region. Provided that the fourth holds $69K, the length of the third wave suggests the fifth will place Bitcoin in the $125K region. Should this fourth hold, we will have another level of confluence.
Interestingly, the waves one and two set up for the move out of the $50Ks did not portend Bitcoin hitting $125K. However, the third wave extended to correct this potential miss. This is a common experience I have as an Elliottician - larger wave targets pull smaller degree waves like magnets.
Less Prediction Than a Basis for Sound Tactics
Before we dive into what a top means, do not believe I have pulled out my crystal ball and have called the top before it happens. I consider 'prediction' a very tainted word in markets.
Elliott Wave Theory has both quantitative and qualitative means of interpretation. The quantitative measures are hard rules, limiting potential expectations in markets most would consider random. The qualitative aspects are interpreted through experience. If you have followed my writings over the last six years, you know I have made some prescient calls at major turns - although the market sometimes stretched a bit past my targets or broke supports I deemed critical. The fact that I have given any key levels ahead of time should be surprising. An example was calling for a bottom in 2018 at $3K.
So that we don't live and die on attempts to predict the market, we have to watch how the market reacts at a key level before acting. In this situation, that would come in the form of a bearish impulse down through support. As mentioned above, the first relevant level of support is $69K.
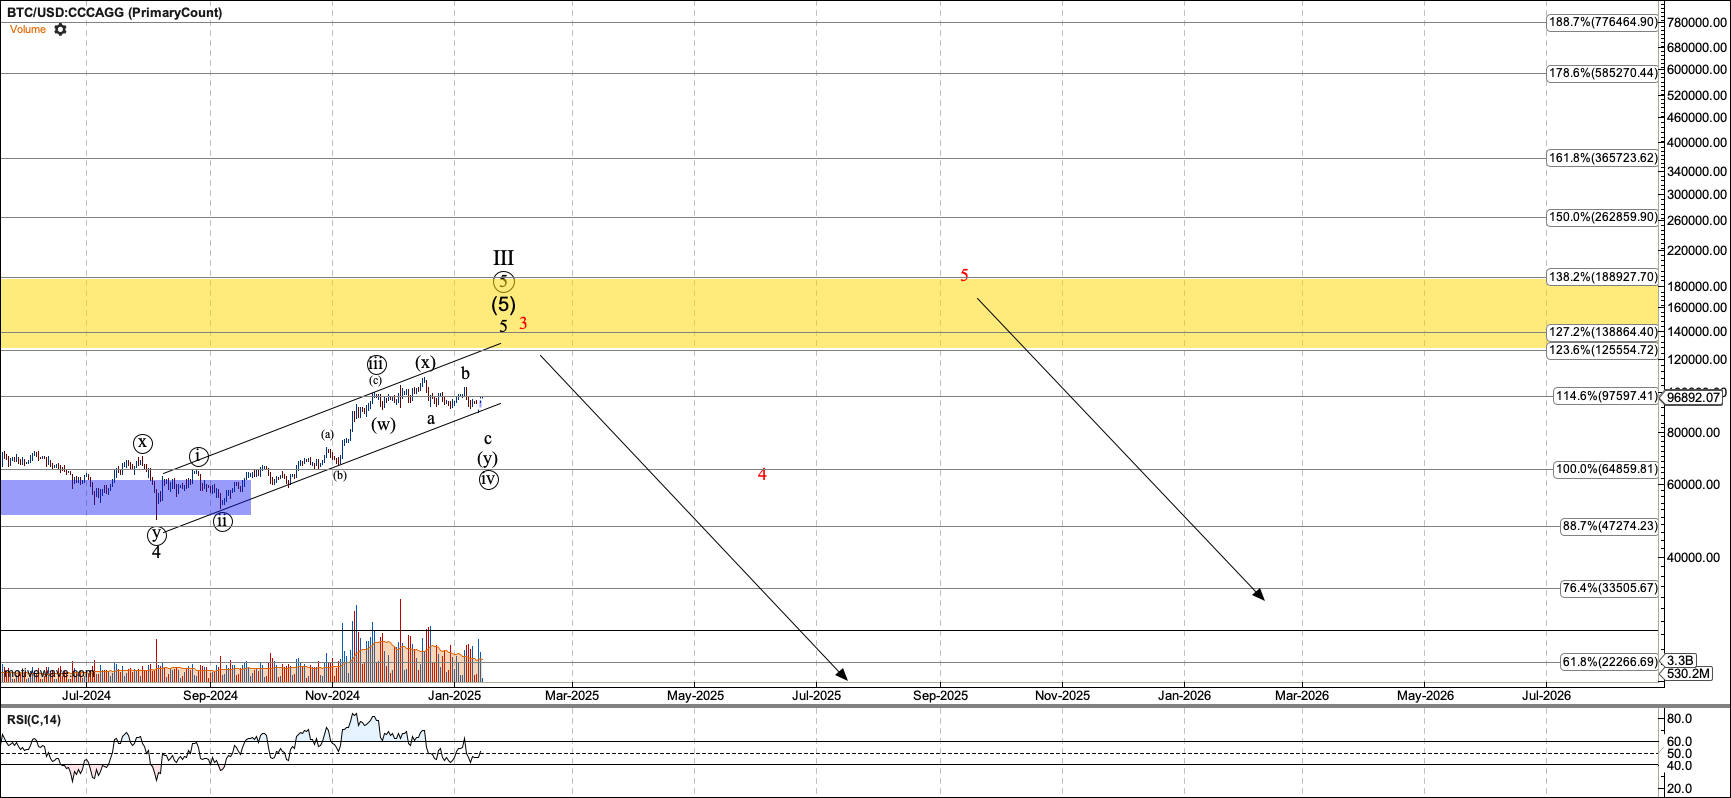
As the market climbs, it will be able to offer more critical support levels above $69K. I can also consider there is a means for this bull market to extend, so long as it stays above $52,500. I show that possibility in the red count below. Astute traders will immediately see the problem. It takes a big drop in price to confirm that the current bull cycle is over. This means that one would give up a great gain, taking a chance that the bull market continues.
This calls for sound tactics. I have been reducing my overall exposure to the crypto market as it has reached these heights, locking in much profit. And I am playing this last fifth wave with a smaller size than the previous waves. By the time we hit $125K, I will be down to my long-term Bitcoin holdings, which I try to keep at 10% of my net worth. That level is also 'free' by way of being built by profit-taking in each cycle.
As Bitcoin comes down and teases the potential of reversal over support levels, I can take some new longs. But once Bitcoin breaks $52,500, I will hunker down for the long winter.
What is Next?
As stated above, I believe the next phase after this bullish cycle will be the most difficult in Bitcoin's history. In Elliott Wave speak, it is likely to be Bitcoin's primary fourth wave.
Until now, Bitcoin has never had more than one bearish yearly candle in a row. And, after a bearish year, Bitcoin has always broken to new all-time highs within two years. I expect either or both of those conditions to end in this period.
Wave fours in most asset classes are extended sideways movements that range between support for the pertinent degree and all-time highs. More or less, I see Bitcoin presenting bear market drops similar to previous bearish years and the intense multi-x rallies Bitcoin is known for. However, in aggregate, Bitcoin should make little progress over 5 to 10 years. That timeframe is an educated guess. However, the size of this wave four can dip as low as $10K. And it may drop as low as $3K, though I see the probability of that as low.
While I expect Bitcoin to eventually emerge from this challenging period and start a multi-decade march toward $1M and $3M, patience will be tried and rewarded if my perspective proves true.
A Bullish Narrative
I am aware that I left material that will stir criticism from both Bitcoin's biggest detractors and its biggest fans. I am more than used to the arguments of Bitcoin's critics. My articles have repeatedly sparked criticism over the years, critiques that come straight out of standard scripts available across the internet. Most of the time they are not well-reasoned. However, I believe this article is likely more offensive to Bitcoin's most ardent bulls.
Particularly, Bitcoin owners in America hail the coming of Bitcoin's most supportive administration and the end of a congress and SEC that attacked Bitcoin. The SEC didn't regulate Bitcoin. Rather, the SEC, supported by some in Congress, threw lawsuits at the industry with abandon and, according to the claims of the industry, closed the door to civil discussion. I celebrate this change, but I do not expect it to unduly extend this bull market. To those who are more bullish than they were one or two years ago, please consider a few points:
Markets often top on the best of news, and bottom on the worst:
Bitcoin topped in 2018 as the first regulated industry product entered the market: Bitcoin futures.
Bitcoin topped in 2021 as the first ETF, albeit holding futures, launched in the US.
When El Salvador became the first country to adopt Bitcoin as legal tender and put it in their reserves, Bitcoin dropped another 30% before it found a bull market low.
Bitcoin even went down briefly after the spot ETFs launched in January last year. It was just temporary, but many thought that drop was surprising.
Bitcoin bottomed in 2018 when it dropped below mining costs, sending droves of miners into bankruptcy, and supposedly threatening the network.
Bitcoin found a bottom in 2022 after the FTX exchange failed. Shortly thereafter, Silicon Valley Bank, a crypto-exposed bank, failed. That was expected to drive the masses away from crypto for years, yet a two-year, 500% rally began.
The truth is that markets top when everyone who will buy has bought. The market then has to come down to find buyers, even before real selling has started. The same happens at the bottoms. Sellers exhaust themselves selling, often because something in the headlines provokes fear. Then the market rises as there is no one left to sell.
I can expound much more on the mechanics of bullish and bearish cycles. I can also wax lyrical about how Bitcoin is a global asset. Despite the US being one of the world's economic superpowers, the Bitcoin market is steered by the masses that trade it 24/7 in all corners of the world. No market - whether stocks, bonds, or metals - is as decentralized as the crypto market. Understanding when Bitcoin will top or bottom, requires a global view of mass sentiment.
I did not intend this article to become a detailed view of how events echo market action rather than drive them. I simply want to urge you to deeply consider any mindset that prevents you from taking any profit out of Bitcoin as it comes into the key levels I expressed.
I can be wrong in my expectations. However, an inflexible mindset can prevent good trading and investment decisions. Openly look at price action at these levels and let the market be the guide, not the headlines.
Conclusion
As I shared, the Bitcoin market is entering a price zone I have been looking for many years. If there is one way I have been wrong, it is that I didn't believe it would take this long.
While I am not a fortune-teller who knows ahead of time that Bitcoin will top between $125K to $195K, my work finds this area worth attention. And tactically speaking, it is compelling enough for me to take some risk off. I have taken my Bitcoin holdings down to a level I can be comfortable with, whether the market is turbulent or continues to march higher.
If the market does respond to these levels, turn, and break the supports that I have laid out above, I will know that this warning is prescient. There will be more opportunities down the road, but not until Bitcoin has tried its holders, perhaps for many years.
