CF Industries: Setup Playing Out As Drawn Up - Here’s What’s Next
 By
Levi
By
Levi
By Levi at Elliott Wave Trader; Produced with Avi Gilburt
We use the word ‘setups’. It’s what we follow inside of our trading methodology to provide guidance and potential risk versus reward on each chart that we study. Perhaps another word for ‘setup’ would be ‘opportunity’. We scan across the marketplace for high-probability opportunities. We then share these with members in the Wave Setups feature of StockWaves. First, just a bit of background to set the stage for a deeper look at the current opportunity in (CF).
Frequently, we will share these setups, either new or ongoing, with the readership here. Recent examples of such shared in articles can be found here for (TSLA) and here for (AMD). Now though, let’s provide an update to (CF) from a prior piece published back in February of this year. We’ll take a look back at the initiation of this setup and then rejoin the current structure of price in motion.
A quick reminder - please keep in mind that it’s successful setups and discipline over the long term that will help investors/traders make continuous progress. Many have come to realize the utility of Elliott Wave Theory, correctly applied.
As Paul Tudor Jones once noted:
"I attribute a lot of my success to Elliot Wave Theory. It allows one to create incredibly favorable risk reward opportunities”.
Avi Gilburt has frequently commented as well regarding our use of this theory:
“As an investor, your job is to objectively understand the market in order to maintain on the correct side of the market action. Unfortunately, most investors follow specious market theories because it makes them feel as though they have a certain amount of control over the market if they can come up with a reason for the market move, no matter how contorted that reasoning may be. Yet, you must come to the conclusion that such control is an illusion, in the same way that much of the analysis leading to such false sense of control is intellectually dishonest.
As for me, I simply apply a mathematically-based approach to the market price action, which tells me rather objectively if my analysis is right or wrong and allows me to adjust rather quickly when I am wrong so that I am not adopting and trading false beliefs of the market.” - Avi Gilburt
How does this help us? Well, let’s apply the mathematics to the CF chart and let the structure of price speak.
Sentiment Speaks Via The CF Chart
The initial setup was about 4 weeks ago:
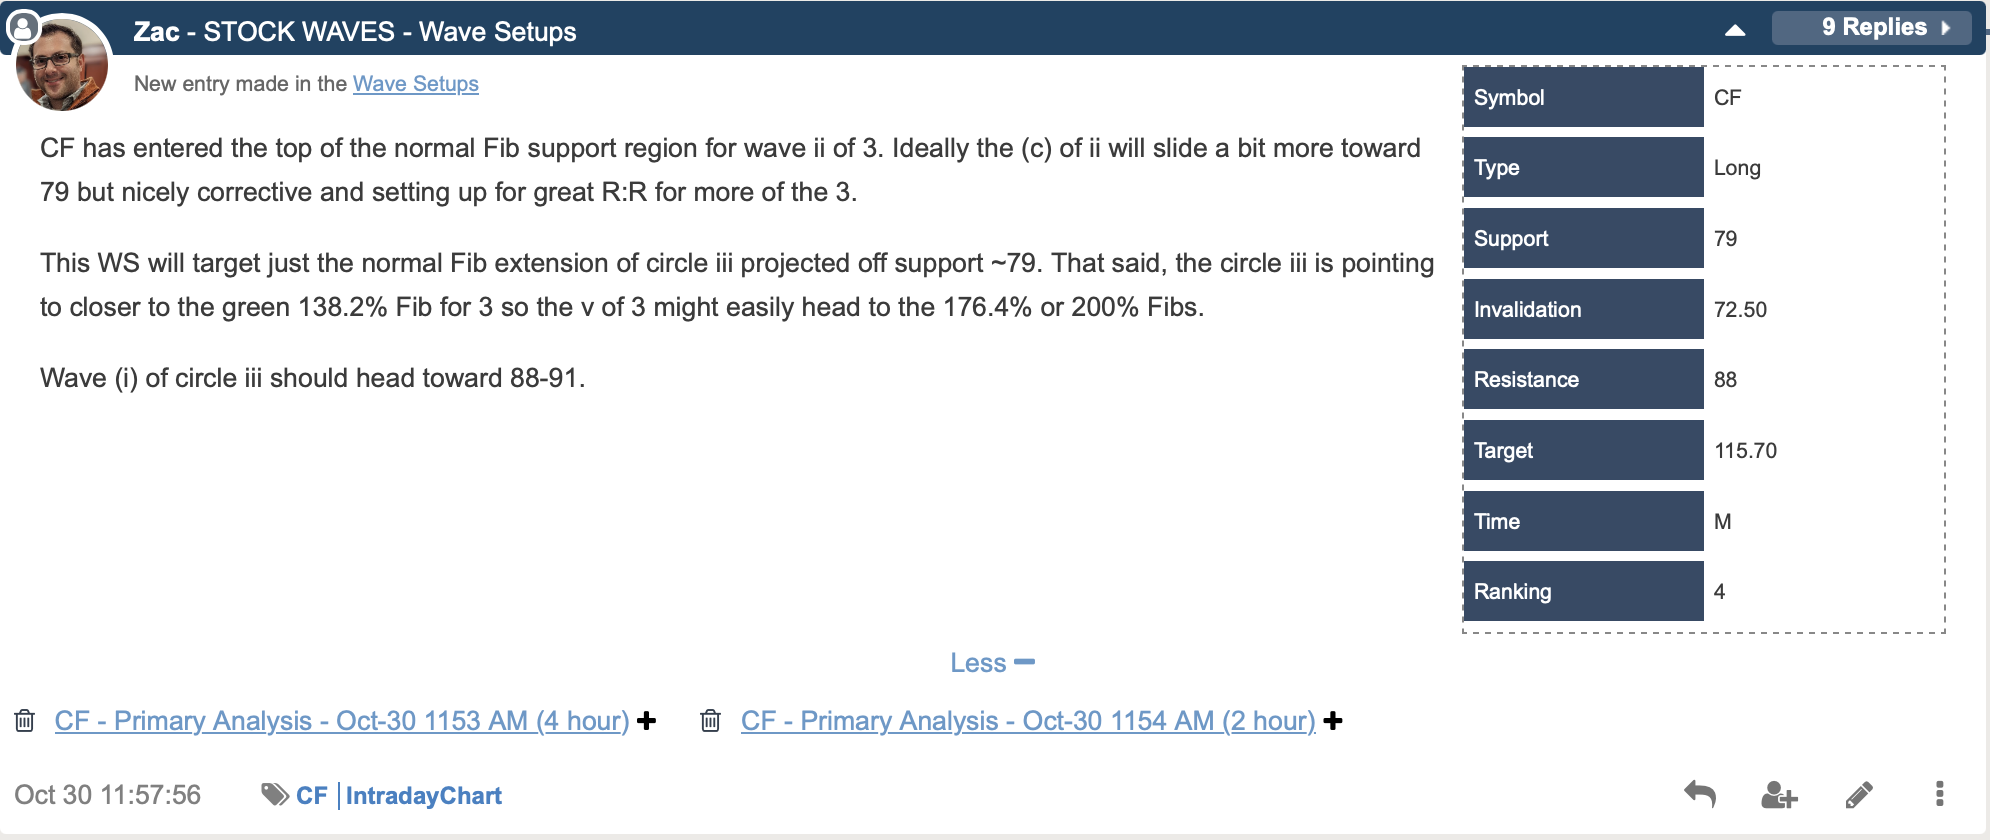
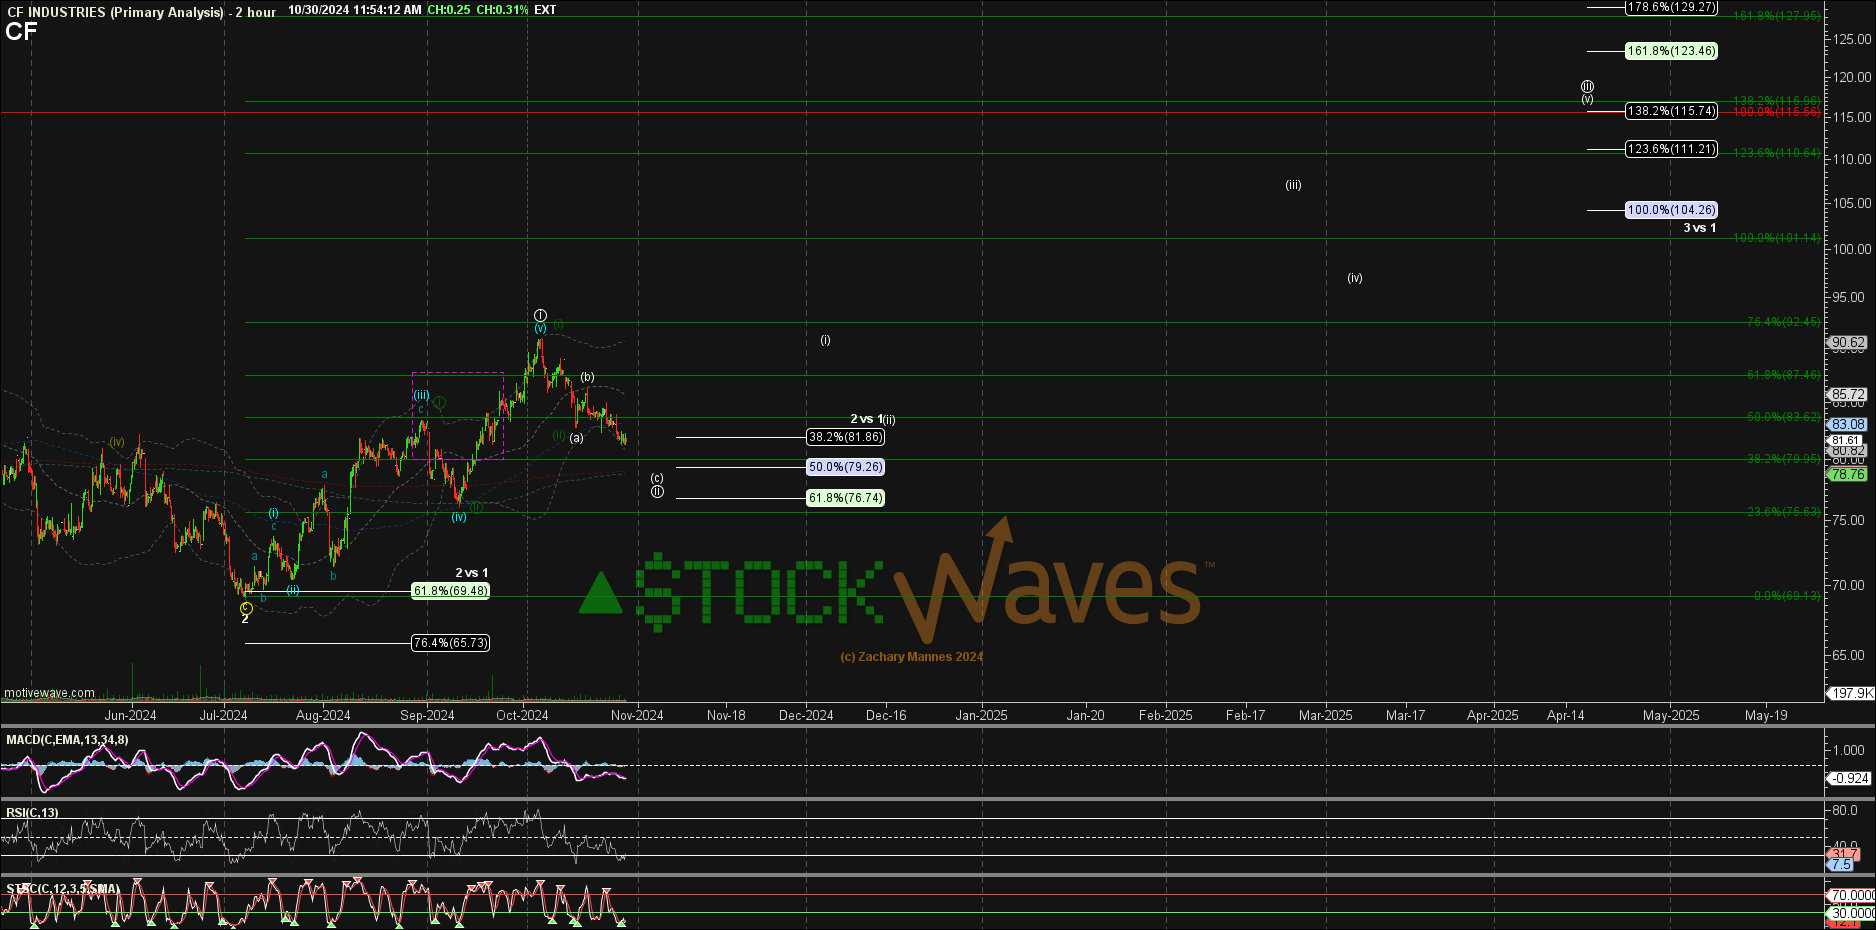
Observe the easy-to-follow table that clearly states the guidance for the setup. Also, let’s take a look at the chart that was attached to that post from 4 weeks ago:
Note that price did indeed fill out the corrective pattern as suggested, and that it has now advanced to the next waypoint. This is when we will update our members with new price levels to further provide guidance.
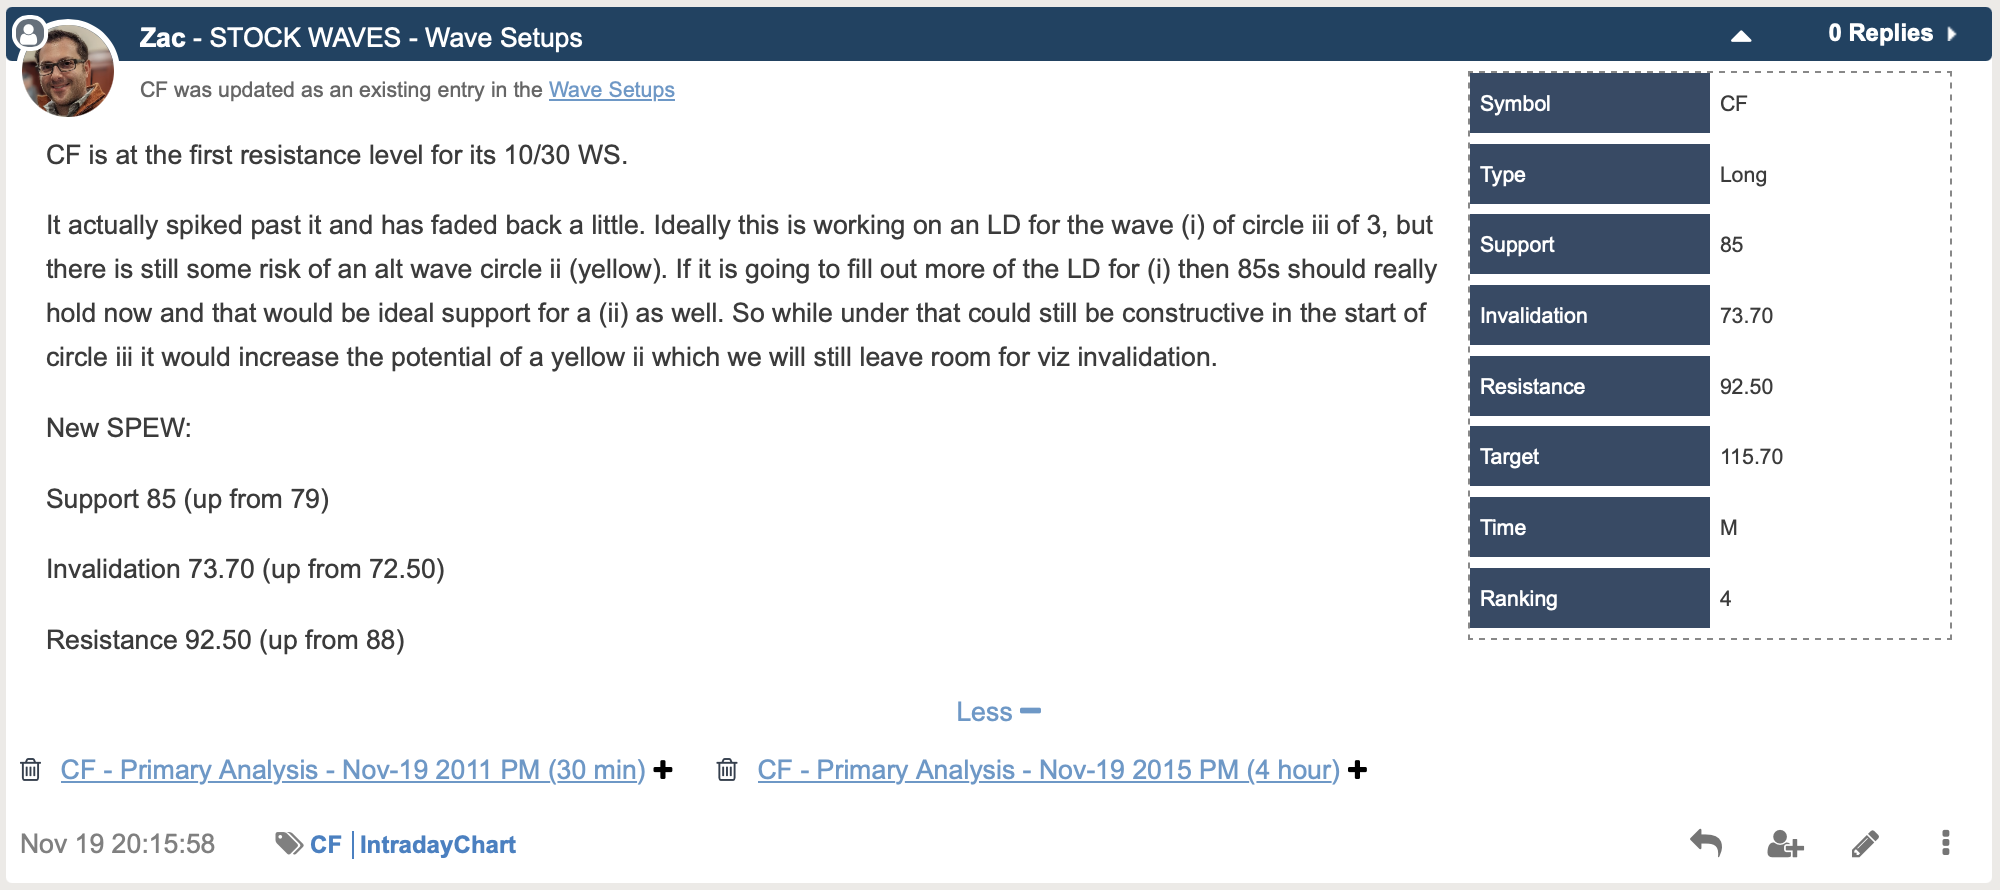
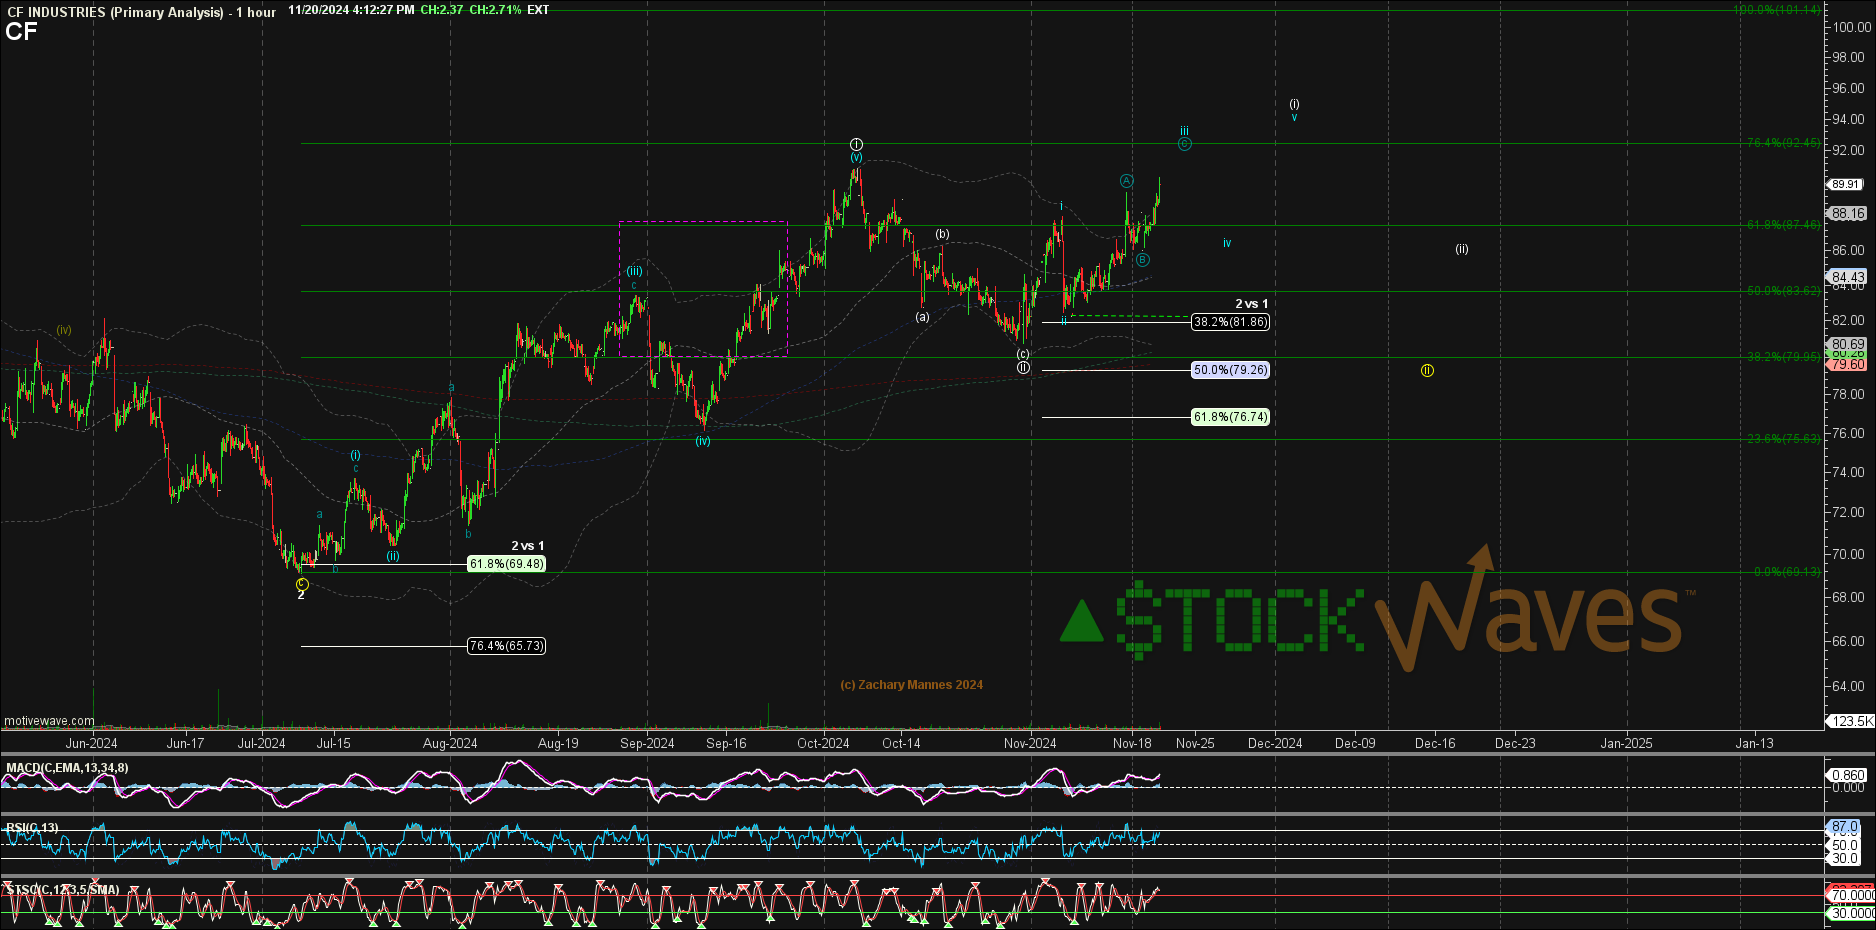
In this near term chart from late last week you will see that price is likely in wave ‘iv’ of the larger wave [i]. Here’s the bigger picture view with the longer term context.
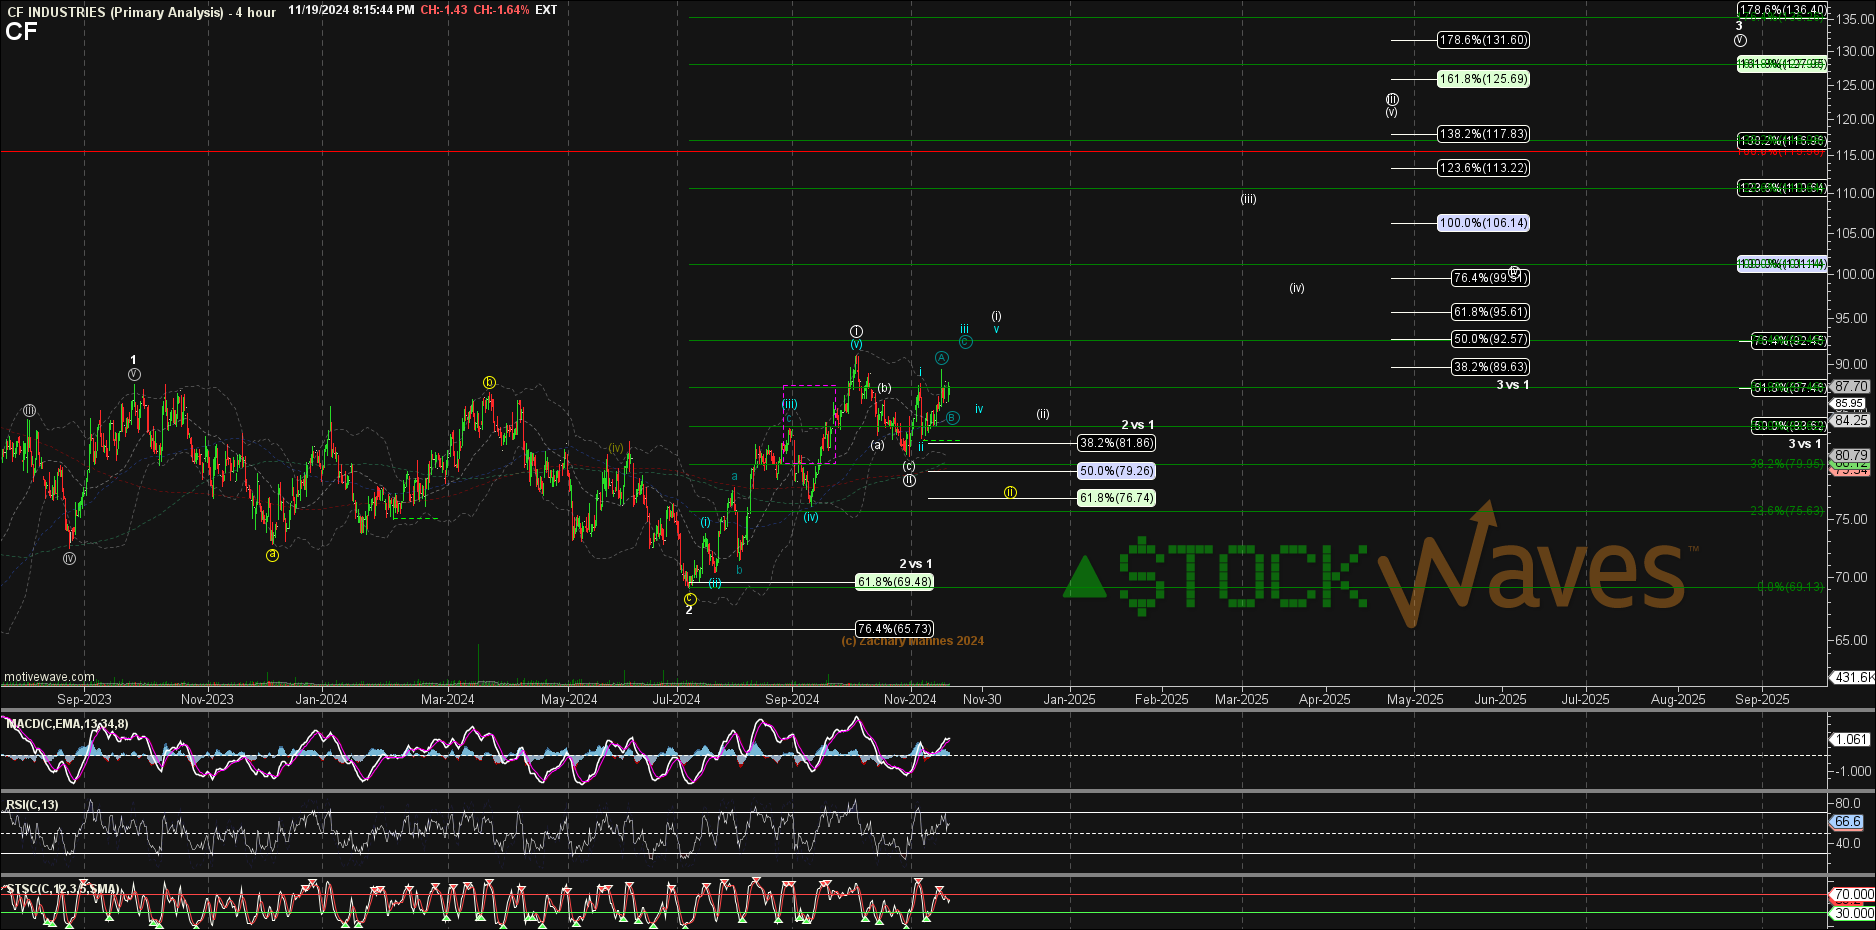
Keep in mind that these projections are not prophetic. Rather, they will provide guidance along the path. Trading inside of these types of structures will be highly individualistic. Time frame, risk profile, goals, etc will dictate how the person manages each setup.
One caution to keep in mind is that in the near term, should price move under the $85 area, then it could be a wider correction that takes the chart to $81 - $82 area first before a larger advance takes hold again. Holding $85 - $87 suggests that price is likely to rally higher in wave ‘v’ of wave [i].
Conclusion
Markets are emotional. They are irrational. In their wake, they can leave the seemingly most intelligent and logical among us battered, bloodied, and abandoned. Striving to constrain the markets in a linear box of reason and clean geometry will exhaust the brilliant and mercilessly bash the bravest.
This, of course, does not leave us in the lurch. A system is needed to bring structure to the madness. We have such a system in place, it's the very basis of our methodology.
In addition to the articles provided to the readership here, we have an extensive Education library available at Elliott Wave Trader. As well, we want to teach others this methodology. Three times a week, we have beginner and intermediate-level videos where we show the exact way we count the waves and give in-depth analysis techniques. This methodology, if you give it the chance, will change the way you invest forever. More on that can be found here.
I would like to take this opportunity to remind you that we provide our perspective by ranking probabilistic market movements based upon the structure of the market price action. And if we maintain a certain primary perspective as to how the market will move next, and the market breaks that pattern, it clearly tells us that we were wrong in our initial assessment. But here's the most important part of the analysis: We also provide you with an alternative perspective at the same time we provide you with our primary expectation, and let you know when to adopt that alternative perspective before it happens.
There are many ways to analyze and track stocks and the market they form. Some are more consistent than others. For us, this method has proved the most reliable and keeps us on the right side of the trade much more often than not. Nothing is perfect in this world, but for those looking to open their eyes to a new universe of trading and investing, why not consider studying this further? It may just be one of the most illuminating projects you undertake.
