Capital One: A Deep Dive To Discover What’s Really In Your Portfolio
 By
Levi
By
Levi
By Levi at Elliott Wave Trader; Produced with Avi Gilburt
If you have not already done so, a deep dive into all available financials for Capital One will help you discover what’s really in your portfolio. Should you choose to hold this one then knowing what risks are currently presenting themselves as well as what investor sentiment is telling us will facilitate you to be forearmed for the future.
Avi Gilburt and the team at Safer Banking Research have done such a deep dive and recently shared their most updated findings. Please feel free to see that public article here.
What about the merger with Discover (DFS)? Could two wrongs make a right? Note the conclusion presented in this article from earlier this year.
So we have a premise to shape an opinion. That could even form a bias. Have you ever been so fully convinced of a narrative that no matter what the stock price did, you remained steadfast in your position? What if there was a way to either confirm or deny your bias, as it were? Let’s briefly discuss this and then look at the specific setup that is coming together in (COF).
How To Avoid Confirmation Bias
First, what are we talking about with the term ‘confirmation bias’? From an article on WedMD, “Confirmation bias is a psychological term for the human tendency to only seek out information that supports one position or idea. This causes you to have a bias towards your original position because if you only seek out information that supports one idea, you will only find information that supports that idea. This is in opposition to doing more comprehensive research that would expose you to opposing ideas.”
Now, I think that you will find this next portion particularly useful. Our methodology actually incorporates the study and measuring of human psychology via Fibonacci mathematics. For those that ascribe any studies produced with such a tool to be voodoo or heresy, some further investigation is warranted before the jump to such a conclusion. We would encourage you to at least understand our modus operandi before opining.
There is nothing secret nor hidden about this method. In fact, from the very beginning of providing the analysis to the public, Avi Gilburt has shared how it works and even the ‘why’ behind it. Please take a few moments of your time to review the introductory presentation from some years back regarding how to correctly use Elliott Wave Theory. As well, this information delves into how confirmation bias can be avoided. Part one of the six part series can be seen here.
Here’s a portion of the preamble from Avi:
“In 2011, I began writing for Seeking Alpha, and quickly encountered a major challenge. I realized that writing about technical analysis on a fundamental analysis website was not going to be easy.
While those that initially read my articles were quite skeptical (and that is probably being kind), as Seeking Alpha readers began to see the accuracy in my analysis, I started to gain a following. It was not long until I was the number one followed metals analyst on Seeking Alpha, and have basically remained in that position for the great majority of the seven years I have been writing on Seeking Alpha.
Lately, one of the commenters to an article I wrote suggested that we peel back the curtain regarding my analysis methodology:
“You have a large following on SA and in my view are the definitive TA expert on SA, so please consider the following: Offering a weekly SA post on TA Basics (101 if you will) in an effort to introduce more to at least gaining an understanding of TA and how they might benefit from it.”
So, after getting buy-in from the editors at Seeking Alpha, I have begun this new series of articles which will give you a bit more insight into the technical analysis methodologies I use.” - Avi Gilburt
How To Use This Methodology
As shared above, we have a fundamental premise regarding (COF). But what does investor sentiment as expressed in the structure of price tell us at the moment? Let’s take a look with the help of Zac Mannes and Garrett Patten, our lead analysts in StockWaves.
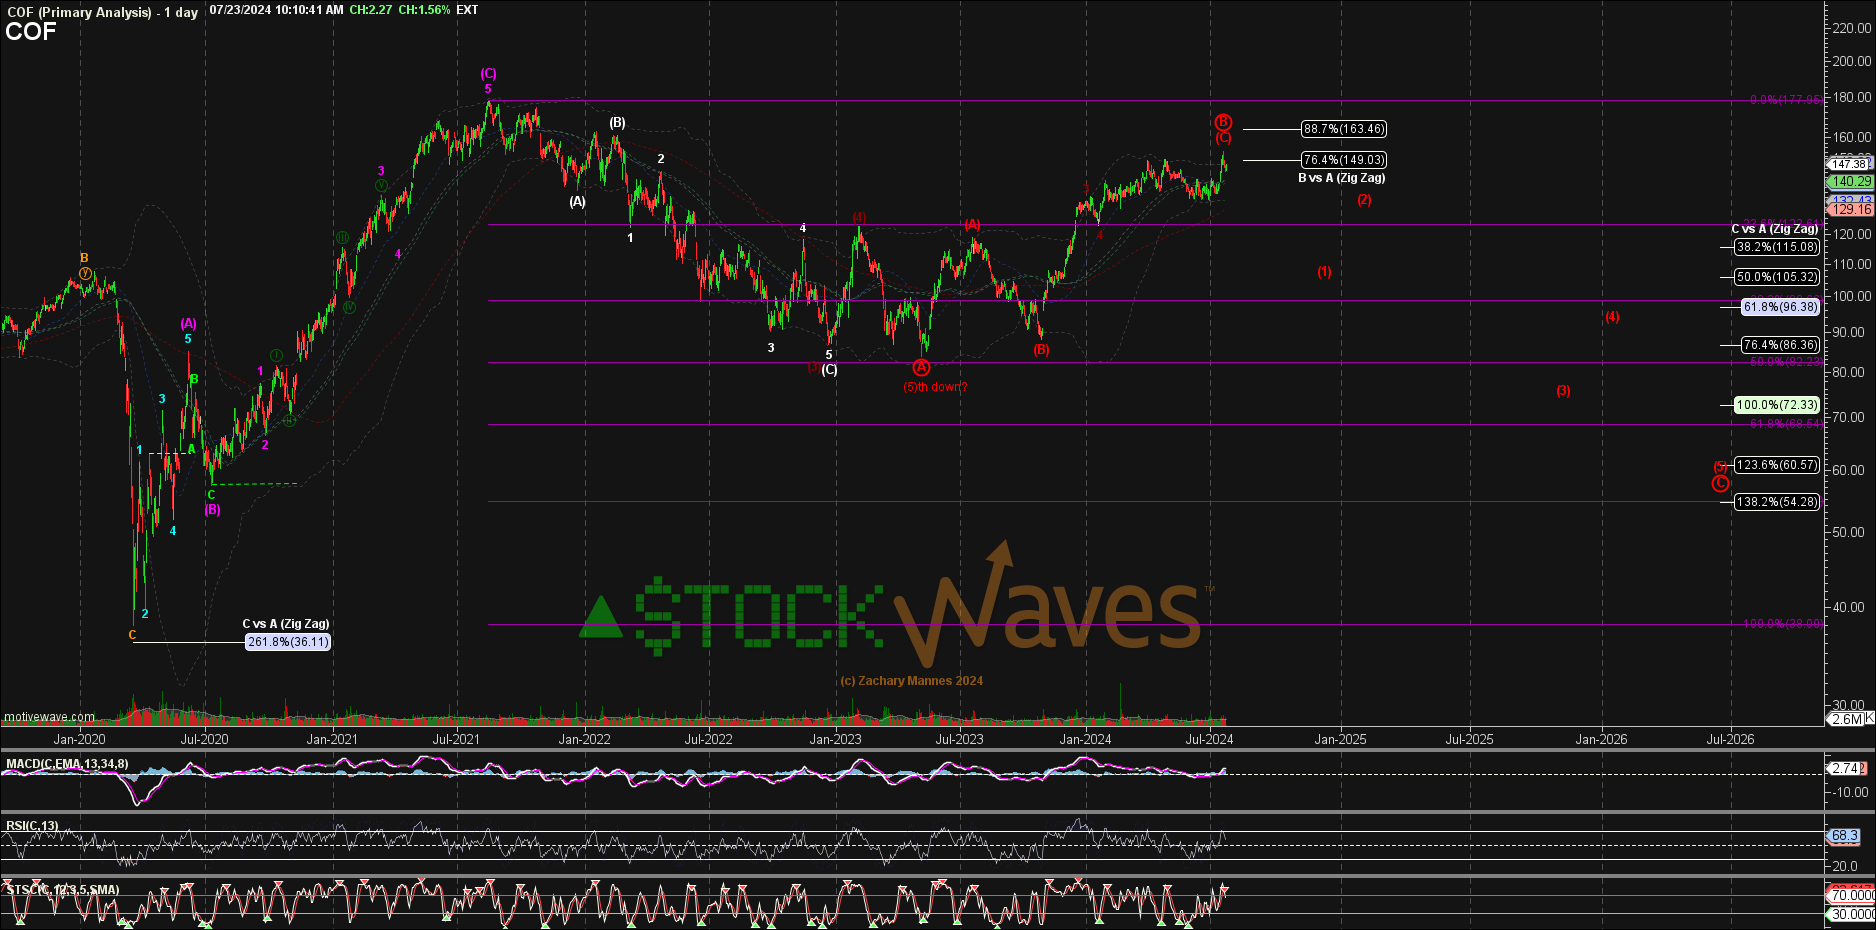
This is the zoomed out view with the longer term projection suggesting lower prices ahead. Given the fractal nature of markets, we can them zoom in for more granularity. Here is Garrett’s recent chart for (COF).
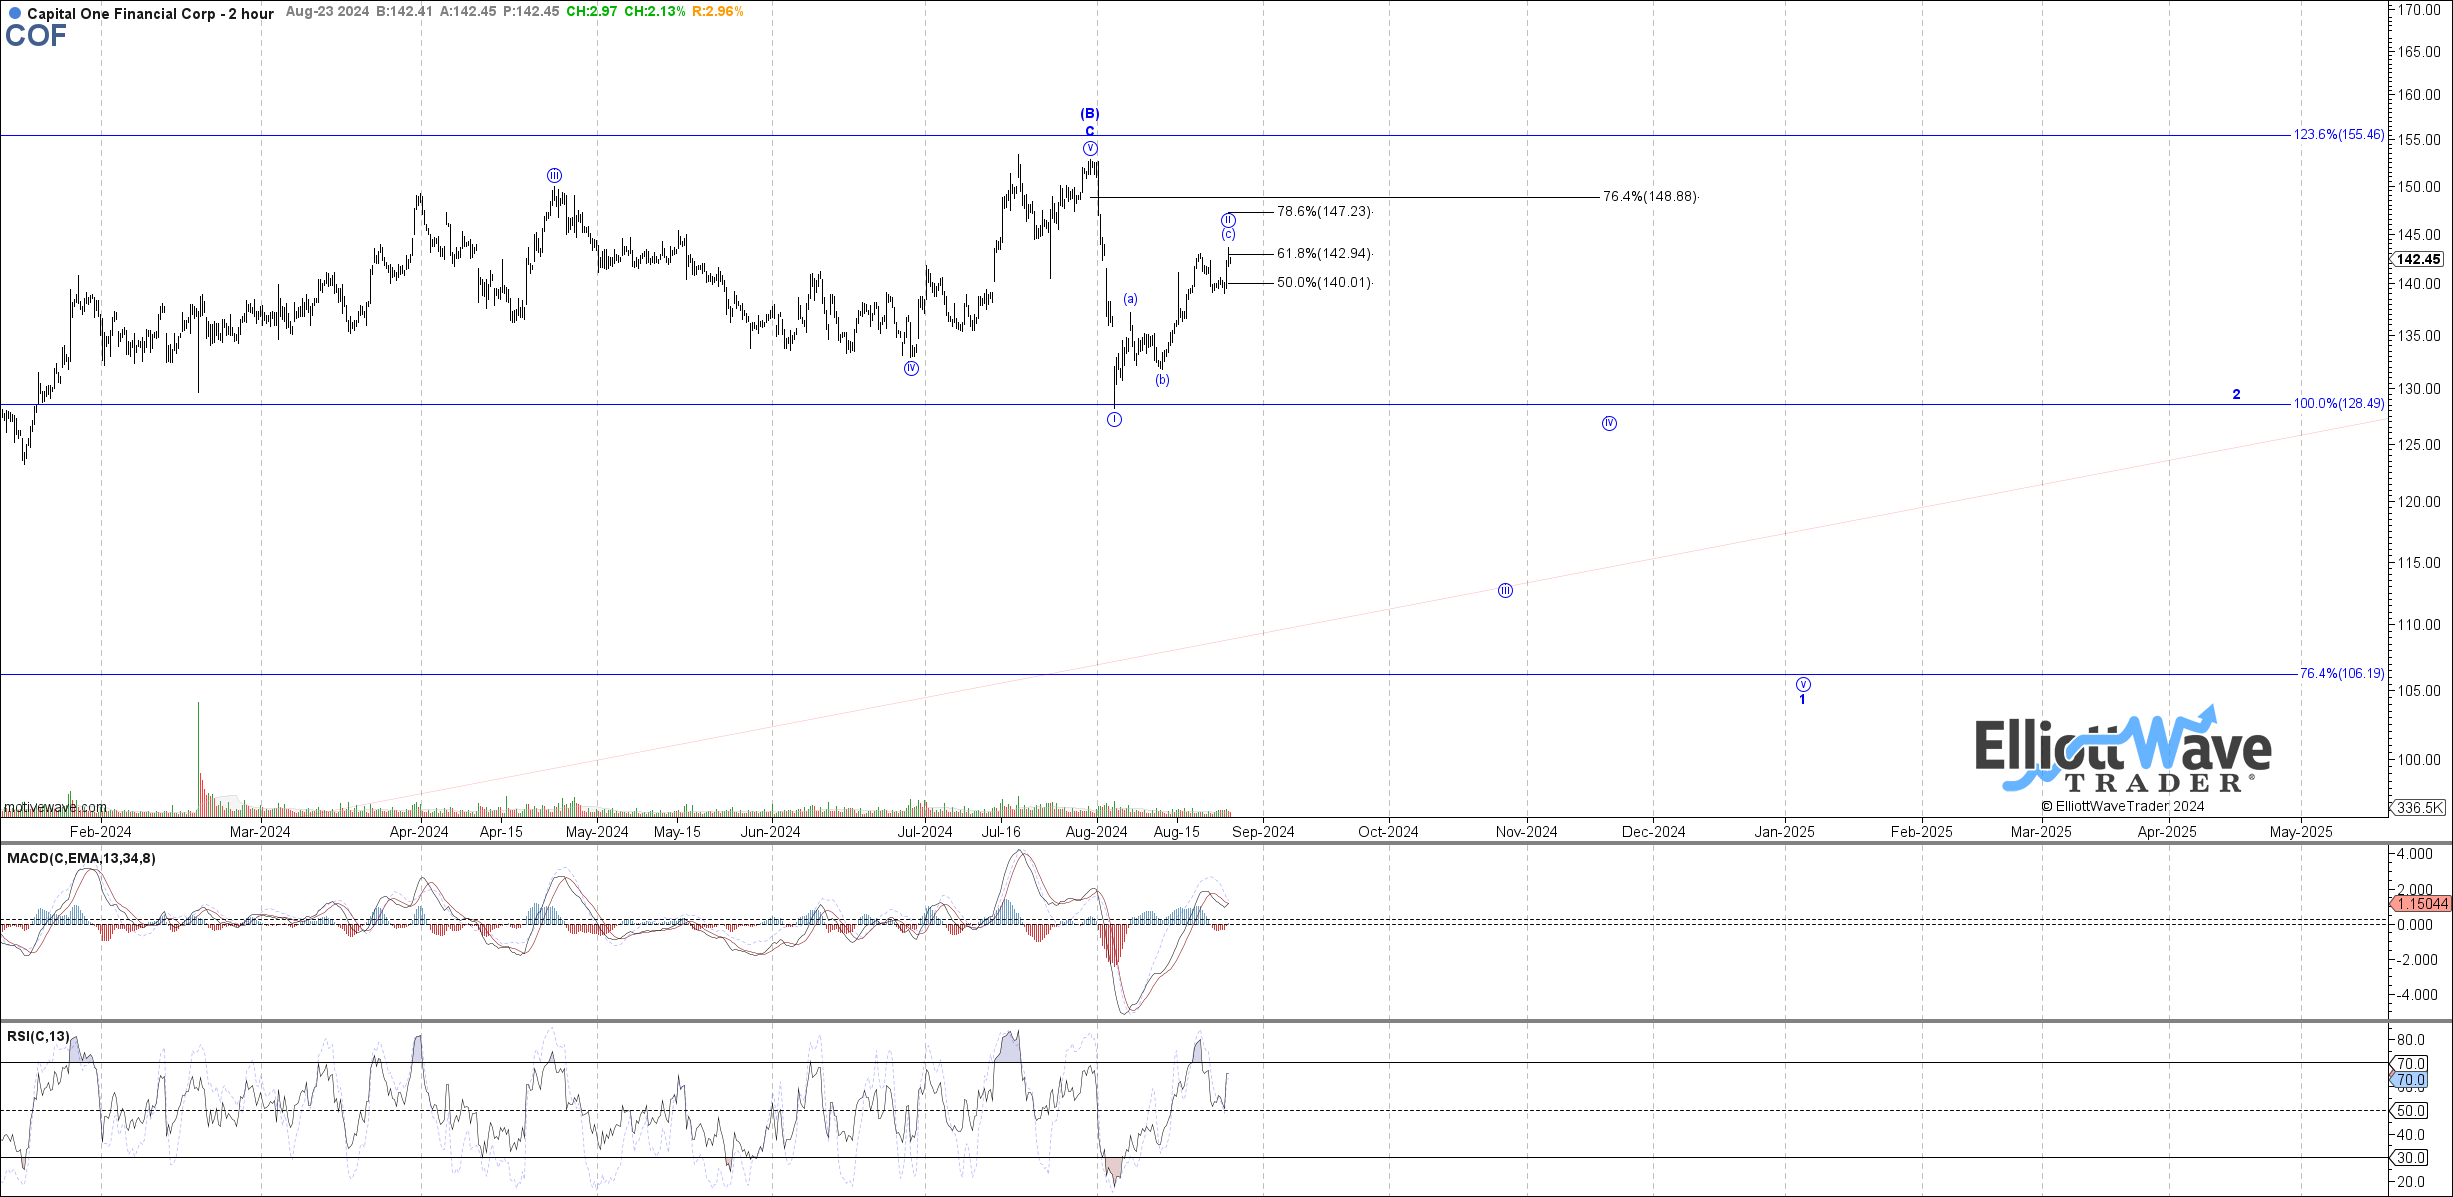
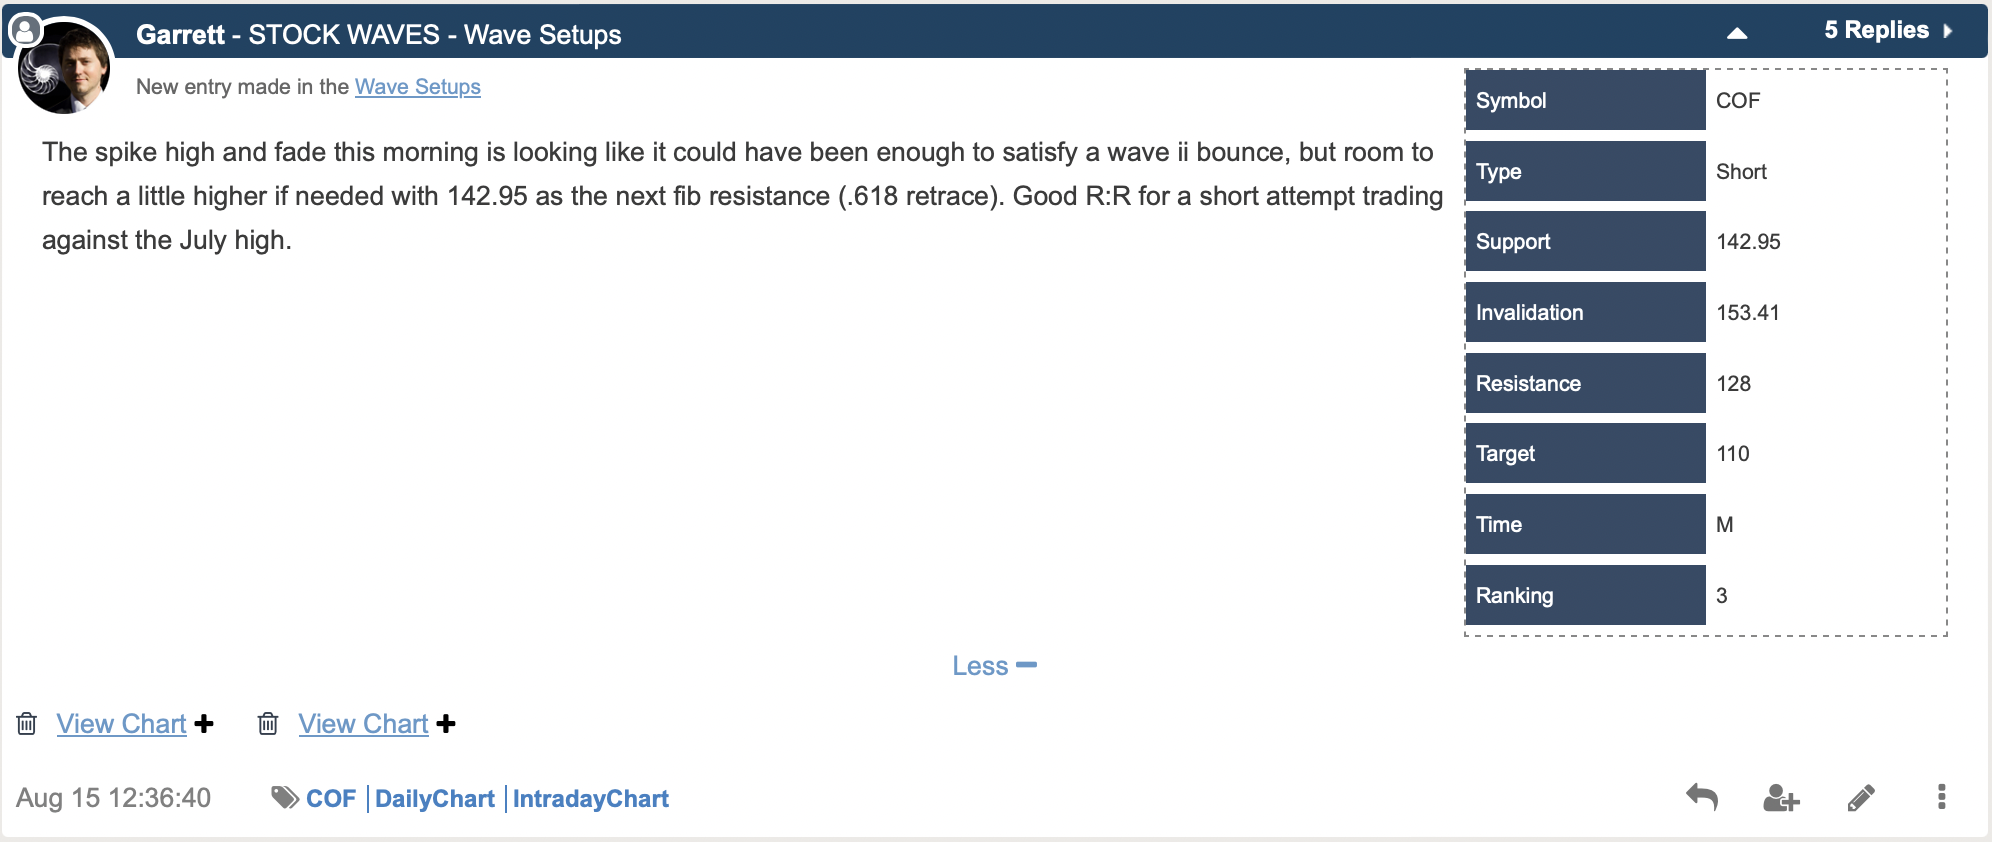
This is a classic bearish scenario. It has defined risk at the high labeled as ‘B’. For as long as below that high, pressure to price would remain down. (COF) is also in our current Wave Setups page as a bearish play with support, resistance and invalidation levels clearly shown in the table below.
Do You Have A System In Place?
Those who have experience forged by time in the markets will tell you that it's imperative to have a system of sorts in place. You need to be able to define how much you are willing to risk vs. how much gain is likely. Those who survive across the decades in the greatest game on earth will also inform you that the preservation of capital is paramount.
While there are multiple manners of doing this, we have found Fibonacci Pinball to be a tool of immense utility for traders and investors alike.
Conclusion
There are many ways to analyze and track stocks and the market they form. Some are more consistent than others. For us, this method has proved the most reliable and keeps us on the right side of the trade much more often than not. Nothing is perfect in this world, but for those looking to open their eyes to a new universe of trading and investing, why not consider studying this further? It may just be one of the most illuminating projects you undertake.
