Catching Bullish Fibonacci Setups In NQ and Crude
 By
By
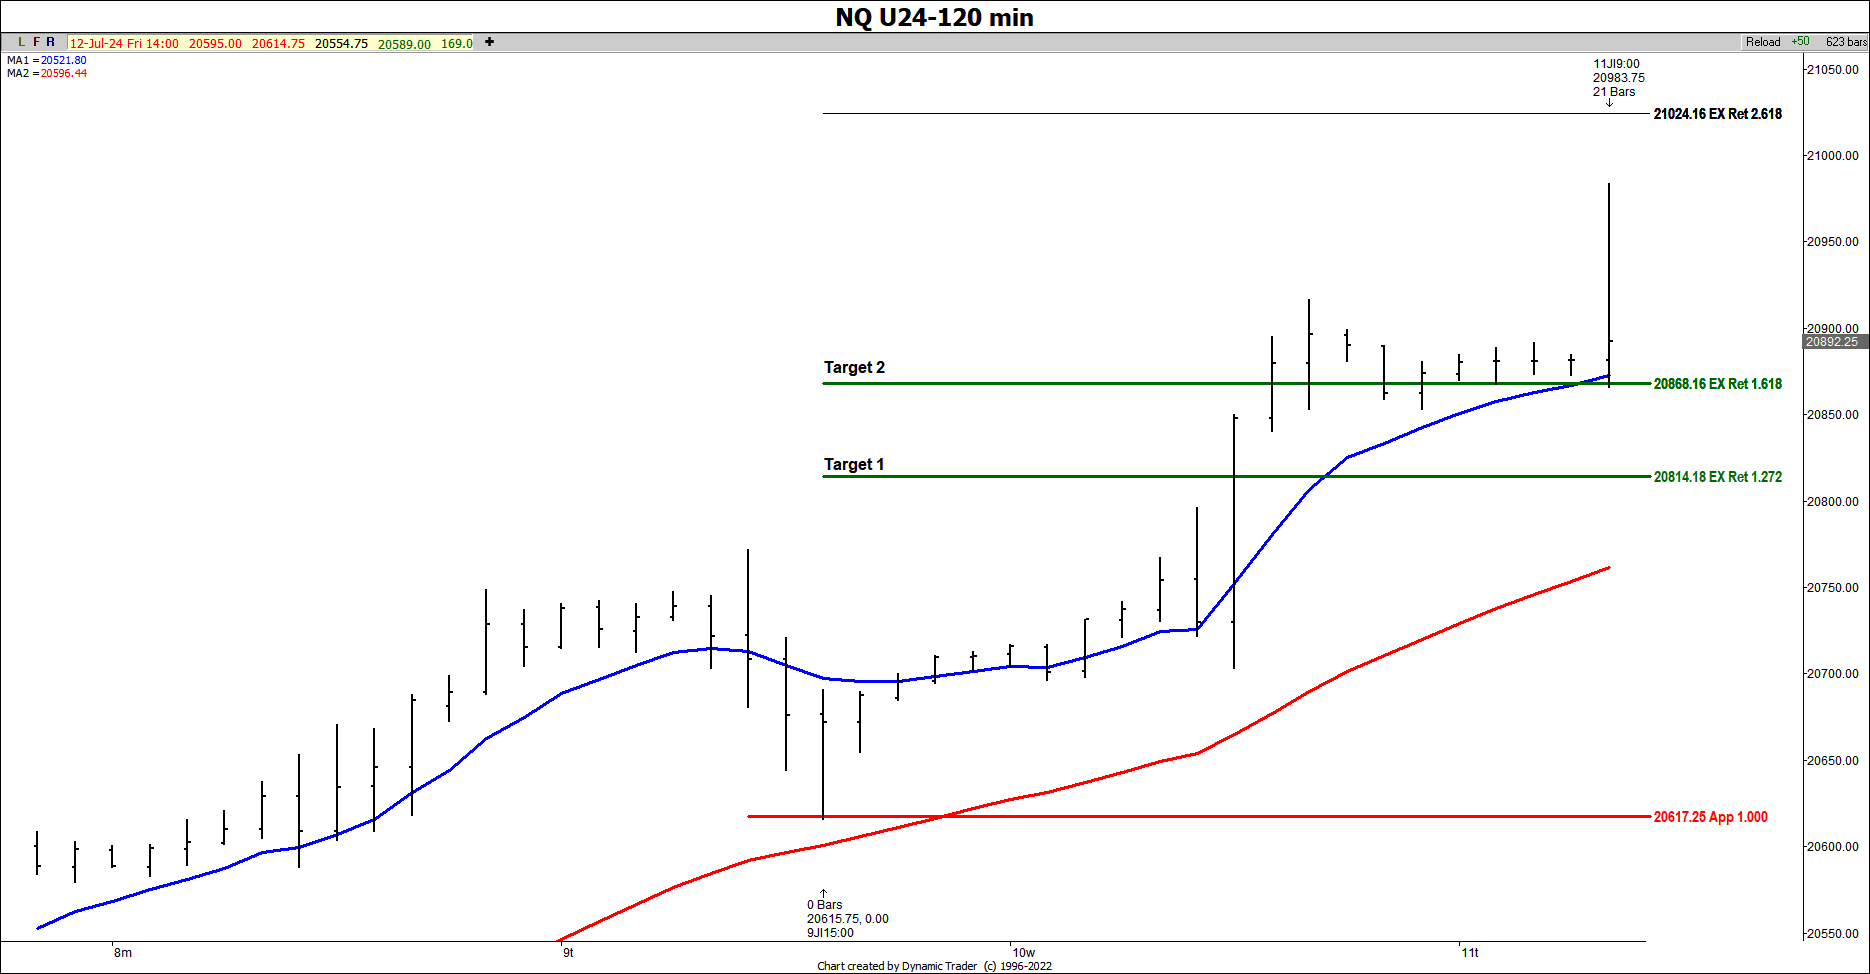
On July 9th, I had a bullish setup in NQ on the 120-minute chart. This is a live chart I show in our Zoom room. We hit and held symmetrical support (the red line), went up 368 points before having a significant pullback. In addition, we met both targets on the upside.