Cleveland-Cliffs: Cyclical And Pointing Down - Where Would It Be Bullish?
 By
Levi
By
Levi
By Levi at Elliott Wave Trader; Produced with Avi Gilburt
Cyclical stocks can be incredibly rewarding and equally, if not even more, frustrating. One question we often receive regarding updates such as this article is, “Why are you just turning bearish now?” Well, this is a setup that we have been tracking and projecting for some time now. Our members were on the watch for a ‘B’ wave top from about 5 months ago. This update to the readership is to show where the current downward move may terminate and when the chart could turn bullish again.
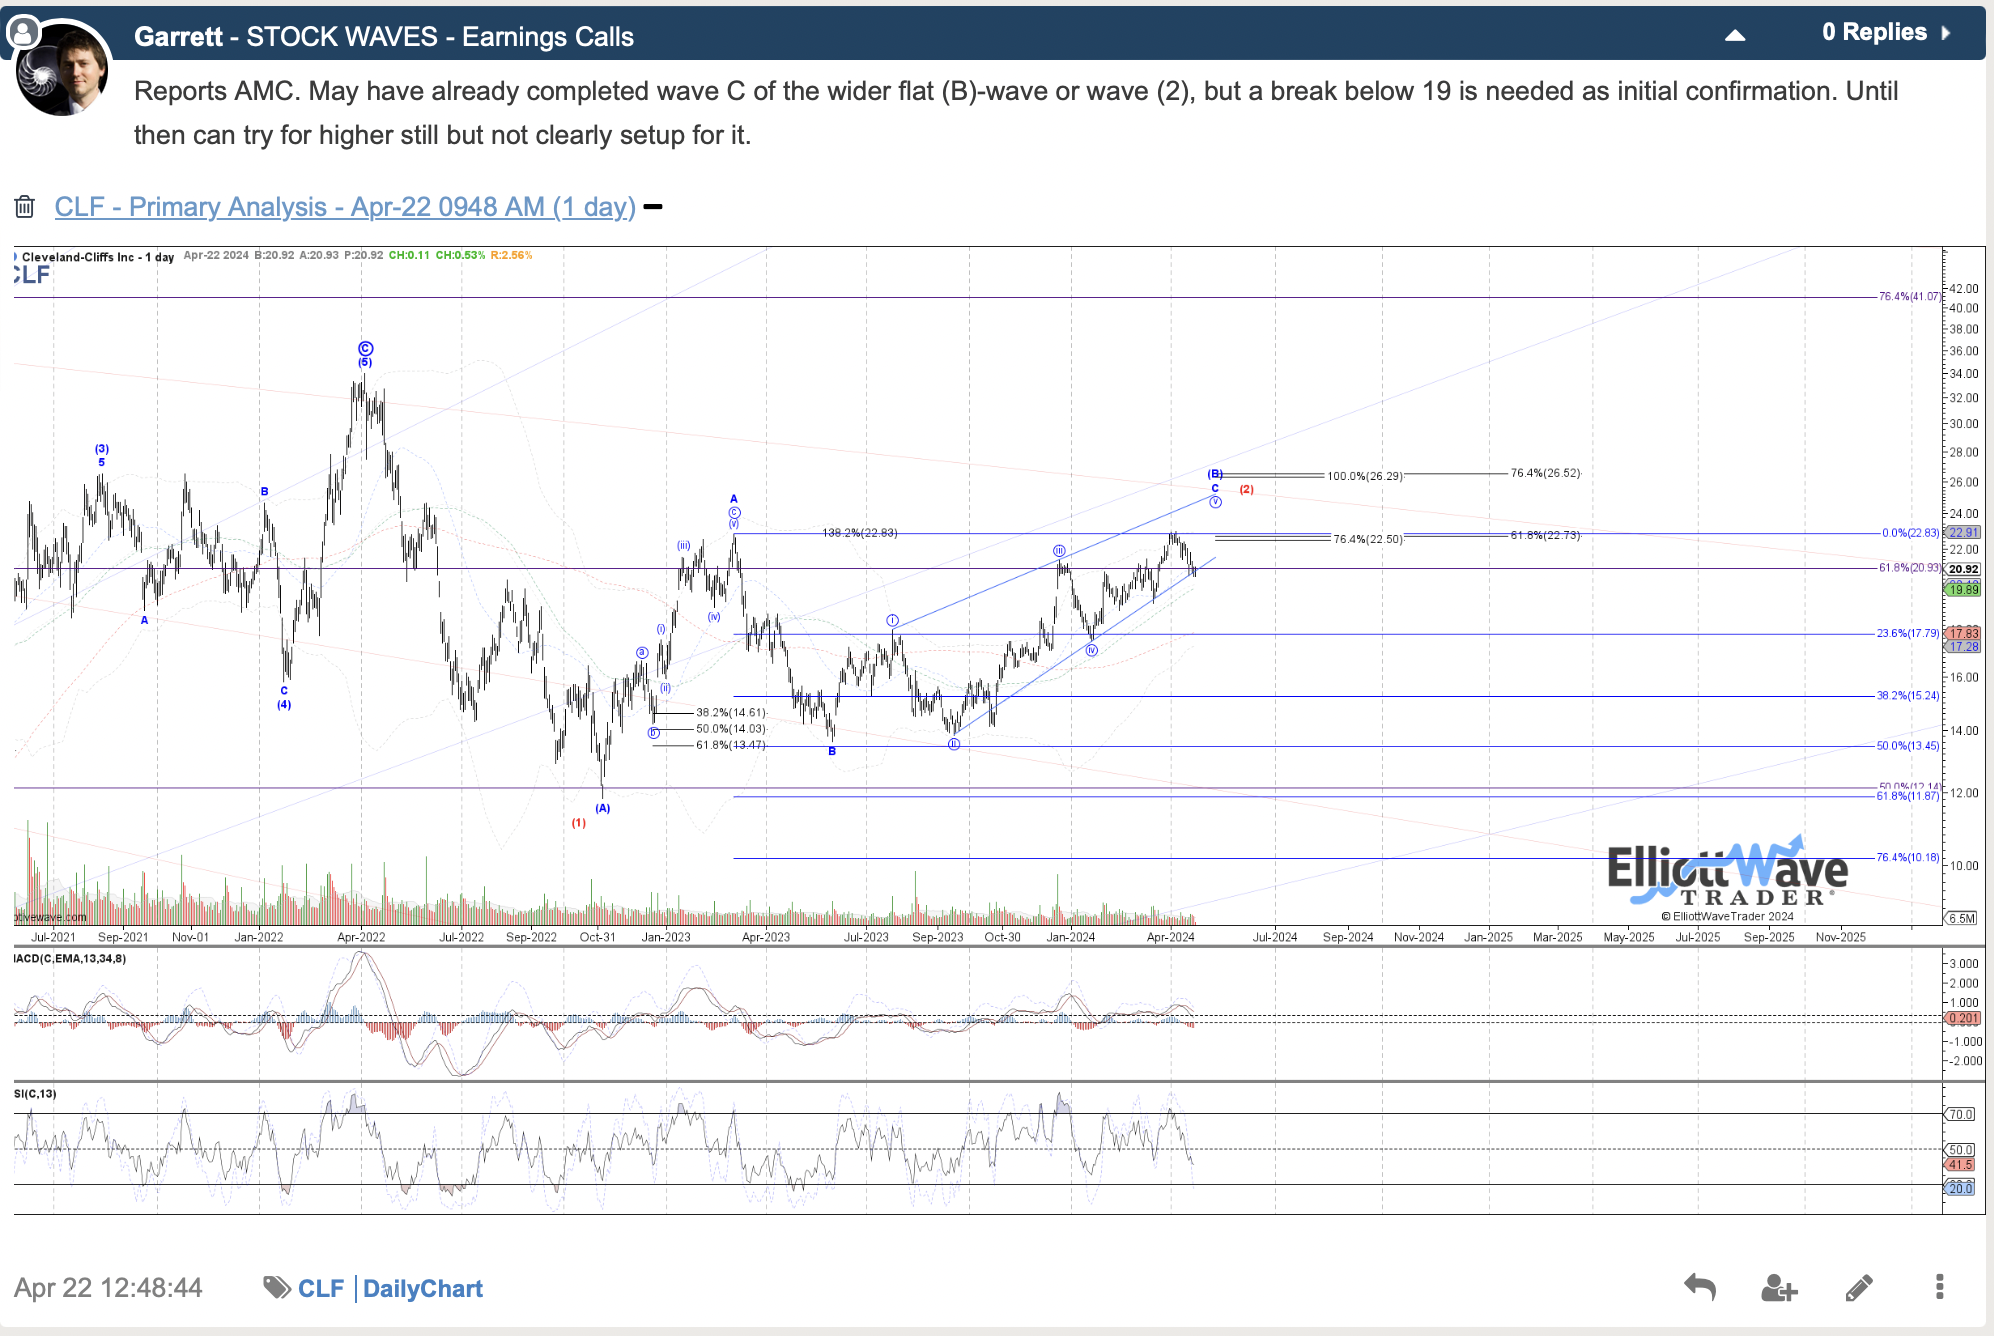
To provide a bit of context for where we currently find ourselves, note how Garrett Patten was on the lookout for this very setup back in April of this year.
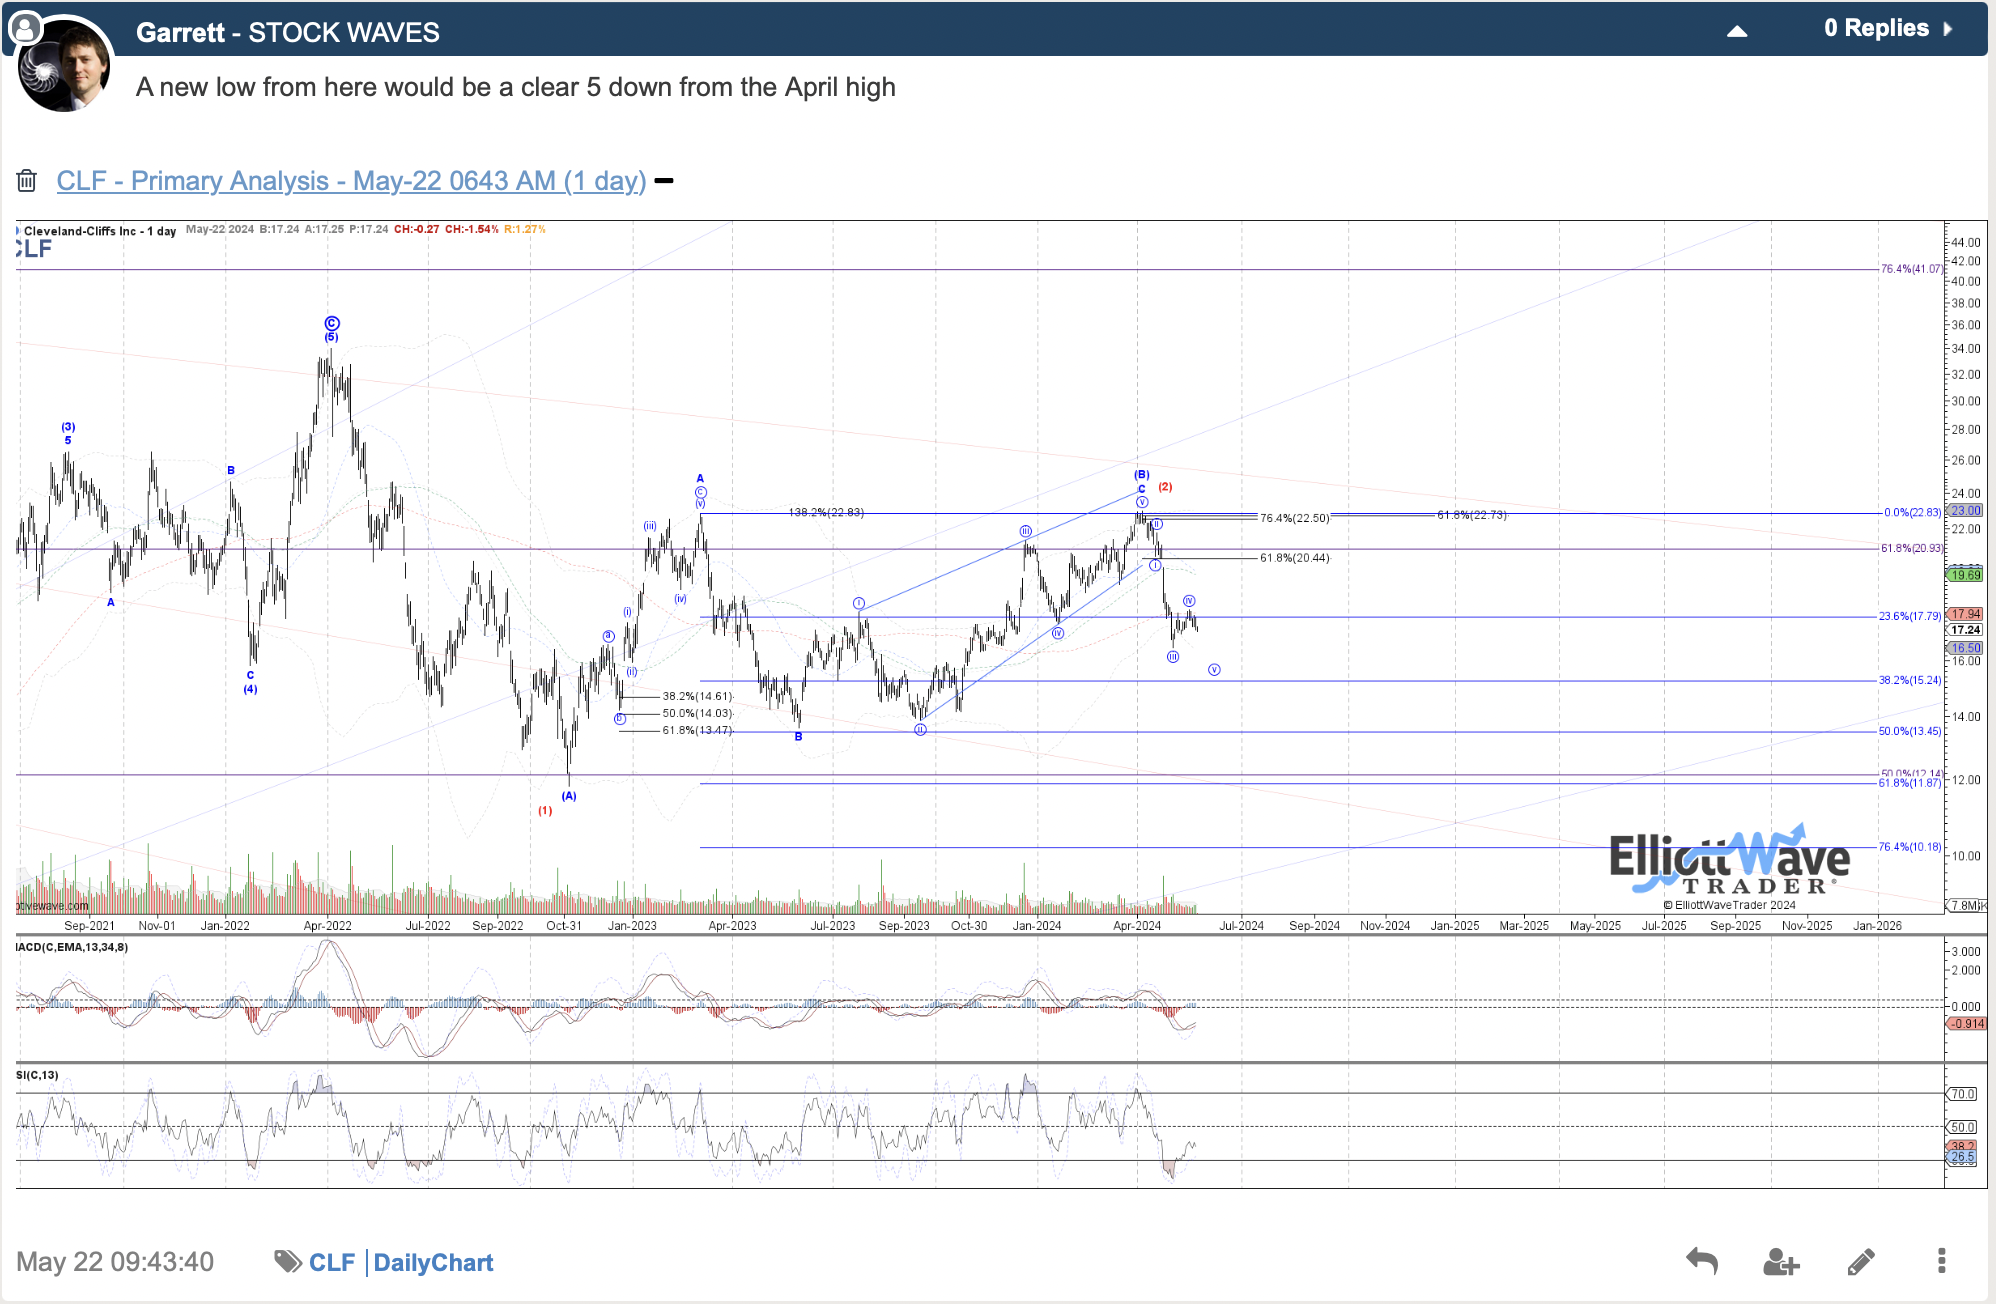
Then, a month later, another key update was provided.
Perhaps your next logical question would be, “Great! How does this help me now?” Please let us further elaborate on why Elliott Wave Theory, correctly applied, along with the overlay of Fibonacci Pinball is such a dynamically useful tool to have in your trading and investing life. Then, we will take a brief snapshot of the (CLF) fundamental picture. To follow will be the most likely path forward that we can currently see for the stock price.
The Power Of Pinball In Your Hand
Please take a few brief moments to review our recent article on another cyclical name, Alcoa (AA). Note how the use of Elliott Wave with Fibonacci Pinball has allowed us to properly project the path for the last several months. The bullish scenario led to a move from $26 to $44. It was at that point that the structure of price was telling us to turn temporarily cautious. With (AA) currently at the $30 level at the time of writing, that appears to have been warranted.
Let’s next listen to Lyn Alden’s take on (CLF) and then we will give a specific scenario for the stock.
The Current Fundamental Snapshot For CLF
Lyn: I would note that it has deteriorating fundamentals and is junk-rated, so it's rather bearish at first glance. As a steelmaker it's highly cyclical, so I can't preclude a recovery in it, but upon my initial screening there is nothing that would entice me to look deeper into it as a long opportunity. It could be a beneficiary of future re-shoring stimulus efforts, but there are other steelmakers with wider economic moats.
So, how can we mesh this potentially bearish situation with an actionable plan on the chart?
Fibonacci Pinball - How Can It Help You With CLF And More?
Avi Gilburt has shared this many times with our membership:
“While I was learning Elliott Wave on my own, I was trying to obtain a more ‘track-able’ and ‘tradable’ understanding of the fractal nature of the markets. This is probably what many struggle with the most. Specifically, it is when we say that within a 5 wave move, each impulsive wave breaks down further into 5 waves each, with some waves becoming extended.
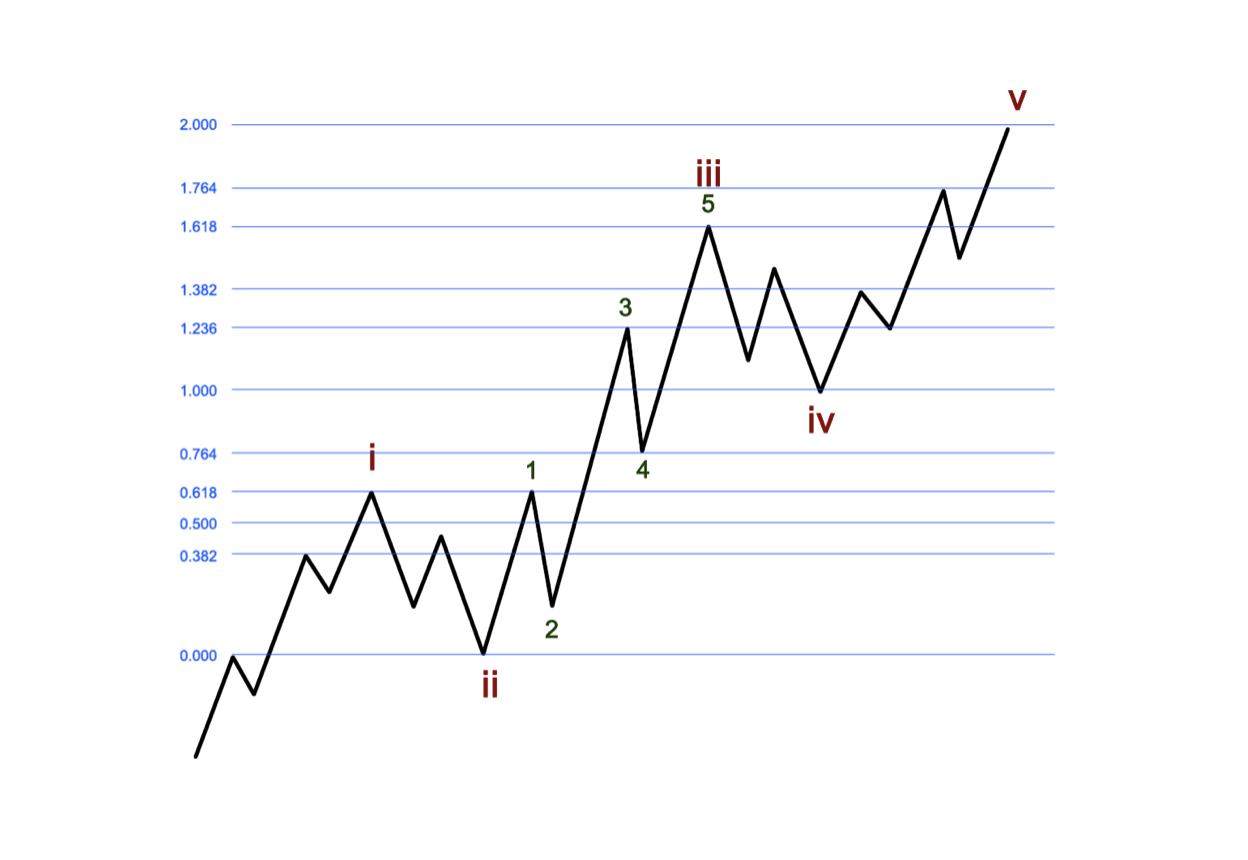
Well, after much analysis and observation, I identified a standardized method to trade waves 3-5, once waves 1 and 2 were in place. Now, remember that this is a standardized method that is a most common phenomenon in the market, but markets can and do vary from this standardized presentation.”
The fractal nature of the market becomes readily evident when you see with your own eyes how structures repeat at all degrees. Simply stated, this means that the larger 5 wave structure will see each of the waves 1, 3 and 5 subdivide into 5 wave forms of their own. As well, inside our Fibonacci Pinball structure we are able to identify high-probability turning points and places to turn potentially more cautious or more aggressive.
Theory In Action
Theory is great, but we must be able to successfully apply said theory into a useful tool for trading and investing decisions. And, here it is.
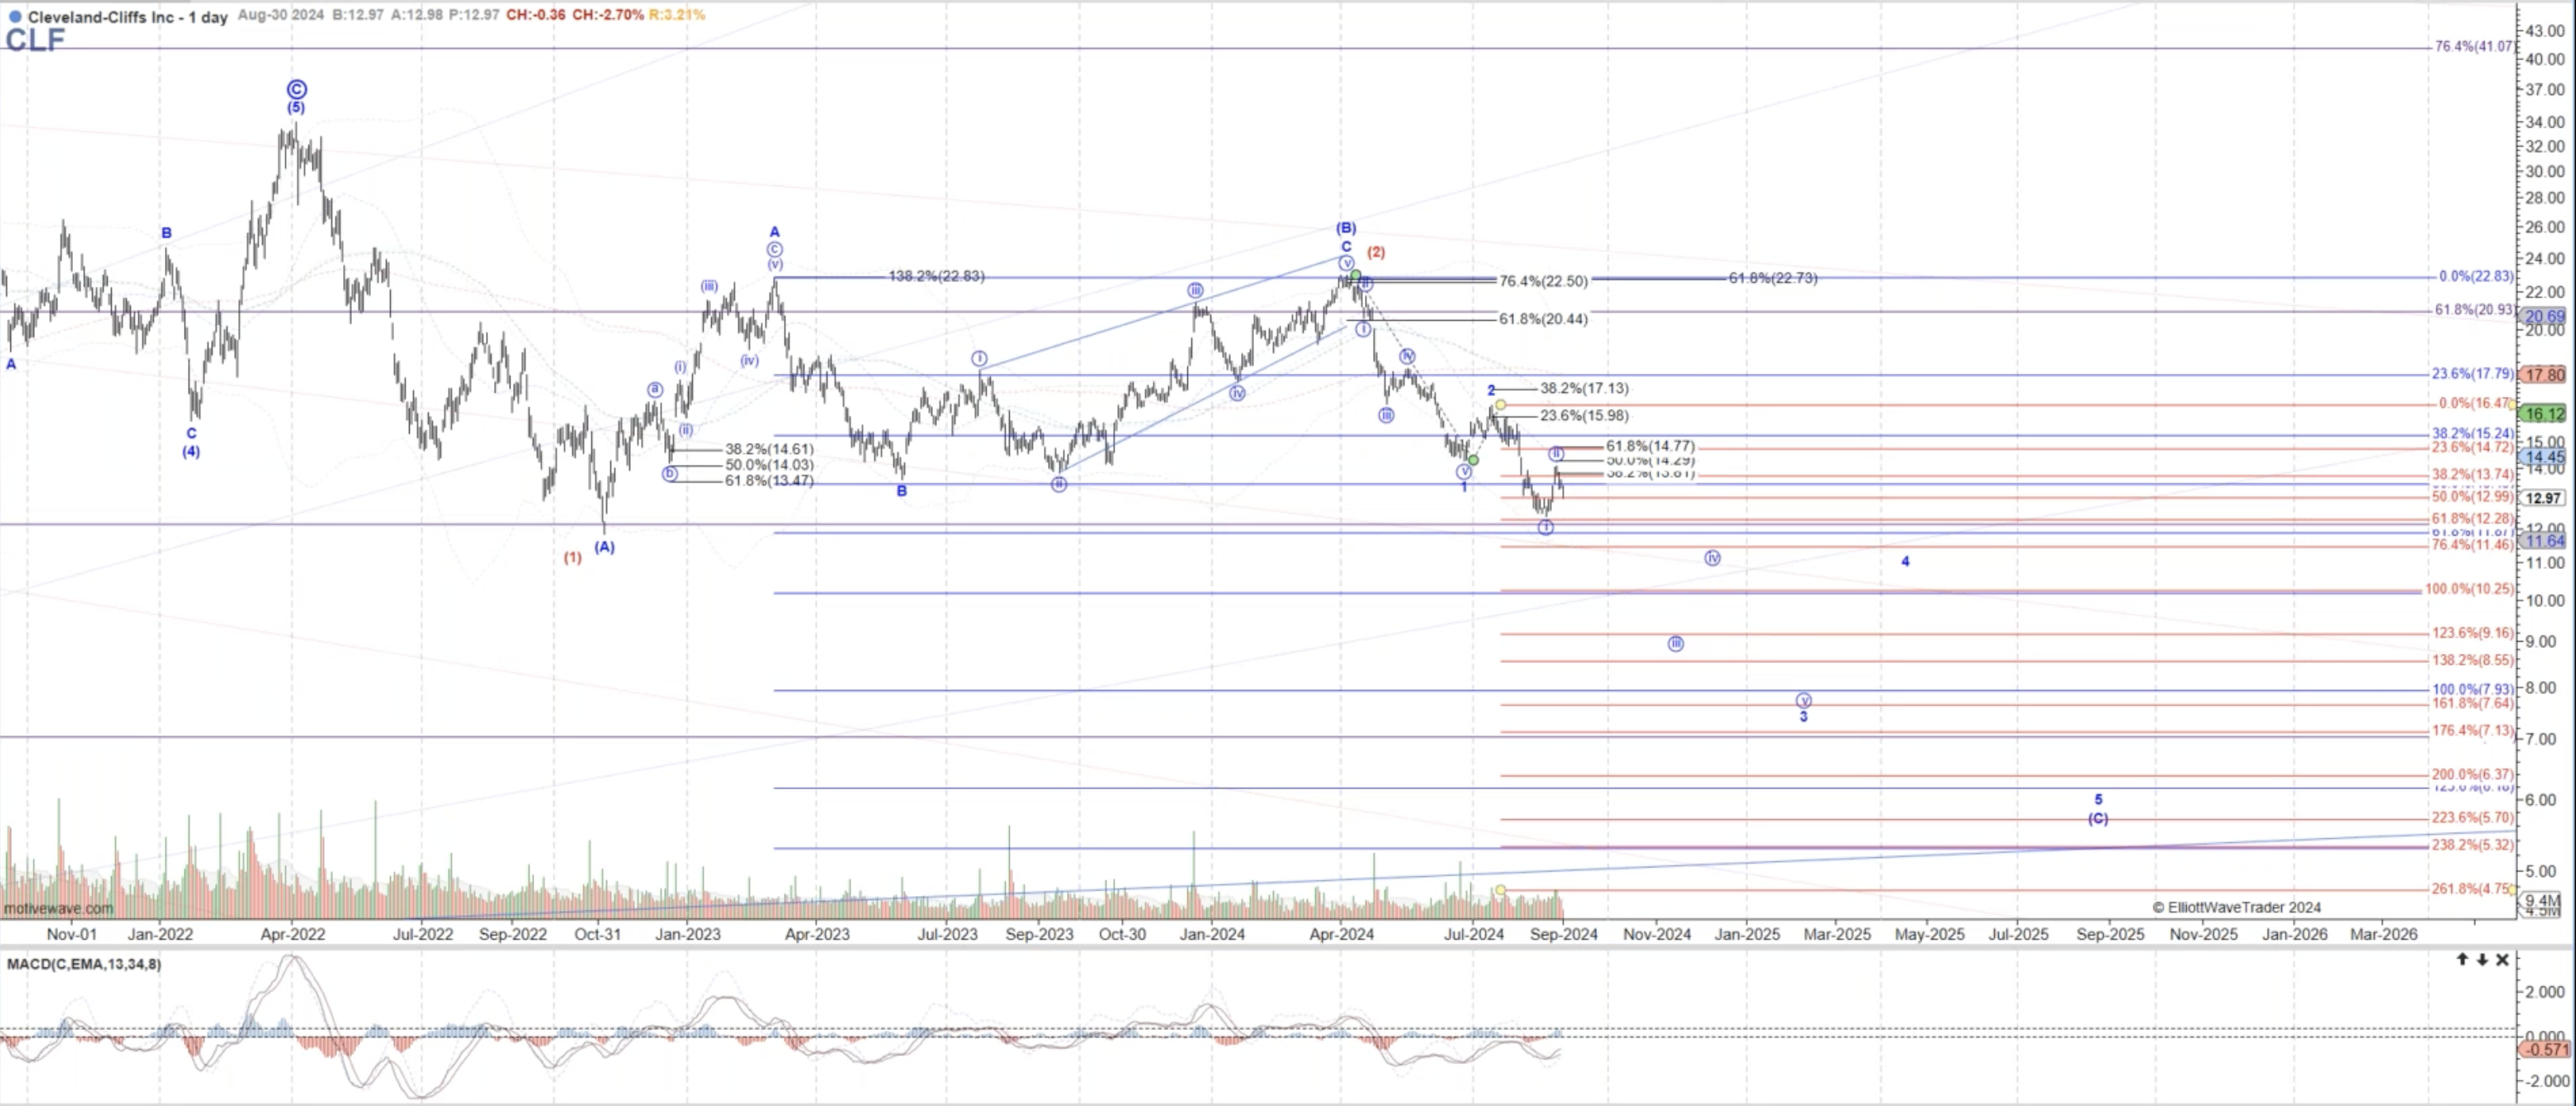
With the breakdown today, it further confirms what Garrett has been projecting for some time now. Price is likely in the heart of a third wave down in the larger [C] wave. It is also probable that there will be corrective bounces on the way down to the target shown at the lower left corner of the chart. How many times have you bought a stock based on fundamentals that appear to be getting cheaper only to have the stock continue its decline?
Fibonacci Pinball will help provide guidance in the developing structure of price. Just as Avi explains in the above portion of his article, as price continues to move through the structure, resistance and support levels will be dynamically updated for the user.
In the case of (CLF), price should now remain under $14. Once the chart unfolds further, that resistance will also be moved accordingly.
Conclusion
Using Fibonacci Pinball, we are now able to track the likely turning points for (CLF) as this bearish structure progresses. This is a forward-looking method, not something that explains what just took place.
Yes, there are nuances to the analysis. Once familiar with our methodology, our members discover a powerful ally on their side to provide guidance and risk management in their trading/investing.
We have an extensive Education library available at Elliott Wave Trader. As well, we want to teach others this methodology. Three times a week we have beginner and intermediate level videos where we show the exact way we count the waves and give in-depth analysis techniques. This methodology, if you give it the chance, will change the way you invest forever. More on that can be found here.
There are many ways to analyze and track stocks and the market they form. Some are more consistent than others. For us, this method has proved the most reliable and keeps us on the right side of the trade much more often than not. Nothing is perfect in this world, but for those looking to open their eyes to a new universe of trading and investing, why not consider studying this further? It may just be one of the most illuminating projects you undertake.
