Driving In The Rearview
Driving in the Rearview
Two years ago, I sounded the alarm about the risks of inflation. Long-time members will remember that I wasn't focused on the headline numbers, which many were explaining away as supply chain snarls and "transitory". Instead, I focused on the metrics pointing towards persistent inflation. Among the factors I discussed were:
- The bubble of liquidity. Very high savings rates among consumers were propelling record demand growth for a variety of goods.
- Rapidly rising housing costs. Spurred by record numbers of home buyers, home prices were skyrocketing. Low mortgage rates and consumers having excess funds saved up, spurred this, making down payments easier.
- The Great Resignation. The labor market was extremely imbalanced as many workers left the workforce. A record number retired early, leading to a significant labor shortage.
- Rising producer prices. As measured by the Producer Price Index, skyrocketing business costs were inevitably going to be passed along to consumers. Since consumers had the means to pay, rising prices were unlikely to significantly impact demand.
When many were looking at the current inflation prints, we were looking forward to see what was coming. Inflation metrics always look in the rearview, and investors who drive in the rearview mirror are destined to crash. Worse, a Fed driving in the rearview will crash the entire economy.
Let's look at these factors and how they have changed over the past year.
1. The Bubble of Liquidity
As I've been saying all along, inflation is being driven primarily by consumer demand. We can discuss a million reasons why consumers had higher demand post-COVID than pre-COVID, but it is undeniable that they did. One primary driver of demand is how much money consumers have. Consumers with a lot of money are likely to be willing to spend more than consumers with little money.
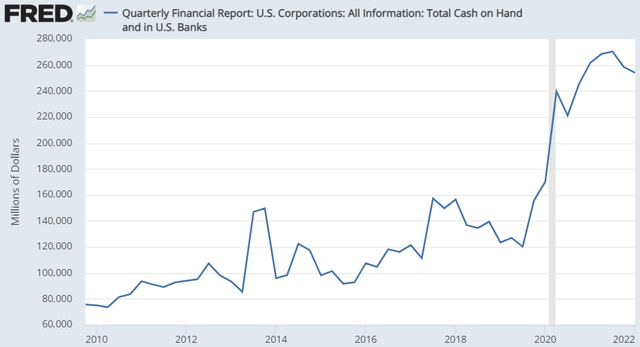
In 2020 and 2021, we spoke a lot about the "Bubble of Liquidity" and its impacts on the economy and the markets. The Bubble of Liquidity is alive and well in the hands of corporate America.
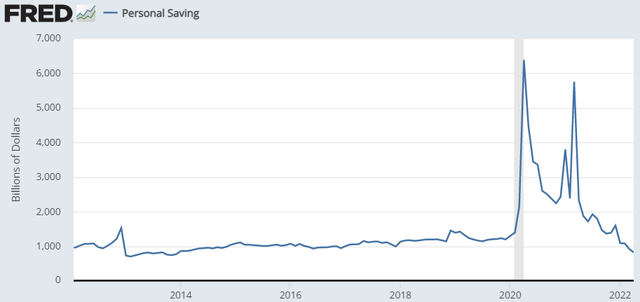
The story is very different for the U.S. consumer.
Savings are now below pre-COVID levels. Consumers still have low debt, relative to their income. Household debt service as a percentage of disposable personal income is below historical averages. However, they no longer have the excess amounts in their savings accounts that encourage them to make large purchases. Most consumers, faced with dwindling savings, will be forced to choose between going further into debt or curbing their spending.
Consumers sitting on large savings account balances were a significant driver of demand and, therefore, inflation. That driver is now significantly diminished. As a result, demand will fall and is almost certainly falling right now. Since many companies were faced with large amounts of backorders, that decline in demand might not be readily apparent. It will be in the coming months.
2. Rapidly Rising Housing Costs
Housing prices have skyrocketed, but even today, CPI is only reflecting a 5.5% year-over-year increase in housing. Anyone who has bought or sold a house signed a new lease, or even browsed listings knows that rent and home prices are up a lot more than that.
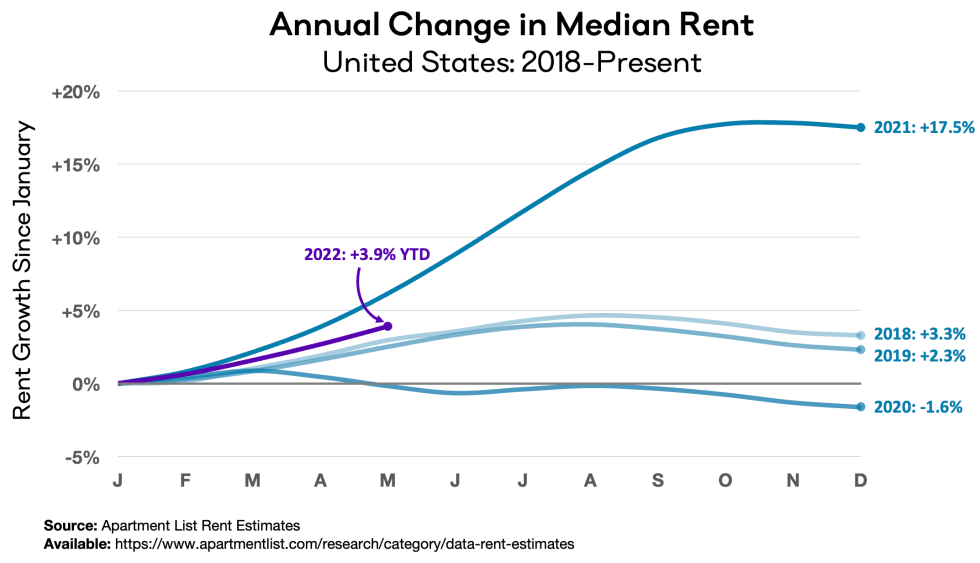
Rent is still climbing at an above-average pace but at a much slower pace than last year.
Yet, for CPI, housing inflation is reading much higher than last year. Why? Because of the way inflation statistics account for rent using "owners equivalent rent" or OER. People aren't signing leases every day, and landlords can't just raise the rent until the current lease ends. Similarly, not everyone is buying a new house every year, so the cost of your house going up is not an actual expense for people who already own their houses.
As we discussed last year, it takes approximately 16 months for OER to reflect inflation in house prices. So the OER inflation we are seeing today in metrics like CPI or PCE reflect inflation that occurred early in 2021 – not what happened last month.
You could even ask a rocket scientist, and they'll be able to tell you that the housing market is destined to slow down. If you ask a Freddie Mac economist, mortgage applications for new purchases have fallen dramatically.
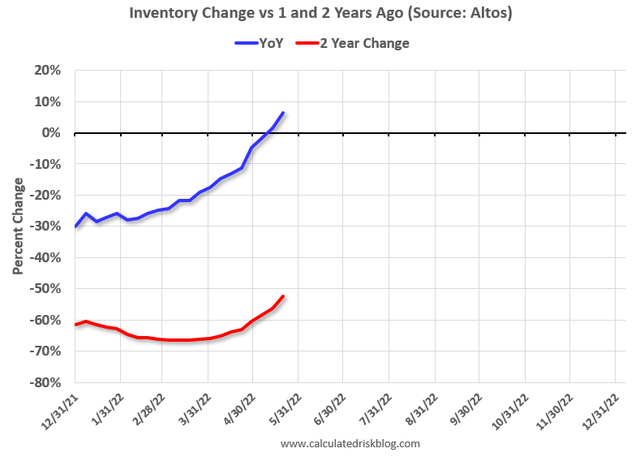
Housing prices have been aided by a shortage of homes listed for sale. However, that is changing as demand slowed down. Inventory (the number of homes available for sale) has increased year over year for the first time in two years.
Calculated Risk
While housing inventory is still low compared to pre-COVID levels, it is climbing. With mortgage rates approaching 6% for the first time since the mortgage crisis, we expect demand for buying homes to continue declining.
Due to the nature of the housing market, buyers submit a bid and don't close on the agreement often for several months. Due to this, there is always a huge lag in data. Add on that inflation metrics are delayed as much as 16 months, and you can see how looking in the rearview mirror tells you very little about what is happening today.
There might be some areas, particularly wealthy areas, that are still seeing high demand. Yet, as a whole, the housing market is seeing a major contraction, and that contraction will get worse, especially if the Fed throws a wet blanket on it with aggressive rate hikes.
3. The Great Resignation
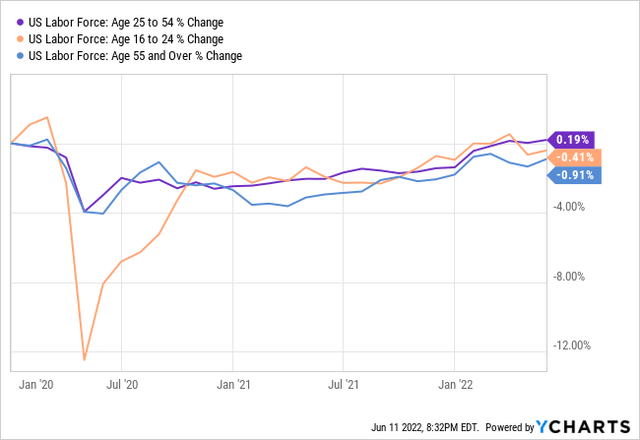
During COVID, a large portion of the labor force was laid off. A great many didn't immediately return back to work. Today, the labor force is back to pre-COVID levels in gross numbers. The age 55+ group continues to trail as many workers took early retirement.
In 2020 and 2021, the lack of workers was creating significant stress on many companies, especially since the workers who didn't come back also had the greatest amount of experience.
As a result, employers were forced to offer higher wages to attract the needed employees. Even with higher wages, many struggled to find sufficient labor.
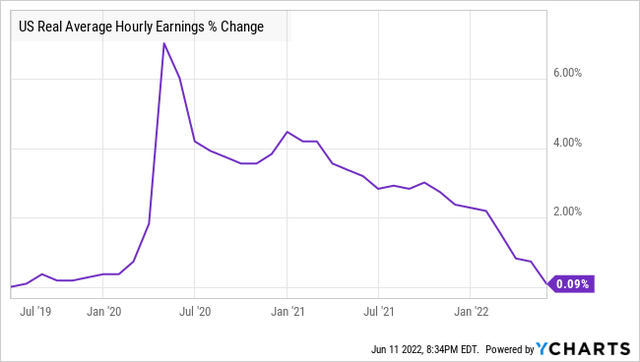
"Real" average hourly earnings, adjusted for inflation, leaped up.
Higher real earnings mean that workers can buy more with their incomes even after adjusting for inflation. In other words, the workers get a higher wage, and that higher wage can buy more things. This was another major driver of demand throughout 2021.
Inflation has caught up. Today workers might earn more dollars, but they can buy the same amount of stuff as they could in 2019. They are making more money but are not necessarily able to buy more things. Wages have been a tailwind driving demand higher, and now it is a headwind that will drive demand lower.
The number of job openings remains very high, so wages will likely continue to grow but will no longer be growing at a pace exceeding inflation. Plus, as demand declines, many of those job openings will likely stop existing.
4. Rising Producer Prices
The Producer Price Index or PPI measures businesses' input costs.
It is typically much more volatile than consumer prices that CPI or PCE measures, but it can indicate the pressures being felt by businesses that are often passed along to consumers in the future.
In April, PPI nose-dived.

Bureau of Labor Statistics
May's report will be coming out this week. We can expect a bit of a rebound due to diesel prices driving up shipping costs. However, the increases in May are small compared to what we saw in March.
Producer prices are still climbing, but they are also moderating. In other words, they are climbing more slowly than they were before. Many commodities have come down from their spike up.
For the past year, manufacturers, retailers, and other businesses have been rushing to meet demand. With so much on backorder and the time to fill orders for everything from raw materials to finished products getting longer, businesses raced to place orders at any price. That is changing. Retailers like Target (TGT) and Walmart (WMT) found themselves with too much inventory. Many manufacturers will likely find themselves in a similar boat as demand declines and all the excess they ordered in advance to protect their supply chain isn't needed. What happens when a company has too much inventory? Prices come down.
HDI, described as the 'Must Own' Service for Income Investors and Retirees, offers a “model portfolio" targeting a yield of +9% Learn more here.

