Eyeing S&P 500's Pattern Of 3-4 Day Declines
Patterns don't ALWAYS repeat themselves....but they do often enough to pay attention to them.
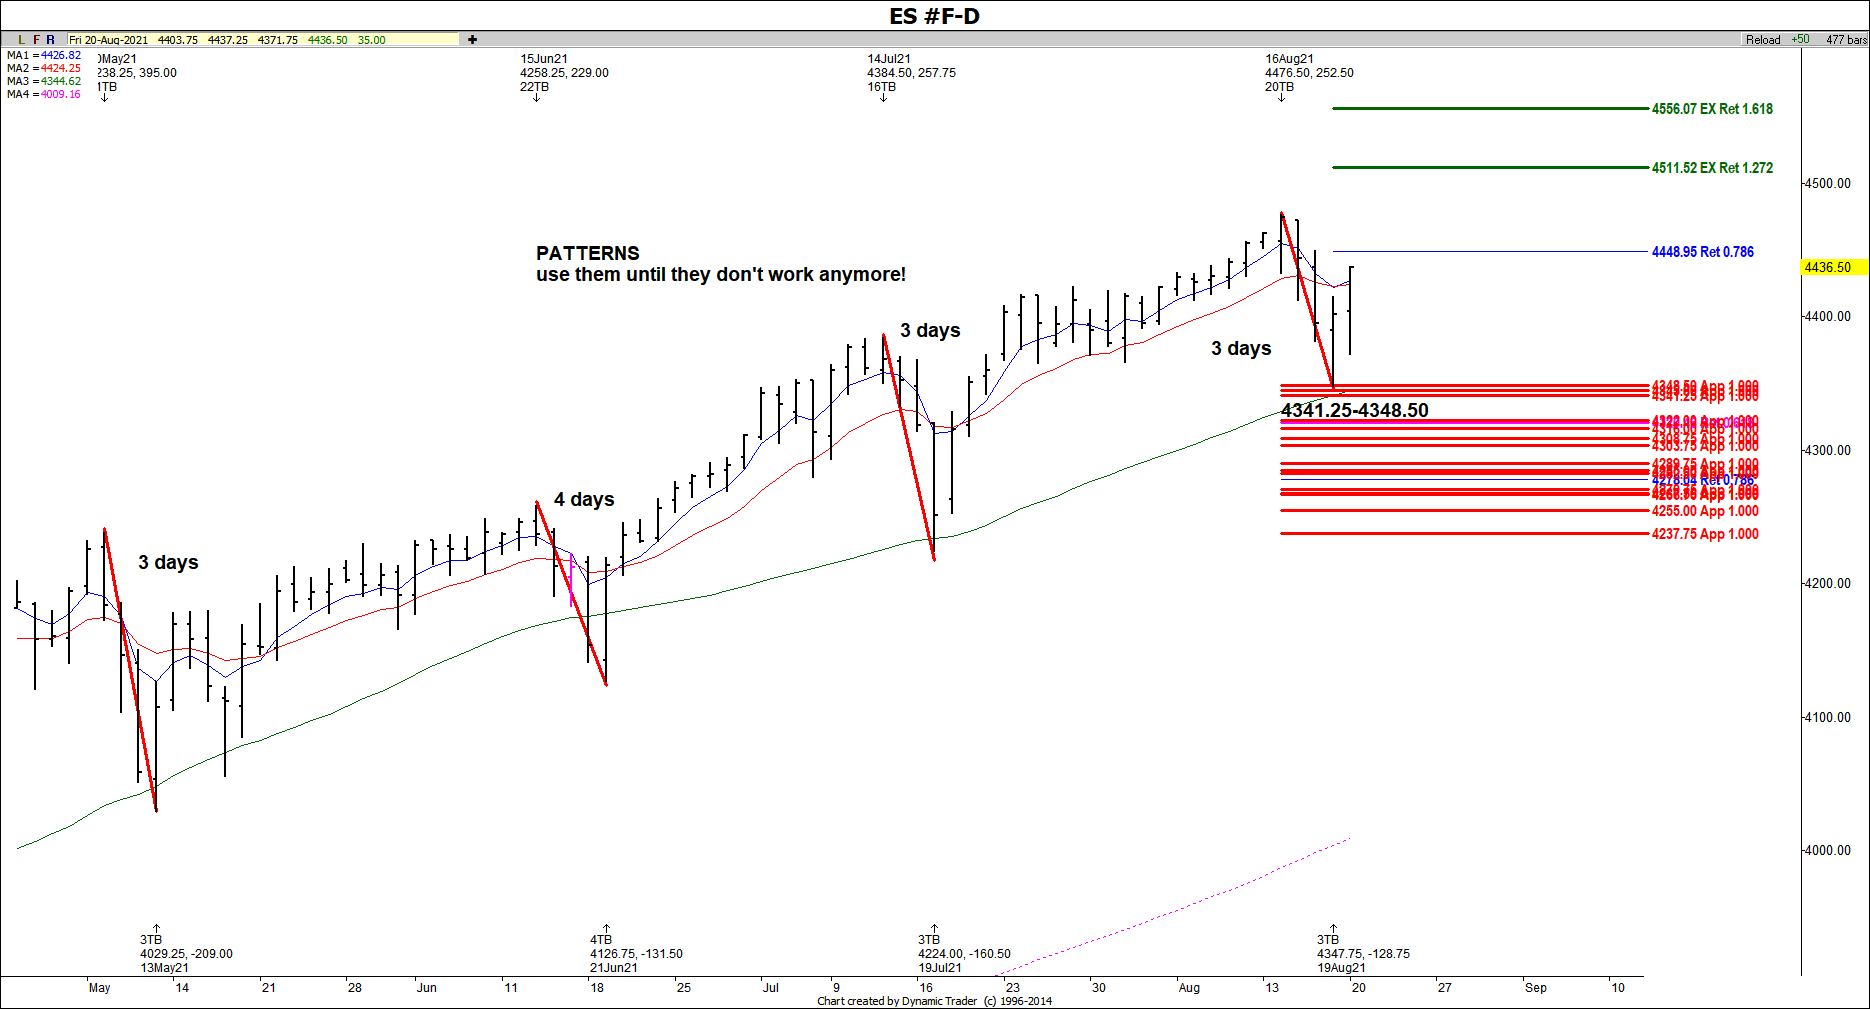
As you can see on the chart below, the Emini S&P 500 (ES) futures had a pattern of recent declines lasting 3 to 4 trading days from the last high.
So when the S&P 500 traded down from Aug 16 high in 3 consecutive sessions, we had to watch it for possible resumption of the rally. We also noticed that the low on Day 3 was also made into symmetry support at the 4341-4348 area, positioning the index for a bounce.
So far we've seen a rally of 89.50 S&P points. Now if this is a more important low, the index needs to clear the next hurdle at the 786 retracement.
If it does, then the potential upside is to the 4511 area. Any longs should be trailing up stops as we go.


