Flat Is The Correct Position
As anticipated in last weekend's update, we did hit a low on schedule on WWW (the Wednesday of the week before options expiration week) and rallied hard from there into early morning Friday before cooling off a little into the end of the week.
What next?
Mixed bag today on our indicators and models. Secret indicator combo is neutral but close to a sell. Internal models are buys on larger timeframes but bearish on the lowest timeframe, a warning sign. Options data by itself looks bearish on the whole with SGPCR below 2.2, but very short term data looks bullish.
Considering everything along with price, I think we have more corrective business on the downside ahead -- the only thing is that it is OPEX week and we usually do have a positive bias on these weeks. IF things get bearish though, it can get really ugly quick, so we need to be on our toes. Bears need to get price below 3200 and then 3181 to turn things bearish. And if this is a bullish consolidation, 3240/3230 area should hold before attempting higher highs again. We are flat right now and watching for the next signal trigger for us to take a fresh trade. Until then, flat is the correct position.
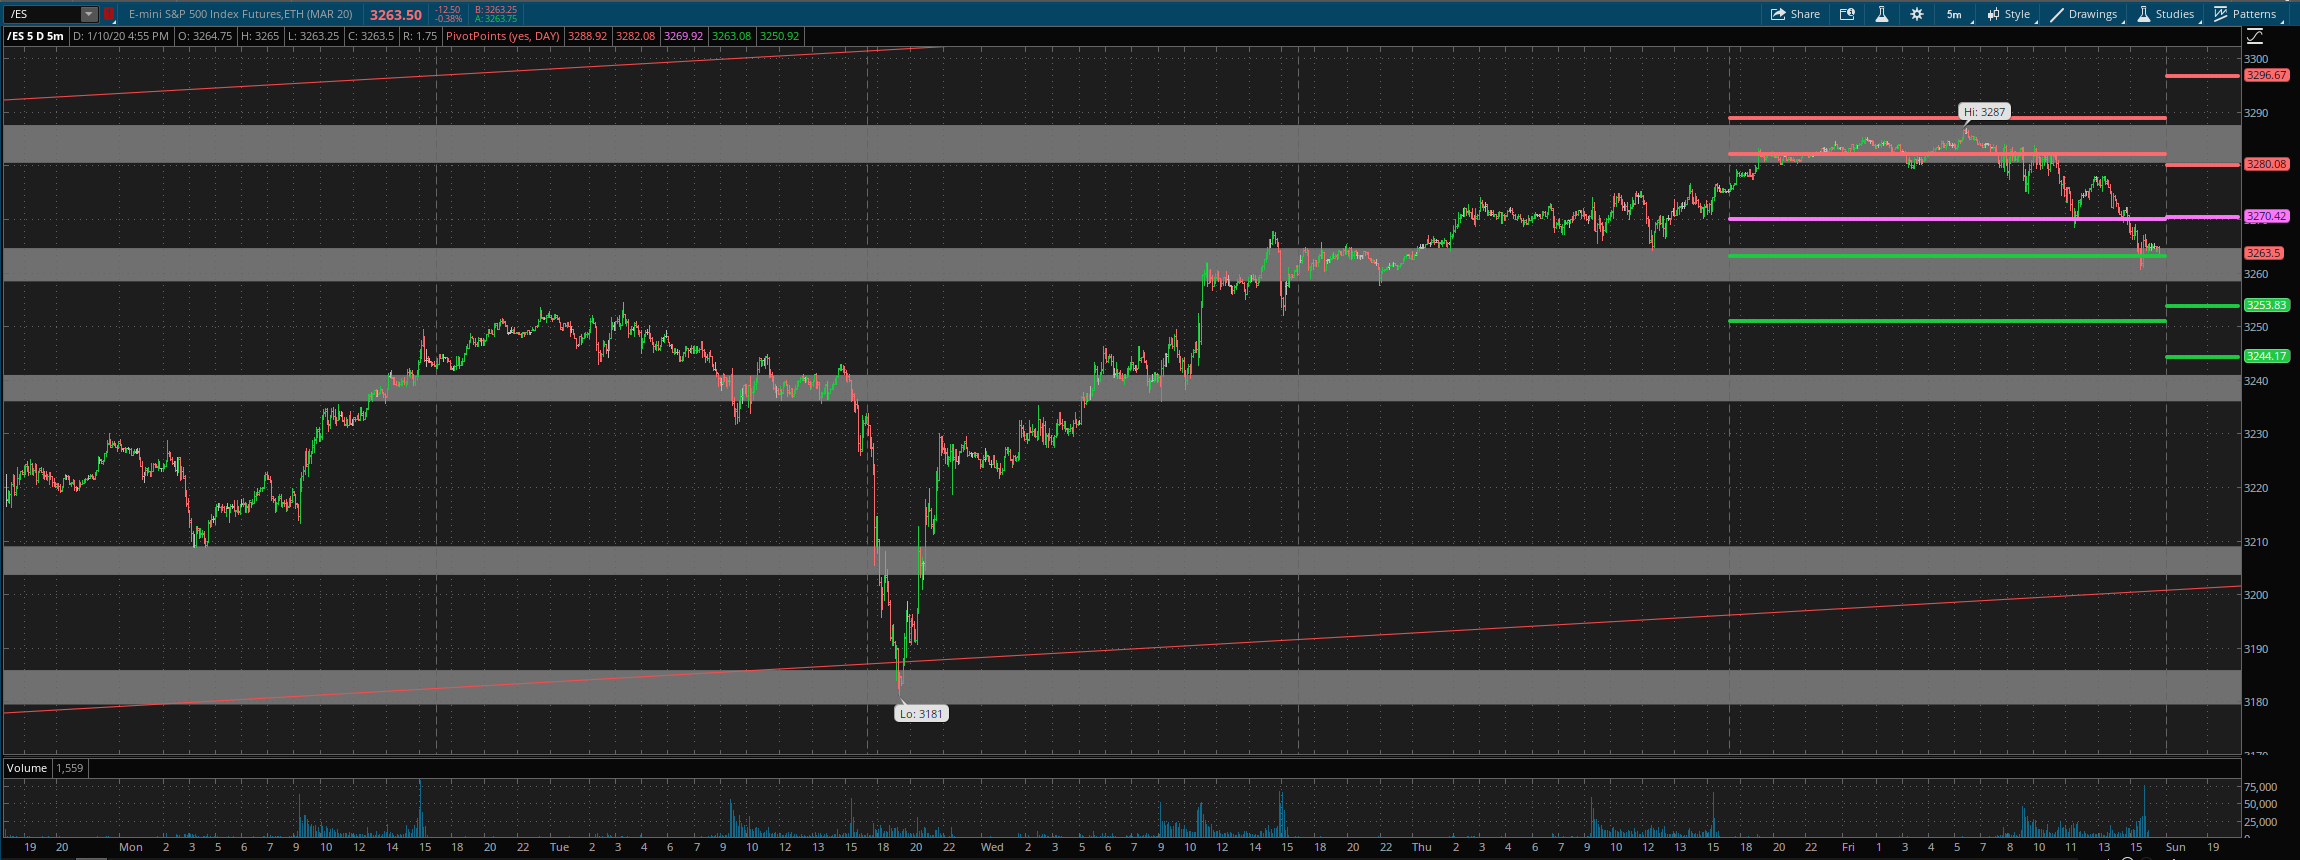
ES Grey Zone areas: The grey zones on the ES 5 min chart below are what I draw in on a discretionary basis - they are supports and resistance areas which the market is most likely to react from. If we test a zone from below, it is likely to be rejected and fall lower to test support zones below. If we test a zone from above, it is likely to take support there and begin a move higher. So these zones can be used for intraday trading and/or as entry points for positioning for swing trades. These zones are drawn in based on what the market has done there previously both on smaller and larger timeframes.
Grey zone resistance at 3280-87.. Support is at 3264-59, 3240-3236 and then at 3204.
Daily pivot is at 3270.5. Resistance R1 is at 3280 and R2 at 3296.5. Support S1 is at 3254 and S2 at 3244.
All the best to your trading week ahead.


