GLD Continues To Chug Along And Follow Its Outlined Path
I wish everything in the metals complex would be as relatively easy as GLD has been for many years. While it occasionally provides us with a twist, it has been rather strongly adhering to the wave count expectations we have presented for many years.
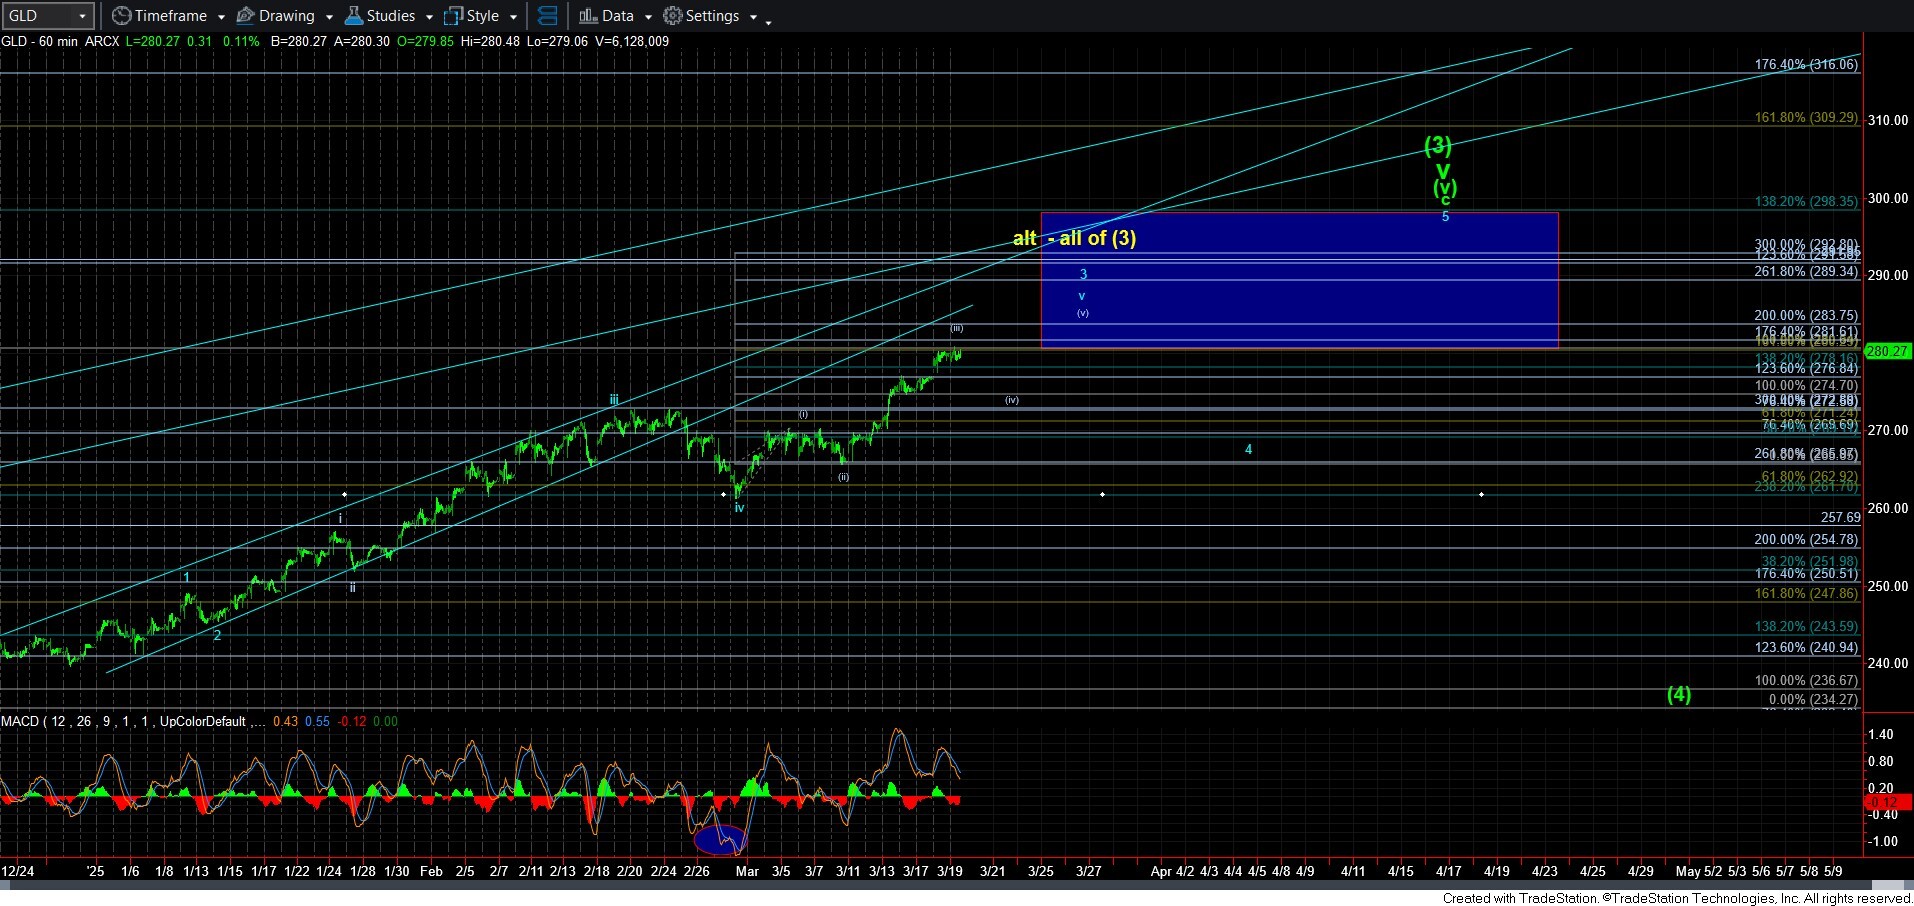
As we stand today, I am seeing us completing wave [iii] of v, which can be clearly seen on the 60-minute GLD chart. That means that I am expecting a wave [iv] pullback in the very near term. Support for that pullback is the micro 1.00 extension I the 274.70 region, based upon the [i][ii] structure within wave v. As long as the market holds over that support, I am looking higher one more time towards the 284 region to complete wave v.
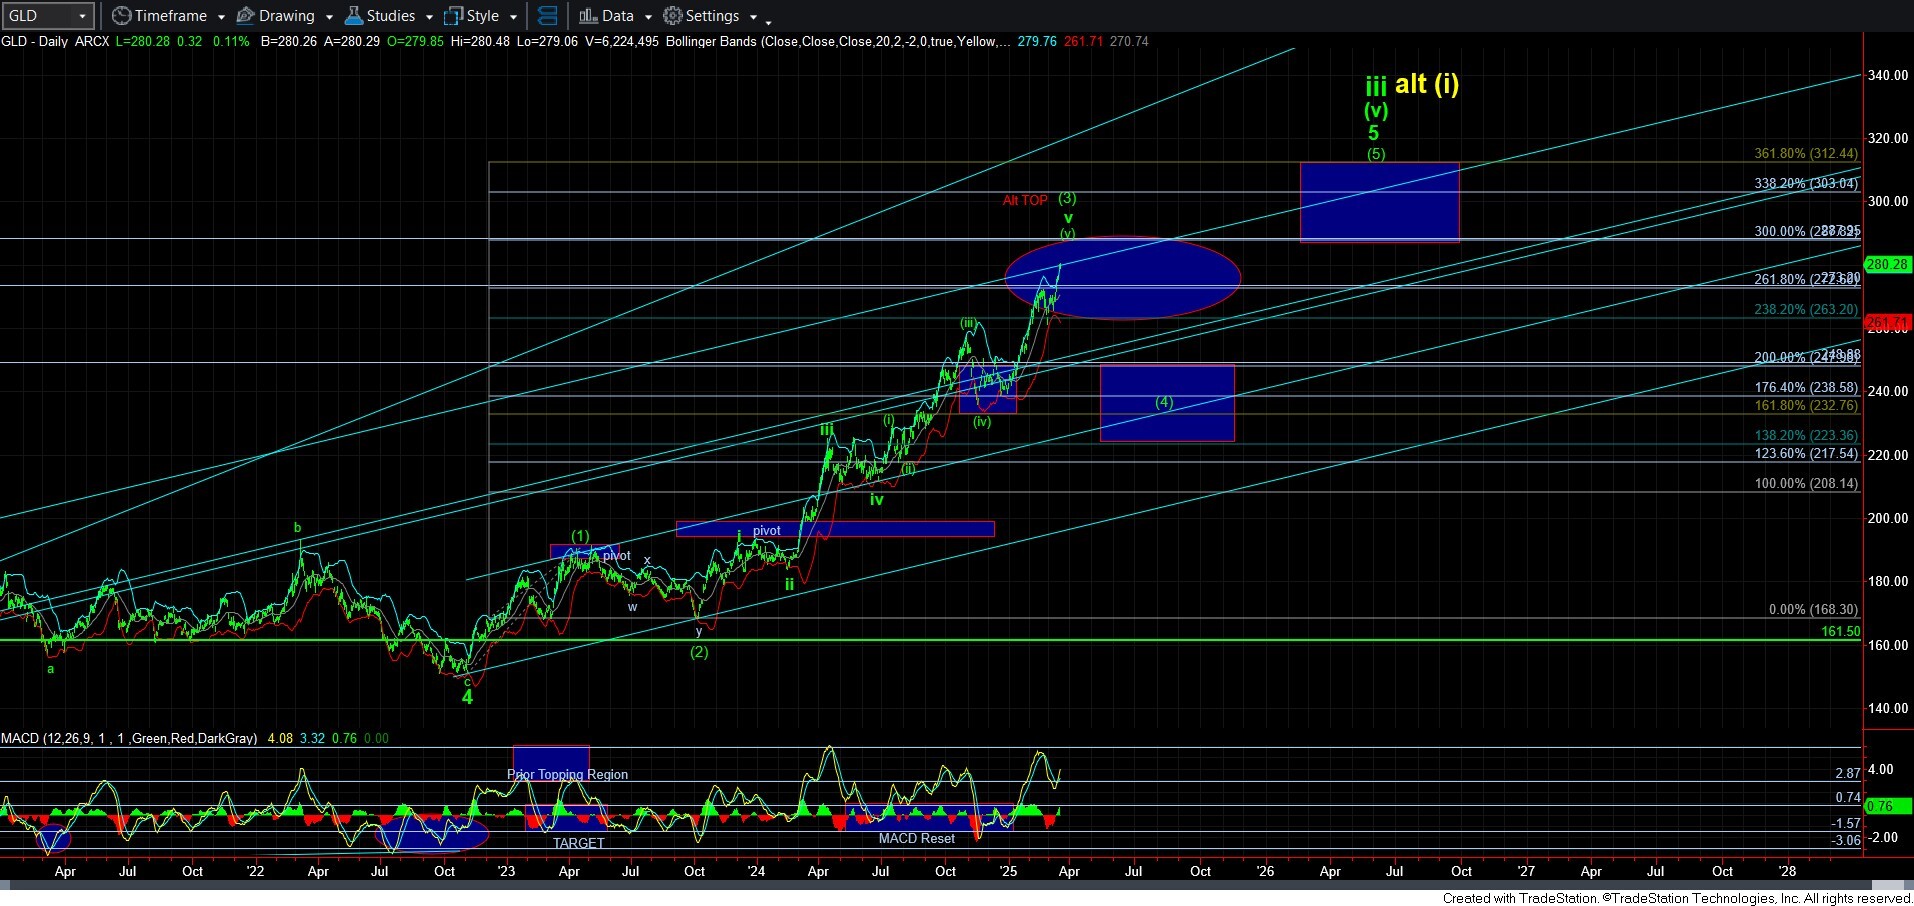
Now, I want to reiterate a point I have made in my live videos as well as some posts and alerts I have made in the trading room. I want everyone to look at the daily GLD chart attached. As you can see, we are coming to the end of the larger degree wave [3] within the final 5th wave off the 2015 low. That means we are approaching a point where our expectations should be turning towards a wave [4] pullback. And, I want everyone beginning to consider that potential for the next larger pullback. I have a larger box presented on the chart for a general expectation for the wave [4] pullback. Once wave [3] is confirmed completed, then I can adjust that target a bit more.
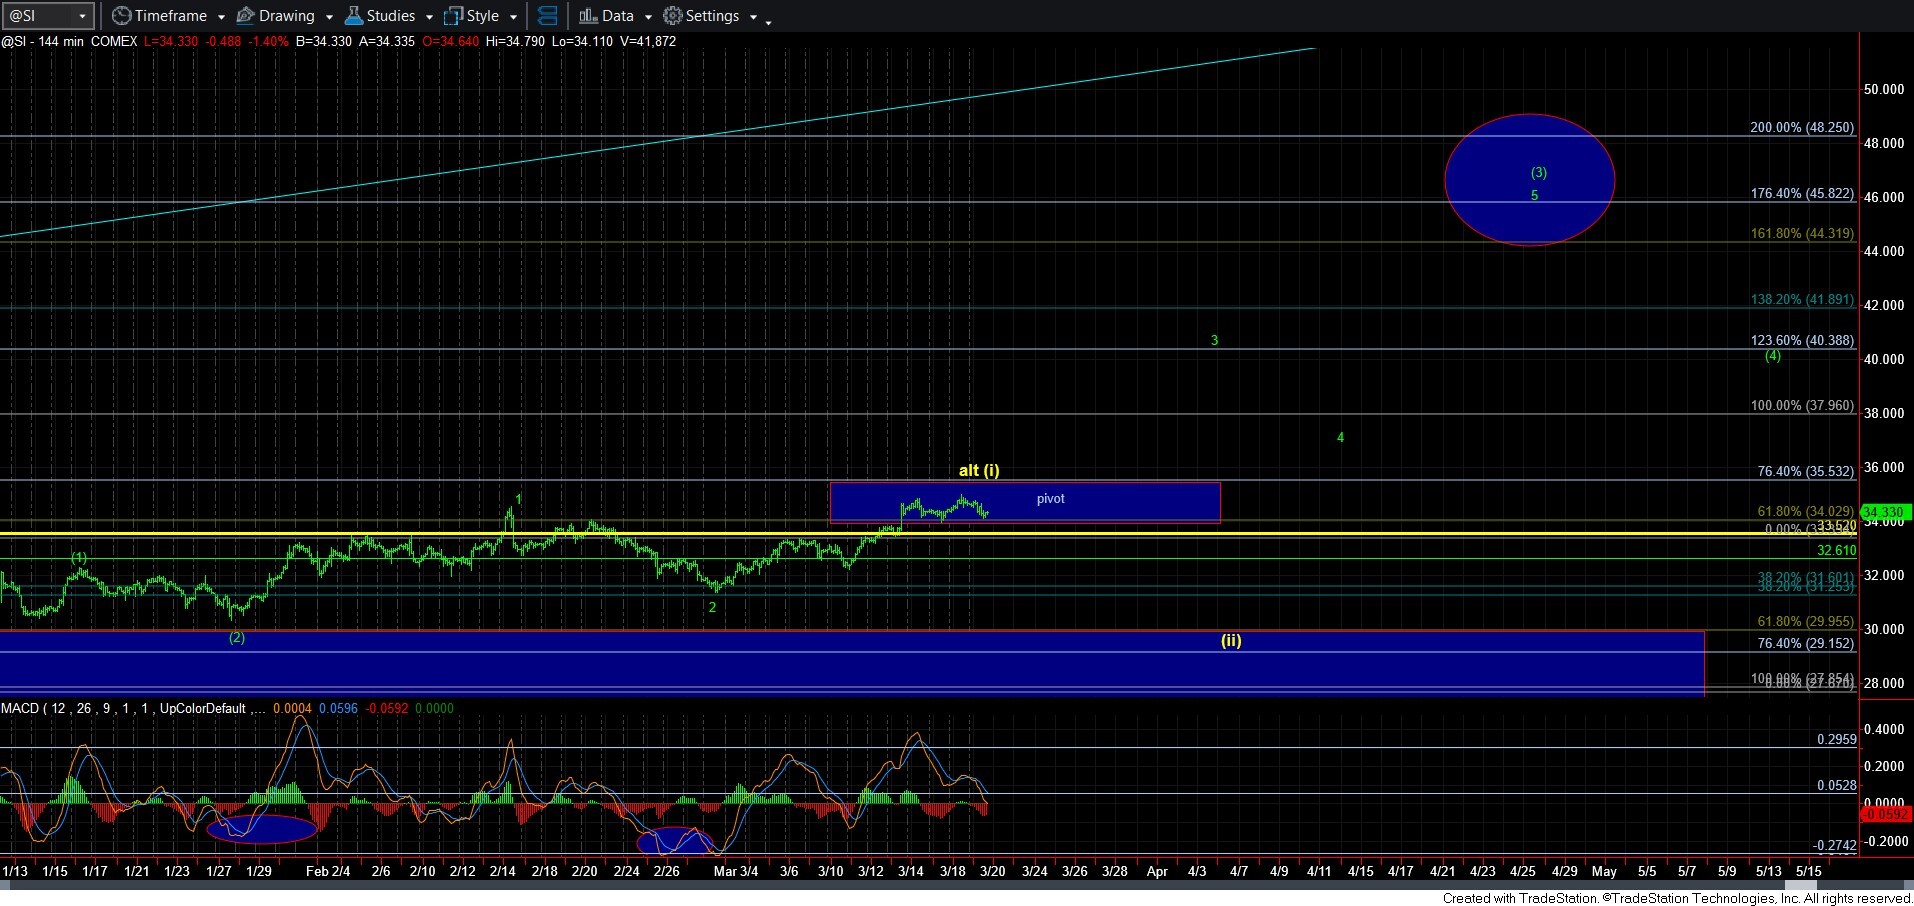
With GLD really providing us wonderful signals and structure, silver has been doing just the opposite. I really wanted to see a strong follow through to the upside this week in silver to confirm the break out potential. However, I am starting to get a bit concerned. In fact, I have noted in the trading room that I will likely cash in my shorter term options if silver breaks the 34 region on my charts. I would rather cash in my profits than risk them within a pattern that becomes much more uncertain by the break of 34.
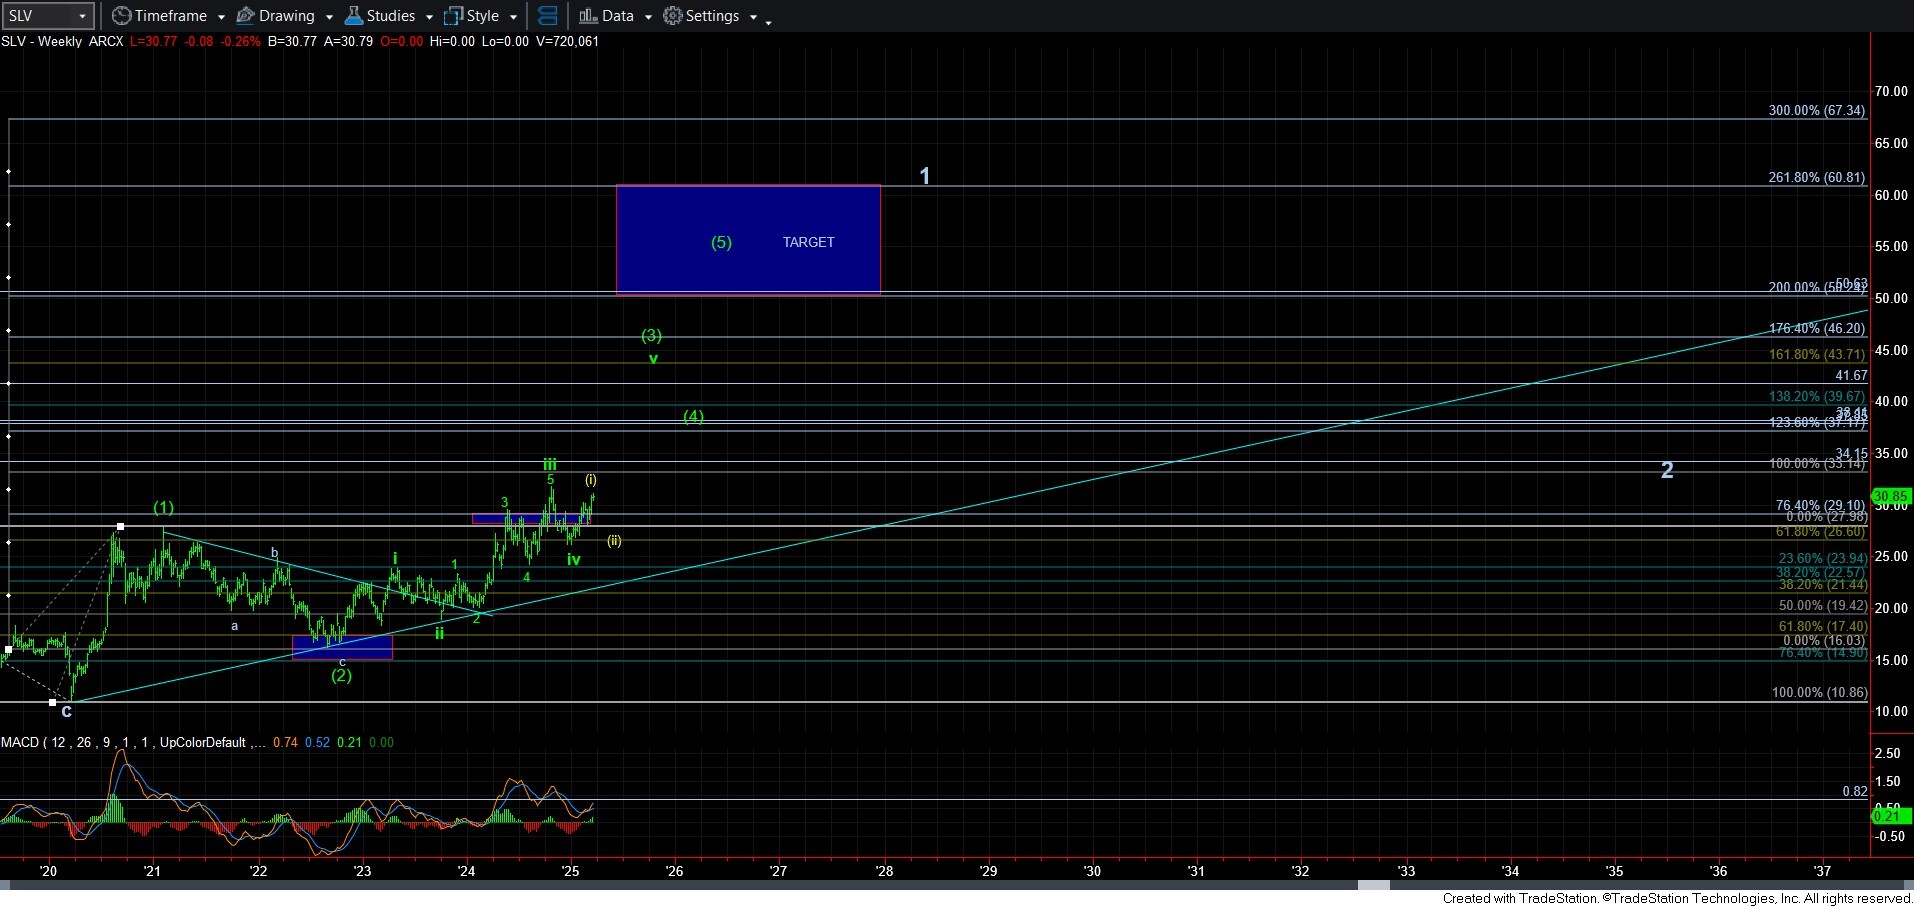
In fact, if we do break the 34 region on my SI chart, I may have to again consider a larger degree wave [ii], which I have now presented on the attached weekly SLV chart for illustrative purposes. So, yes, I am still expecting a major catch up move in silver, and it usually does happen during the last phase of the metals bull market, we may still have another pullback before we finally are able to hold a break out and see that parabolic rally that is usually seen towards the end of the metals bull market.
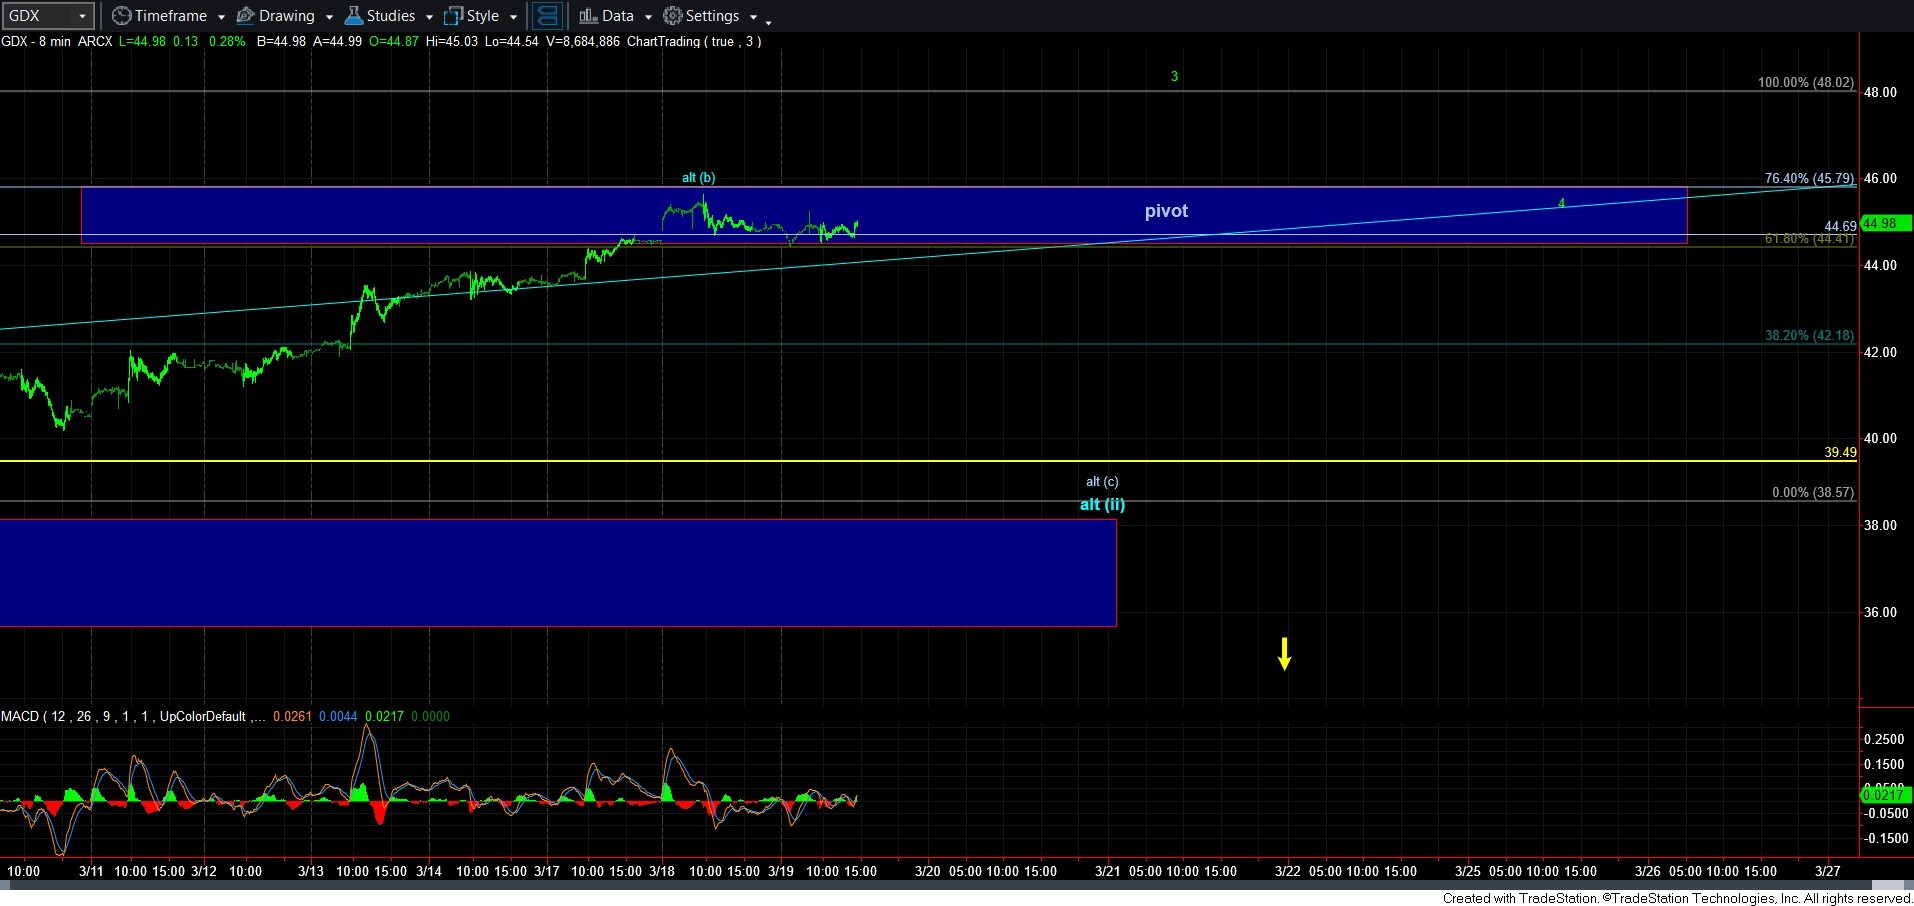
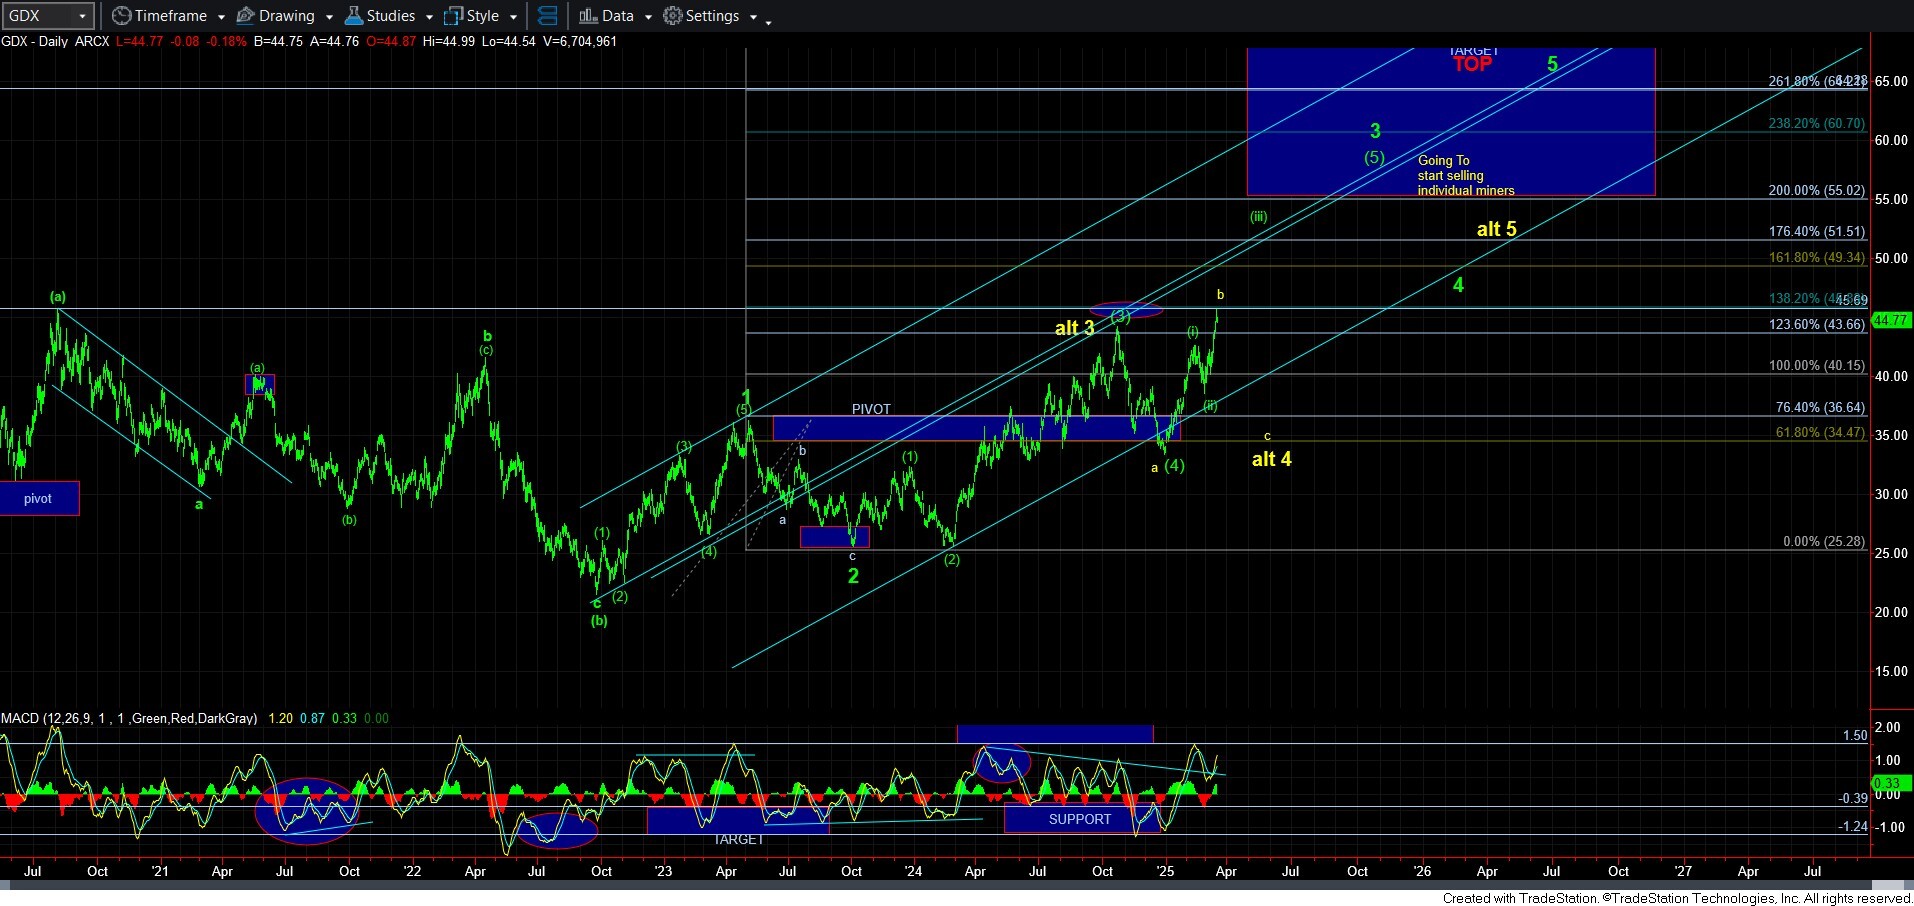
This now brings me to GDX, which is leaving way too many possibilities on the table as to how it can proceed. One point I made earlier today is we hitting out head on the highs we have last struck back in the summer of 2020. Should we see a break out here from these levels, we can see a strong continued move to the next major resistance region from prior years in the 55 region. But, from a Fibonacci Pinball perspective, the next resistance is the 48-51 region.
But, I must admit that it is also concerning that GDX has not taken advantage of this break out set up we have been tracking for some time now. And, should we fail to do so, I will be tracking both the blue count on the 8-minute chart, with the yellow count remaining in the background as an alternative at that time.
In summary, GLD has been a really amazing chart to follow for the most part for many years, and is giving us strong parameters going forward. And, it is approaching the point in time where we should begin to expect a larger degree pullback. Yet, both silver and GDX are in somewhat of no-man’s land at the moment. I would much prefer that they both begin to strongly stretch higher quite immediately. But, if that is not what we see, we may be in for yet another larger degree pullback before they do finally provide us with that catch-up move I am still expecting before this long-term bull market in metals comes to conclusion.