Getting The Jump On META's Rally
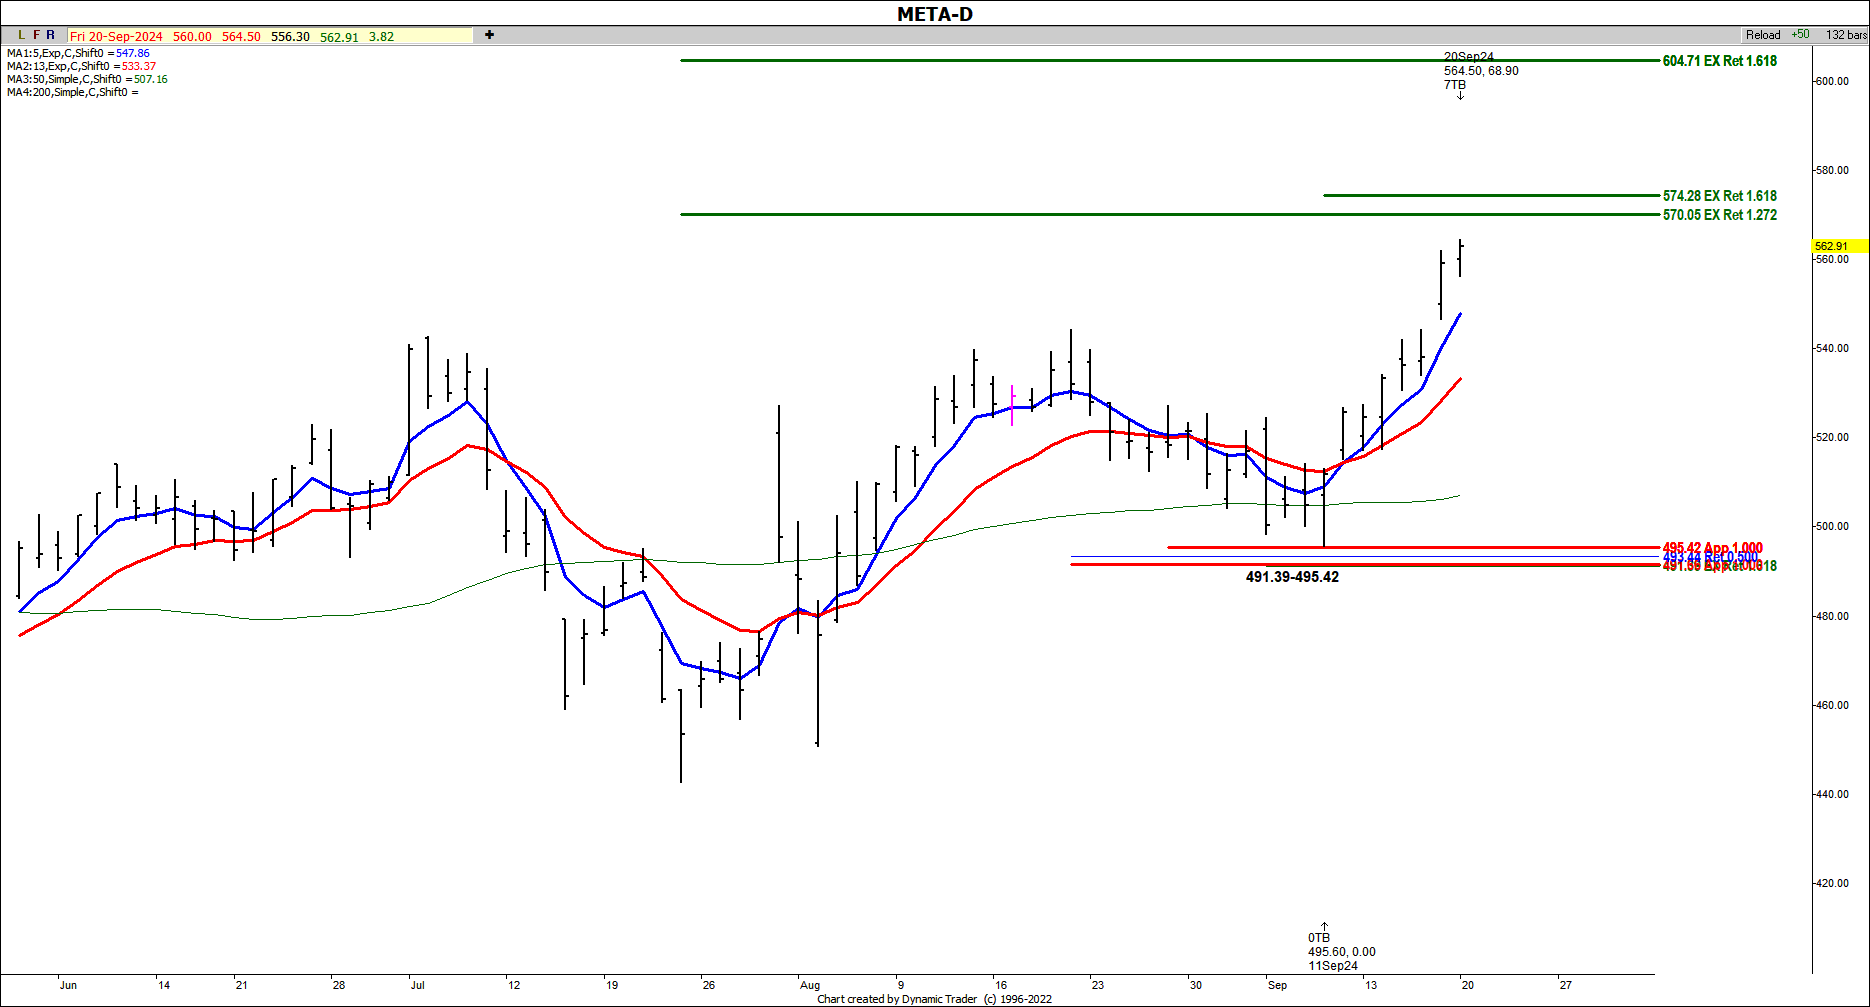
One of our main trade setups in the FMA service is called a Fibonacci Price cluster. This is the coincidence of at least three Fibonacci Price relationships that come together within a relatively tight range. The cluster will identify key support or resistance decisions on the chart.
In the META example we had a price cluster setup on the daily chart at the 491.39-495.42 area earlier in September. This cluster came in at the 491.39-495.42 area. META pulled back into this zone on 9/11 where a low was made at 495.60 on that day which was just 18 cents short of the price support zone (close enough).
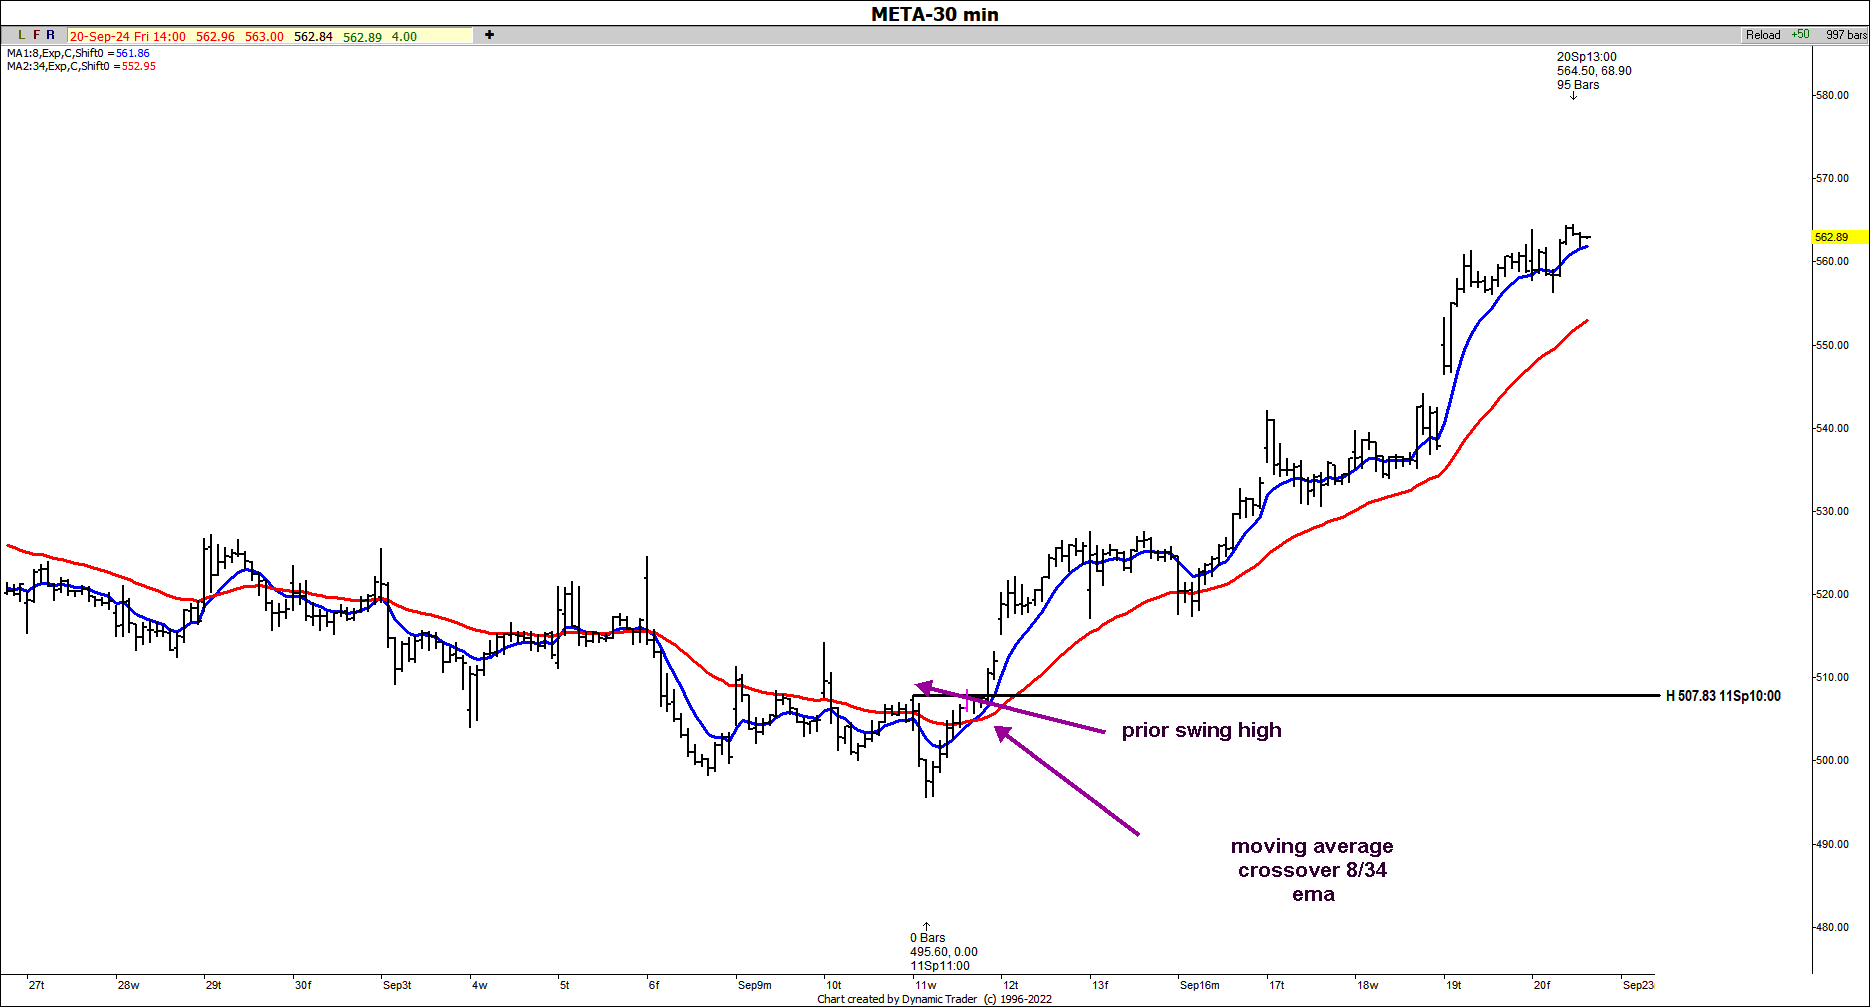
After hitting and holding above this zone, we finally saw a 30-minute buy trigger on 9/11 when the 507.83 high was cleared and the 8/34 ema combo crossed back to the upside. Since then we've seen a rally of 68.90 from the 9/11 low. The minimum upside target has now been met.
For those who are still long I would just ratchet up stops on those longs. We do still have higher upside targets on the daily chart here!! Remember the way to make money with this Fib work is SETUP + trigger = market entry and then you manage the trade!!


