Internals Not Supporting Price
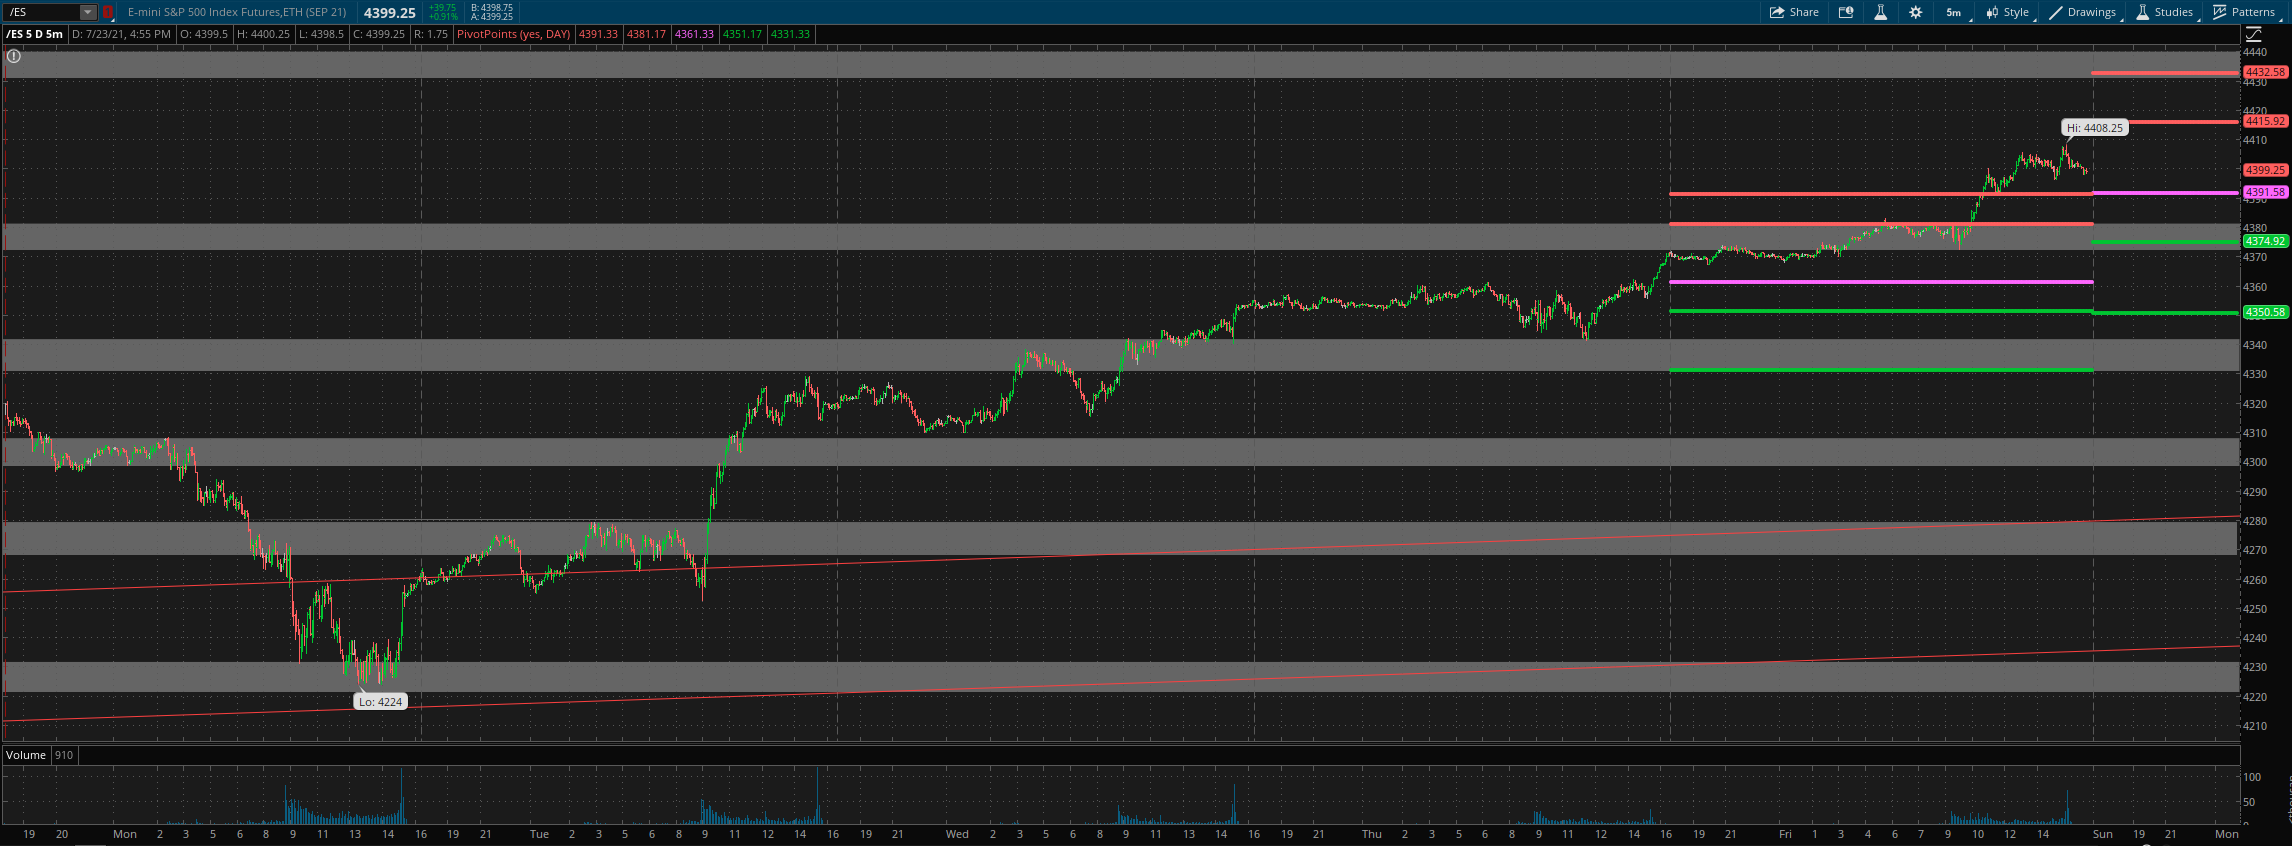
We noted last weekend that we were flat the market and waiting for more clues on what next as we watched for a possible bottom. Price indeed found a bottom at a much lower level on Monday, and then turned around and closed the week strong at the highs.
As for this week, options data is neutral on review today. Internals are very mildly bullish to neutral. Price action is short term bullish, medium term bullish and long term bullish.
All of our indicators are on buys right now except for the longer term core NYHL1M indicator. This one is signaling weakness coming into the market very soon -- on the bigger timeframe. Regardless, we got an A-Class buy signal on Monday last week where we went long with leverage and we have been riding those longs for the last 150 points. We will continue to do so until we get an opposing sell signal or an exit. The core NYHL1M indicator is just a warning sign for now and we need the shorter timeframes to align with it as well to exit longs and/or put on a short trade.
For the week ahead, I think we continue to grind higher for a bit more. We have several news events during the week which can act as catalysts -- so it is something to keep an eye out on. I am also on the lookout for a fresh sell signal developing sometime during the week. Internals do not really support where price is right now, and we have seen in the past that this type of posture usually results in price joining the weak internals on the downside. But, as usual, until we get actual sell signals on our trading system, we will continue holding the long trade.
Grey zone resistance is at 4431-40 and then in the 4470 area. Support is at 4380-4372, 4341-31 and at 4309-4300.
For Monday, daily pivot is at 4391.5. Resistance R1 is at 4416 and R2 at 4432.5. Support S1 is at 4375 and S2 at 4350.5.
All the best to your trading week ahead.


