JP Morgan Chase: Lackluster And Risks Are Rising
 By
Levi
By
Levi
By Levi at Elliott Wave Trader; Produced with Avi Gilburt
When it comes to analysis, both fundamental and what many would consider ‘technical’, we are gifted with a deep bench of talent. We will share a summation of this research and findings in this article. For a much more comprehensive view, we would encourage you to delve into all of the reports that are available to those with the time and inclination to do so. For our purposes at the moment we will briefly discuss valuation and take a look at the possible rising risks for this stock (JPM) and others like it.
The Valuation View With Lyn Alden
“I have a lackluster view toward JPM at the current time. It's large, safe, and not particularly expensive relative to earnings, which is good. There are worse things that someone could do with their money than invest in JPM.
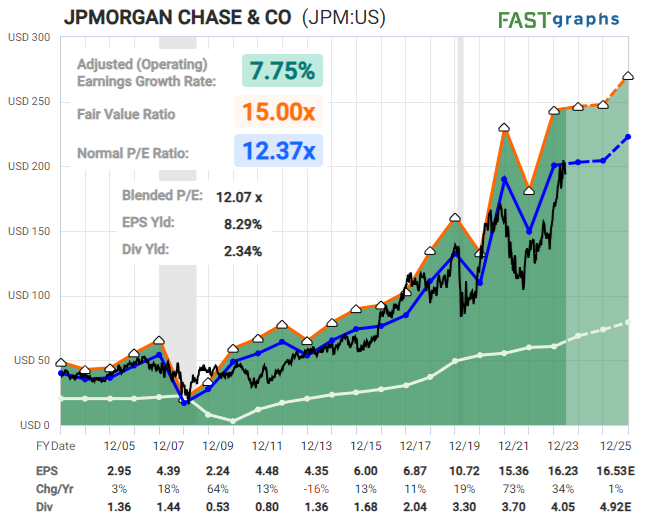
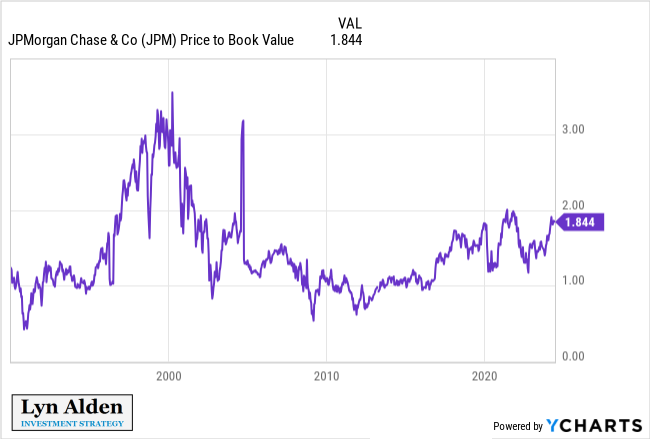
But due to so many concerns around bank health, the market is rather crowded into JPM relative to other banks. They've driven the price/book ratio of JPM up to over 1.8x whereas other good banks are trading at sub 1x price/book ratios. It's near the top end of its price/book valuation range over the past two decades. Only around the ‘dotcom’ bubble more than two decades ago did it sustainable break over 2x price/book.
If the economy and banking system surprise to the upside, then there's a good case that capital will want to invest in the cheaper banks that are perceived as riskier, since their peak risk time will be behind them.
On the other hand, if the economy and banking system surprise to the downside, then even banks like JPM will likely run into earnings stagnation due to loan losses. So it's not a particularly compelling long or short in my view on a fundamental basis.” - Lyn Alden
A Much Deeper Dive Into The Underlying Fundamentals
The following is a brief excerpt from Safer Banking Research:
“We have written quite extensively over the last several years as to why it's a huge misunderstanding to believe that the largest U.S. banks will be the safer than smaller banks in a systemic crisis scenario. If you look at the data published by various banking regulators, you’ll see that larger banks have much bigger risks than their smaller peers. Yet, for some reason, such data is often ignored by financial media, research agencies, and even independent analysts.
We’d like to remind you of some of those issues that we have been discussing in our banking work for more than two years.
Three Top-10 banks control almost 50% of total outstanding credit card loans: JPMorgan (JPM) ($181B), Citi (C) ($165B), and Capital One (COF) ($142B).
In our previous article, we discussed the recent data published by the Fed. Moreover, asset quality metrics in this lending segment have deteriorated even further in the first quarter of 2024. There was a huge increase in the transition to delinquency ratio among borrowers with a 90–100% utilization rate and also quite a remarkable increase among borrowers with a 60–90% utilization rate. This implies that low-income borrowers are already in a very difficult financial situation, which looks worrisome given the reasons that led to the GFC back in 2008.”
(Saferbankingresearch.com, is a combination of efforts between Avi Gilburt and Renaissance Research, which has been covering U.S., European, LatAm, and CEEMEA banking stocks for more than 15 years.)
What Picture Does The Structure Of Price Paint?
Let’s also take a look at what the charts are telling us here.
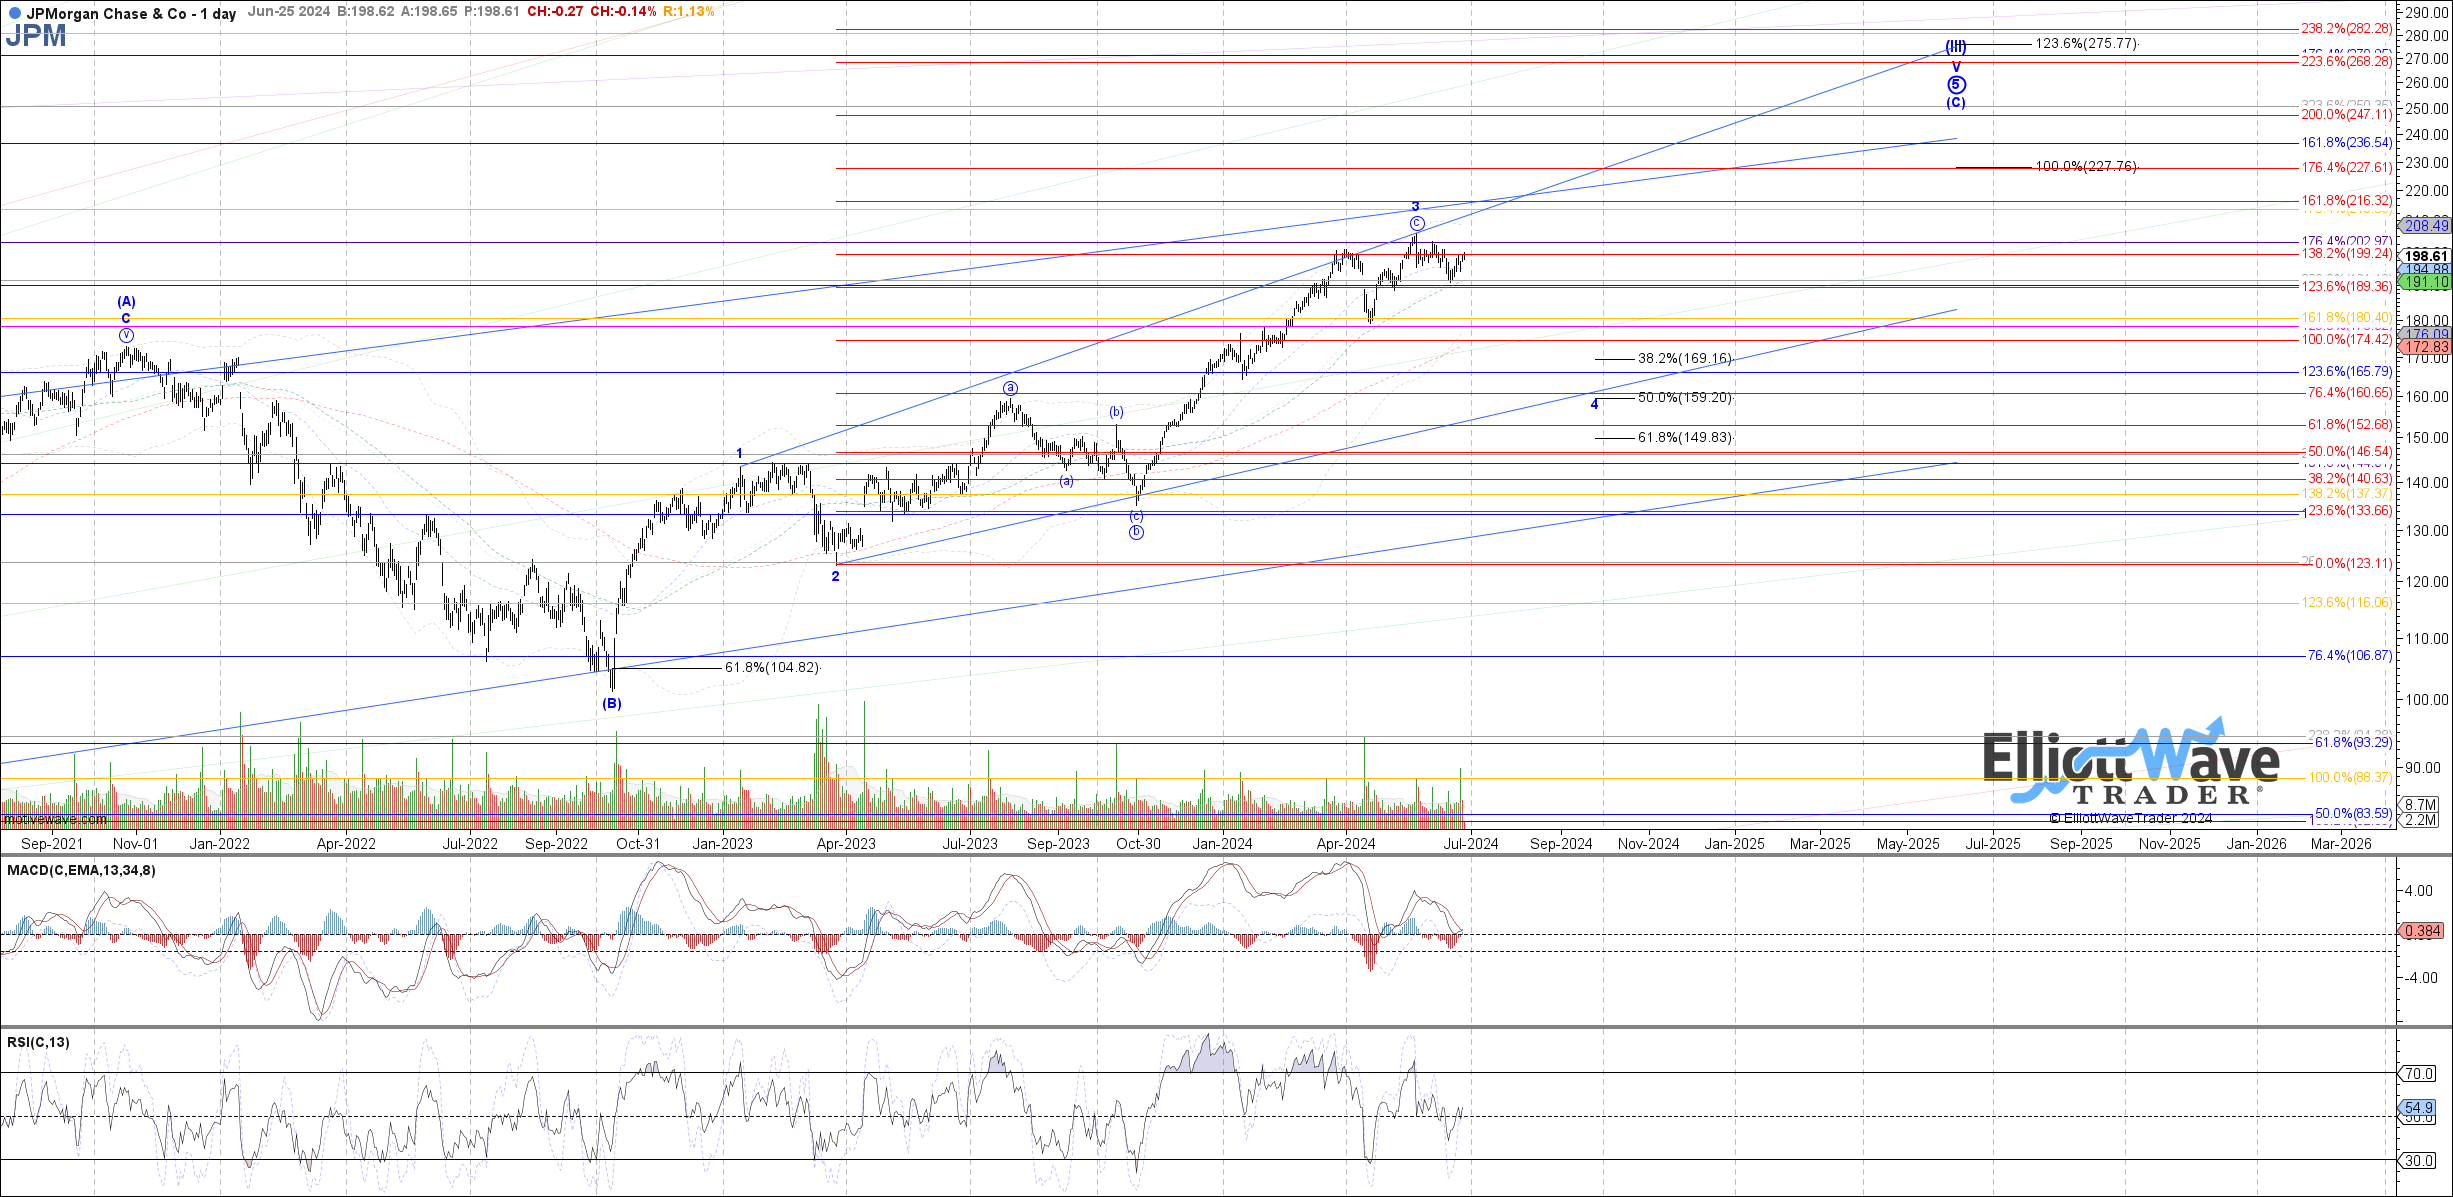
We are not outright immediately bearish the chart. Really? After all the talk regarding “lackluster” and “rising risks”? Well, here’s why. There is no clear sell setup at the moment. However, there is a structure that shows a likely pullback into the end of this year.
What really stands out is at the upper right corner of Garrett’s chart shared above. Note the big blue stack of symbols. What is this nomenclature? It shows the user that the high struck in that area is very likely quite significant in the bigger picture. There will be a completion of several degrees of the structure. Afterward, a prolonged pullback will take hold.
Along the way there will be opportunities for swing trading in and out of the larger structure. We will continually update for members and as able to the readership here.
It is possible that price climbs a bit higher in the near term and it would be considered an extension of the current wave ‘3’ of the larger [C] wave of an even larger Primary 5th. And, you can also see the [III] above that, yes? It is this macro structure that is telling us that (JPM) will likely strike a multi-year high in the weeks or months to come.
Meanwhile, we will closely monitor support levels in the anticipated pullback forthcoming.
Why Don’t More People Use Elliott Wave Analysis?
Have you ever asked this? Avi Gilburt penned a response to this very topic. Here is a brief excerpt from that article (this piece is available in its entirety in our Education section).
“First, many may not know this, but there are quite a few ‘name' investors who do use Elliott Wave analysis in their decision making. One of the most popular is Paul Tudor Jones of Tudor Investment Corporation. Jones was quoted as saying:
"I attribute a lot of my success to Elliot Wave Theory. It allows one to create incredibly favorable risk reward opportunities”.
“Let’s start with the understanding that it takes a lot of detailed work and calculation in order to perform a proper Elliott Wave analysis. Moreover, it is a very complicated method to learn. So, the entry into this methodology is not easy and to perform a proper analysis is not easy. But, then, show me anything that is truly worthwhile that does not require an initial investment and hard work.
To this end, most of what I see being claimed as Elliott Wave analysis is nothing more than what I call ‘wave slapping’. This is when an analyst places numbers and letters on a chart based either upon the ‘look’ of the chart, or to support their prior bias about market direction. Since I would classify most analysis presented as Elliott Wave analysis as such, resultantly, most analysis is rarely correct more than 50% of the time. And, this lends to the argument about Elliott Wave being too subjective in nature.
So, when investors follow this type of ‘analysis’ and see how often it is wrong, they make the assumption that Elliott Wave really does not work, and are turned off.” - Avi Gilburt
Conclusion
In addition to the articles provided to the readership here, we have an extensive Education library available at Elliott Wave Trader. As well, we want to teach others this methodology. Three times a week we have beginner and intermediate-level videos where we show the exact way we count the waves and give in-depth analysis techniques. This methodology, if you give it the chance, will change the way you invest forever. More on that can be found here.
There are many ways to analyze and track stocks and the market they form. Some are more consistent than others. For us, this method has proved the most reliable and keeps us on the right side of the trade much more often than not. Nothing is perfect in this world, but for those looking to open their eyes to a new universe of trading and investing, why not consider studying this further? It may just be one of the most illuminating projects you undertake.
