Kamala Wins by a Market Crash?
This is *not* a political article. Please don’t make it that. This is a review of some very odd projections surrounding the current election that are based on the analysis of social mood, presidential election odds, and the stock market. I have been watching with some confusion, published odds favoring Trump in spite of what I thought I knew about rising markets favoring incumbent parties. I just finished watching a video from the Socionomics Institute which clarified this somewhat. Their research showed that it was only when the sitting president ran that there was a solid correlation between the incumbent’s party winning or losing and stock market performance. They also noted an odd inverse relationship between the market and a sitting vice president’s performance. They chalked up this oddity to likely reflecting an insufficient sample size of only eight sitting vice presidents ever running. I’m writing this article today, because what I’ve been watching supports this odd inverse relationship, and as I will explain, I’m seeing Trump winning by a landslide unless there is an upcoming near-catastrophic market crash.
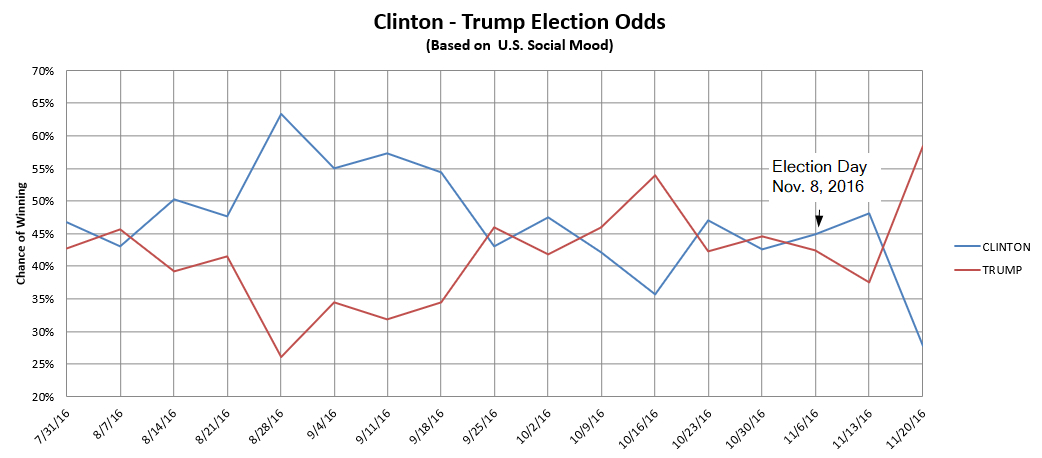
Back in the days leading up to the 2016 election between Clinton and Trump, I came up with a model that was well tracking poll data and published betting election odds. The source data was the exact same U.S. social mood data used for daily and weekly stock market projections by the MarketMood Indicator algorithm. As you can see in the chart below, it correctly had the two candidates nearly tied in the weeks leading up to the election. While it showed Clinton winning (barely) on election day, she did win the popular vote, but Trump won where it counted with the electoral votes. Interestingly, if the election were held just a few weeks later, per this chart, Trump would have won by a landslide.
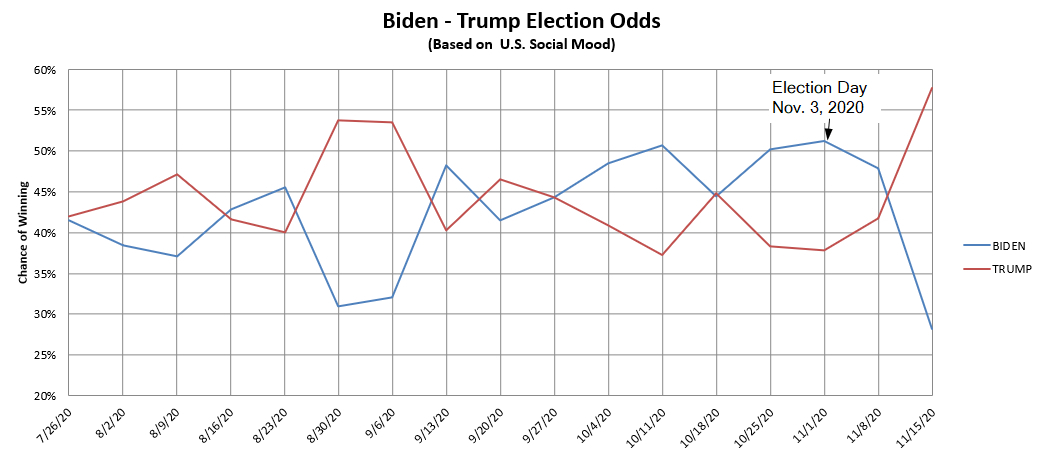
Just for fun, I continued watching this chart as the days went by and presidential popularity waxed and waned. I haven’t recalibrated it for future elections but watched it with unaltered parameters as Trump and Biden battled it out. It just so happened that the 2020 election day was concurrent with the peak of Biden’s popularity. And regardless of your beliefs on the matter, per the official records, he won that election. Once again, it seems that timing was pivotal as Trump, per the chart, would have won by a landslide if election day was just a couple of weeks later.
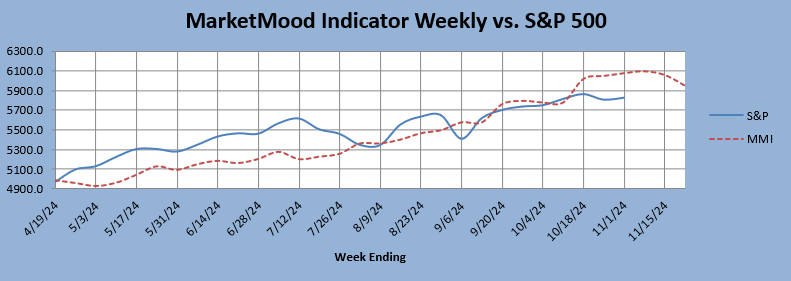
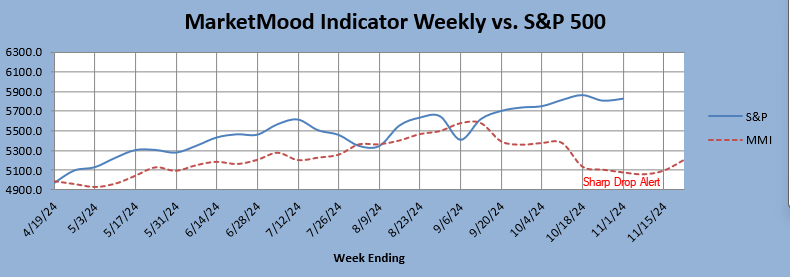
As we approach the current election, the situation is very different. It’s not about timing at all. Instead, it depends on whether social mood is currently in an inverted relationship with the stock market (as happens from time to time) or not. The weekly MarketMood Indicator algorithm is currently showing the chart below as its preferred market projection. This is based on the assumption that social mood is and has been in an inverted relationship with the stock market since mid-September. The alternative chart, which is currently viewed as far less likely, includes a cautionary “Sharp Drop Alert” and an elevated risk of a near-catastrophic market crash by November 18. These two charts are shown below:
Base case MarketMood Indicator vs. S&P 500:
Alt case MarketMood Indicator vs S&P 500:
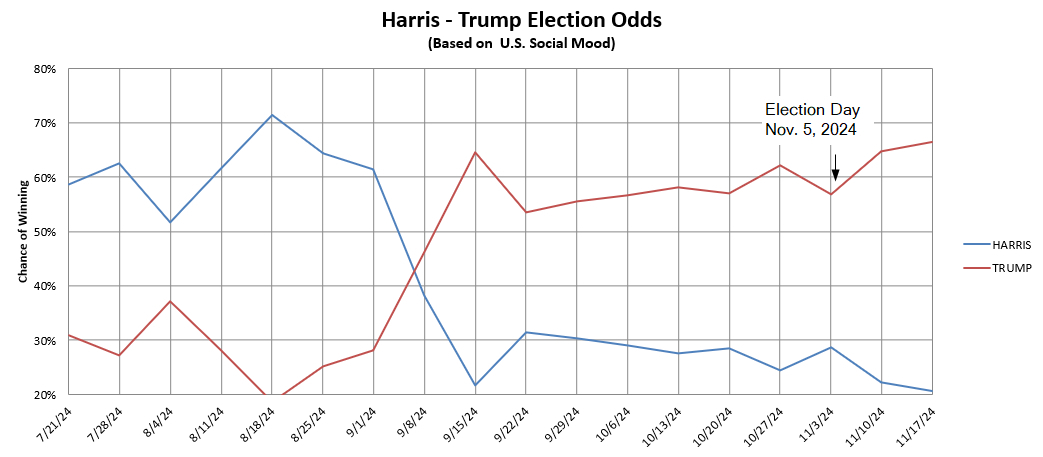
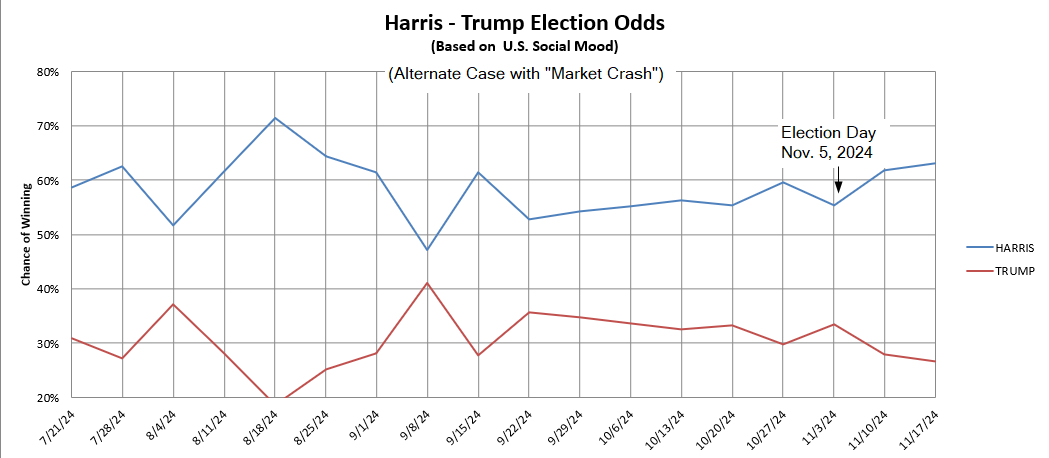
For the base case, the election model shows Trump winning by a landslide. In the alternative case, the one in which there is an elevated risk of a market crash event by November 18, Harris is shown as the clear winner. In either case, the results are not close. It’s one or the other. There is also no big shift right after election day such as there was in the previous two elections. It’s also interesting that the market event, should there be one, could occur after the election as far as the MarketMood Indicator and these social mood derived presidential election charts are concerned.
Base case of mostly bullish market, Trump wins:
Alt case with risk of "market event," Kamala wins:
I wasn’t going to publish this, but after seeing that video by the Socionomics Institute which supported the data I was looking at, I had to. It’s my hope that this doesn’t result in degenerative commenting that forces the article to be taken down.

