Kraft Heinz: Hold The Mustard
By Levi at Elliott Wave Trader; Produced with Avi Gilburt
There is a certain mutability of the markets that exists and must be recognized. What we view as possible will shift and even morph as a structure fills out on a chart. Now, this is not to mean that we simply place a new count onto this structure as it changes to suit our fancy and then we are always right.
No, in fact, there will be moments where our primary expectations must be adjusted and can even change polarities. Yes, we view the markets through a probabilistic lens. The majority of the time, this application of standards will lead us to the correct outcome. But, projections are not prophecies and must adapt to what is given on the chart.
Herein we share the anatomy of a shift in opinion regarding Kraft Heinz (KHC). We recently had a bullish setup that has now invalidated. In fact, it has turned into a neutral setup. What’s interesting here though is that it still retains the possibility of a bullish setup over time. So, let’s discuss what was seen that initially gave it the bullish lean, what has now turned us neutral, and then to conclude, what would would make the structure lean back bullish once again.
First, The Fundamentals With Lyn Alden
One of the great advantages of being in StockWaves is access to world-class analysis from both the fundamental and what some would refer to as “technicals”. It’s much more, but for this article let’s call it ‘where fundamentals meet technicals’. Lyn Alden is widely known as a premier analyst in her field. We recently queried her regarding KHC. Let’s take a listen:
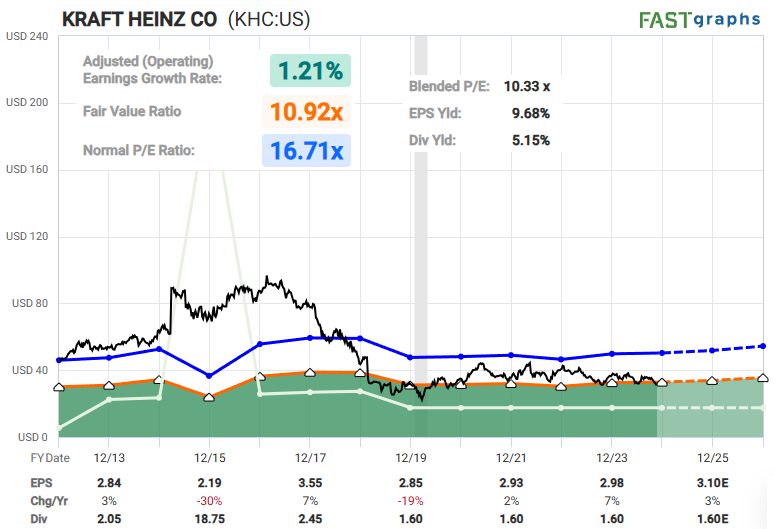
“From a fundamental perspective, KHC isn't particularly compelling. It's inexpensive and has a high dividend yield, but little growth to speak of, and so it competes mainly with Treasury bonds.
They have a net debt to net income ratio of over 10x, meaning that their total debt levels (after cash is factored out) is worth more than ten years of net income. However, that income is pretty steady, so their credit rating is mid-level at BBB.
Basically, I would view this as either a catalyst story or a technicals story. If there is some catalyst that shakes things up, then it could become interesting. Otherwise I think it's choppy and mostly trading around on sentiment and around minor positive or negative revisions to fundamental expectations.” - Lyn Alden
Lyn regularly provides us with keen insights. For those familiar with these articles shared with the readership, you will likely note that many of the key phrases and conclusions that she writes about will end up as a pivotal point of our pieces. That is the case here as well. Let’s now take a look at what the structure of price on the chart is telling us.
Zac Mannes Shows Us How Sentiment Speaks
Sentiment is funny bird. It can go from the depths of despair to near rhapsodic euphoria. However, for those correctly trained, this can serve as an edge in their trading and investing. We will not always get this right every time. Now, don’t shy away from this methodology just because of that.
Take note of two key calls that Zac has recently shared with the readership regarding bullish (TSLA) here and bearish (AMD) here. Both went against conventional wisdom at the time and both turned out to near exact as sentiment was painting the numbers for us. TSLA is +56% from the publication of the article and AMD is -15% from the day its piece was shared with readers. That’s no accident. It is sentiment in action.
Well, let’s look at one setup that did not materialize in (KHC).
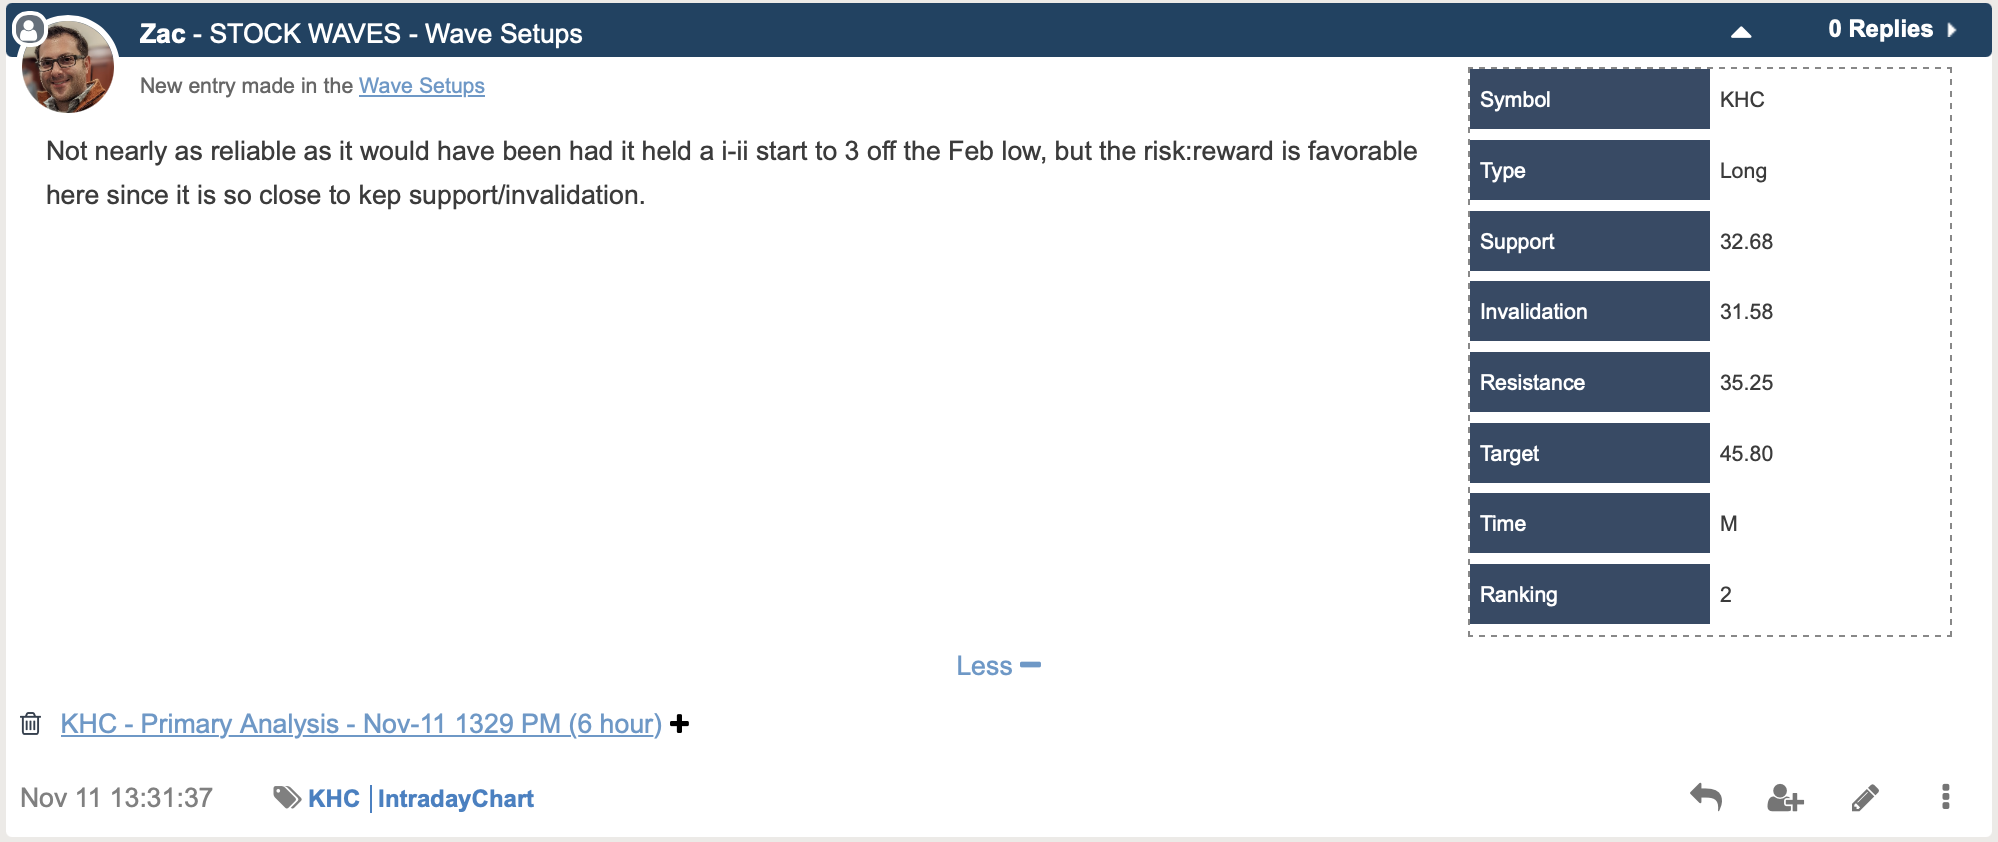
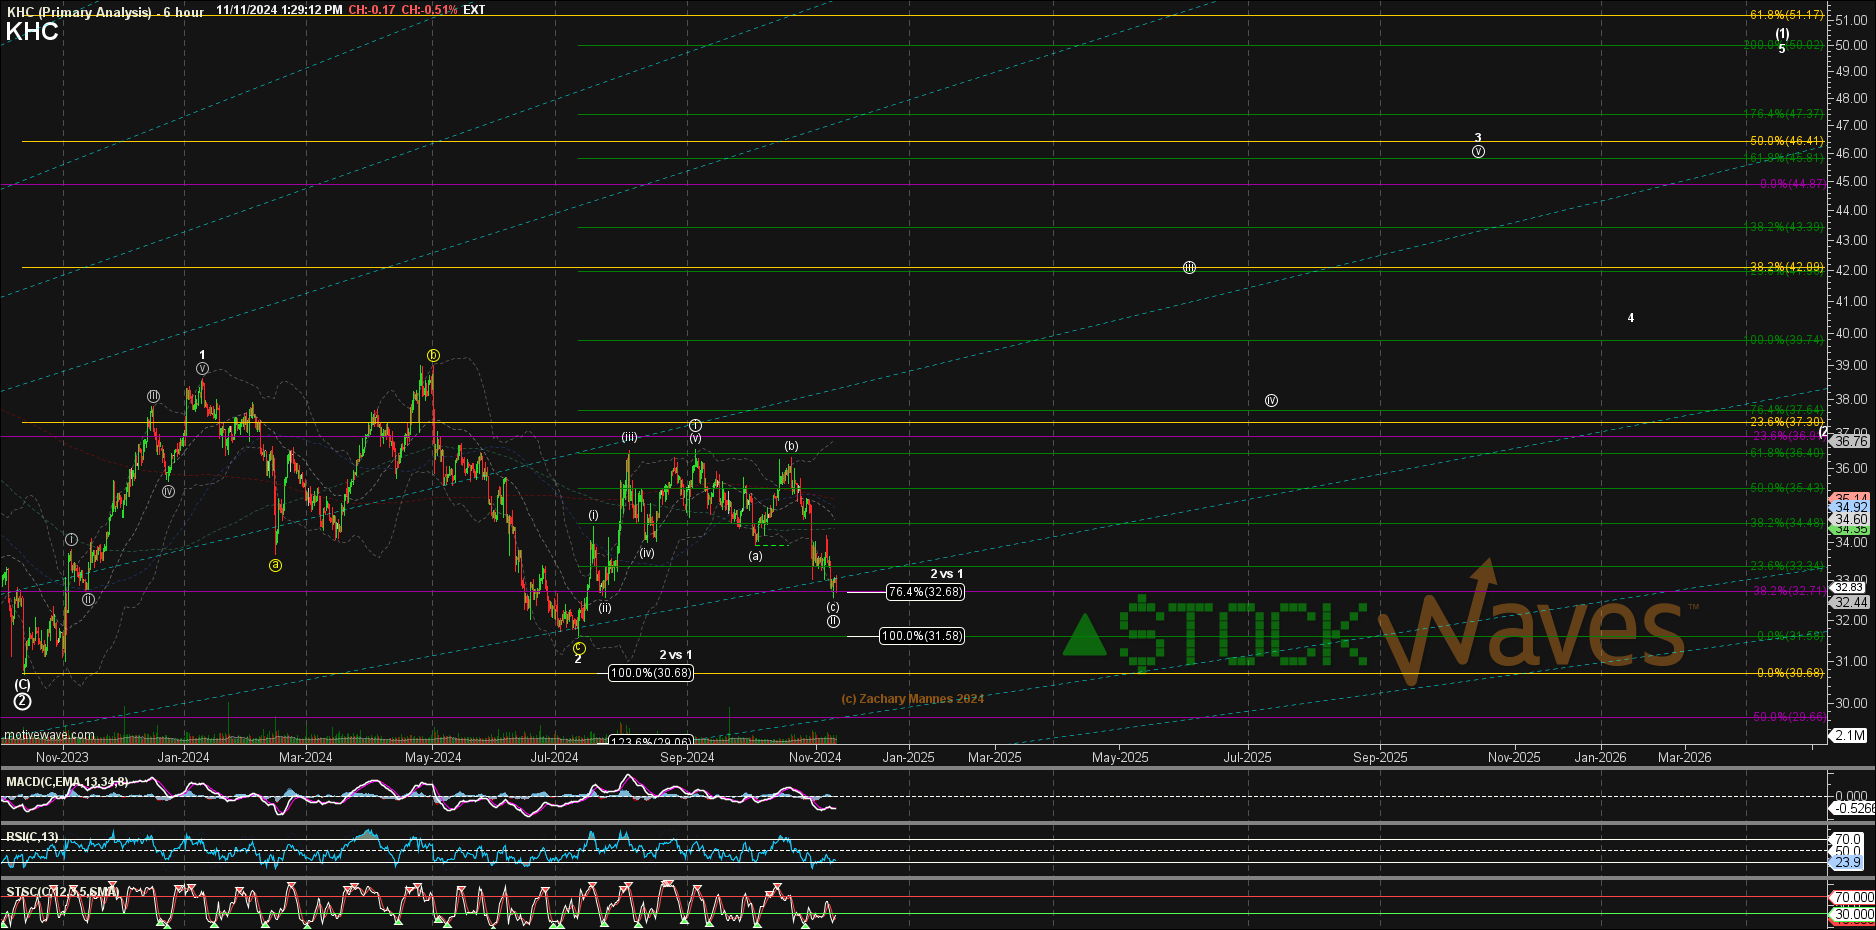
You can see from the table and chart that was shared with members on November 11 that there was a bullish setup. But, this did not come to fruition. And, it has in fact invalidated. So, anyone that would have taken that setup may have stopped out. We will still track and monitor how the chart fills out though. What would we need to see to turn bullish once more? 
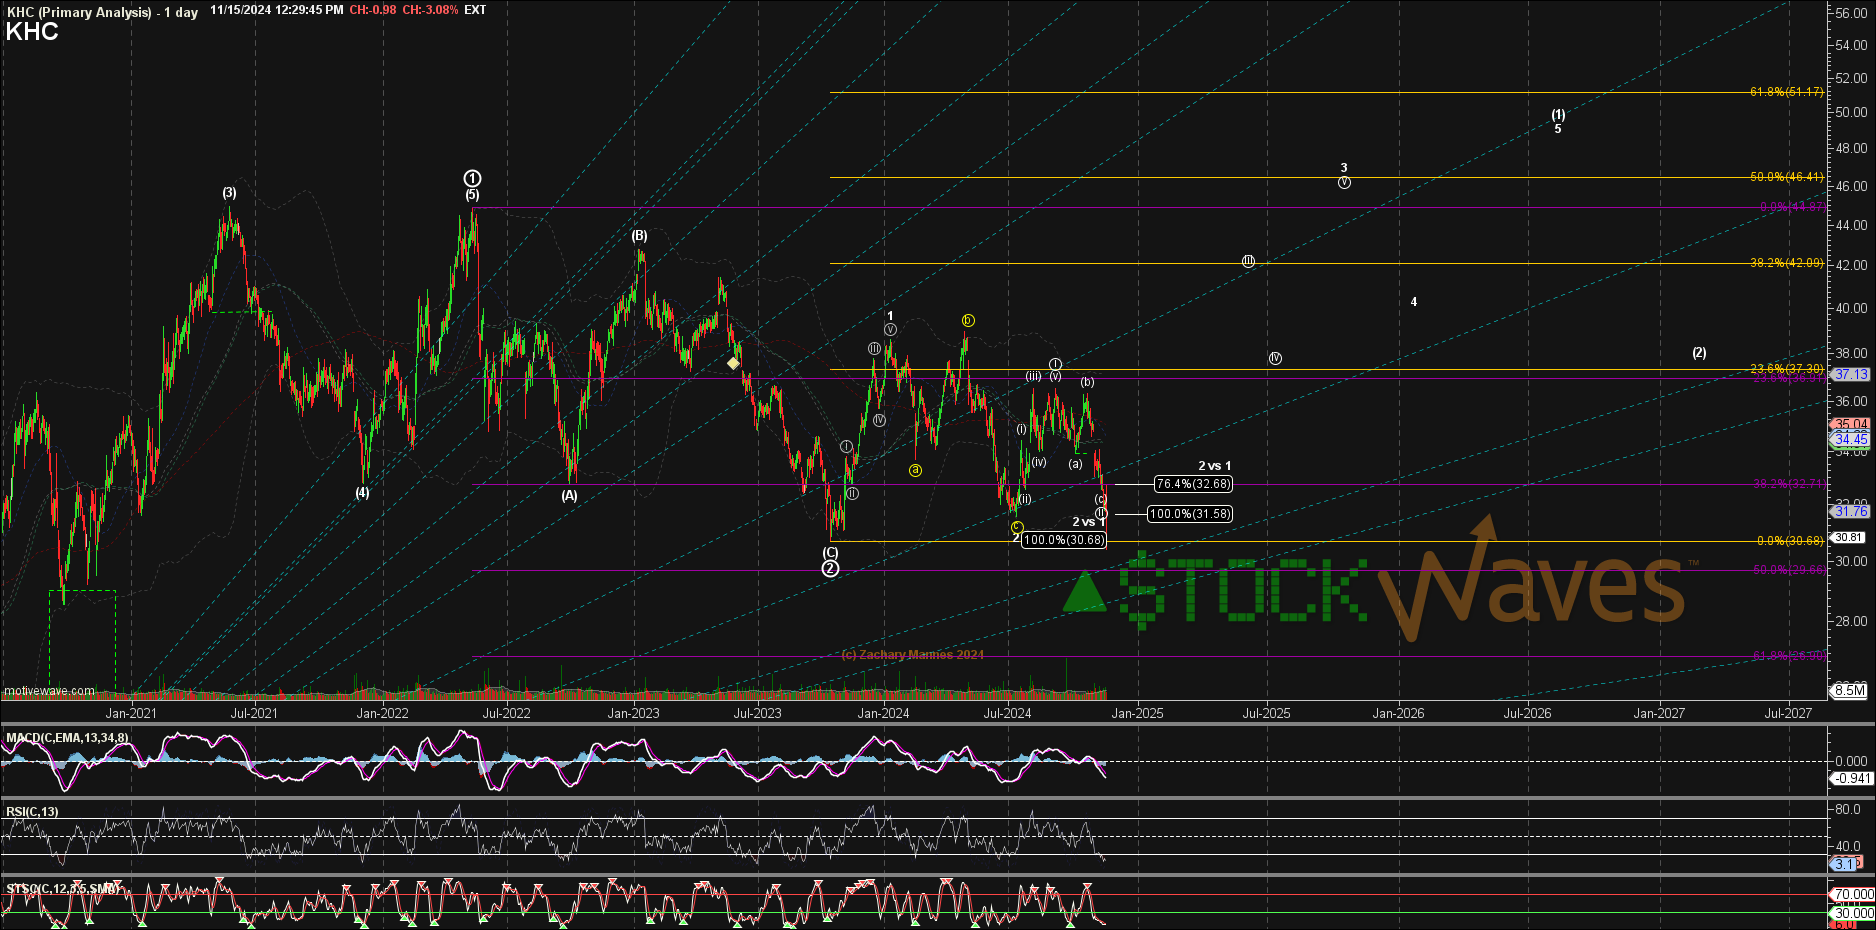
In Zac’s own words, here it is: “Ideal support for the immediate bullish case was broken on 10/30 with the break of the earlier Oct low...and recently off 32 there was a very favorable Risk:Reward setup with a narrow window, but this drop now easily forces an extension of the Primary wave 2 further under 30.”
Zac and I discussed this chart this week. It would appear to show key near term support in the $29 to $29.50 area. There are a few possibilities here. But, a main takeaway would be that if price can form a micro 5 waves up from the $29 area, then a corrective pullback would setup a higher probability swing trade scenario with a stop at or just below the low struck.
For the moment we must maintain a neutral stance regarding KHC stock. Yes, a bullish scenario is out there and we also have clear parameters for what that may look like.
Do You Have A System In Place?
Those who have experience forged by time in the markets will tell you that it's imperative to have a system of sorts in place. You need to be able to define how much you are willing to risk vs. how much gain is likely. Those who survive across the decades in the greatest game on earth will also inform you that the preservation of capital is paramount.
While there are multiple manners of doing this, we have found Fibonacci Pinball to be a tool of immense utility for traders and investors alike.
Conclusion
There are many ways to analyze and track stocks and the market they form. Some are more consistent than others. For us, this method has proved the most reliable and keeps us on the right side of the trade much more often than not. Nothing is perfect in this world, but for those looking to open their eyes to a new universe of trading and investing, why not consider studying this further? It may just be one of the most illuminating projects you undertake.


