Looking For A Spark: Newmont Corporation (Technical Analysis)
Contributed by Mark Malinowski, produced with Avi Gilburt.
Introduction
Precious metals and precious metals miners are on the cusp of a run. I won’t attempt to predict the future, using a crystal ball. Nor will I ever guarantee that there will be one more low or not. There is no confirmation that the next rally phase, which permabulls have been predicting over the last two years, has already started.
What I can say is that sentiment appears ripe. Just like a room filled with gas to the right ratio of fuel and air looking for a spark in your favorite action movie, I feel like now is the time.
While many who are watching this sector feel like all it does is spin its wheels, there are times when this sector outperforms absolutely everything followed by extended periods of grinding sideways and down. Permabulls are often overheard saying, “We are going to rally really hard because of x, y and z.” I don’t say or use the words “big rally potential” lightly.
What tangible things do I see that make me feel this way?
First, the ratio of the miners to the price of gold has gotten to a significant extreme. When I look at the charts, some of the largest market capitalization miners are not being rewarded for the increased value of their assets in the ground or what they are getting paid for selling what they have mined.
If you look at a chart of the price of gold and the price of a basket of top market-cap miners over the last 10 years, you begin to see a stark contrast. You see that those companies have been progressively pushed down further and further, while the price of gold moved sideways and then progressively up since September 2022. In fact, the ratio has only been this low on two other occasions in the last 10 years. The first was in January 2016 and second was in March 2020.
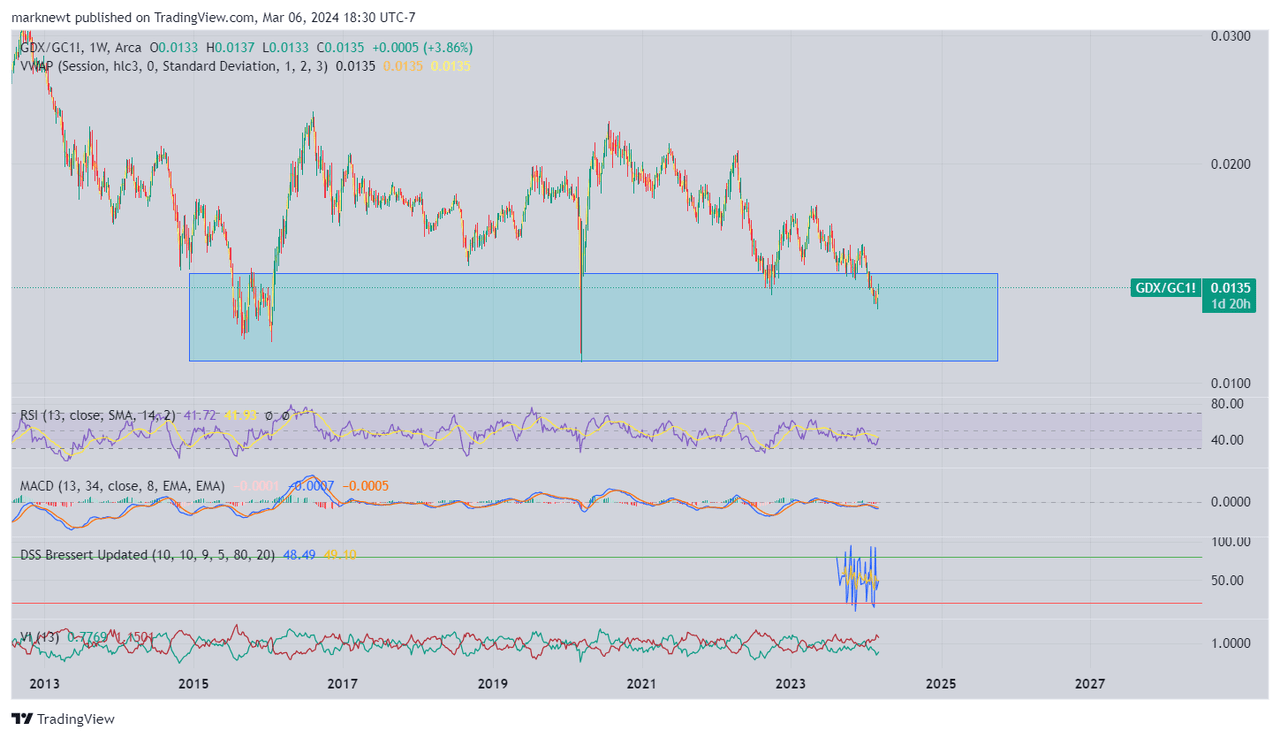
GDX : GLD Ratio (TradingView)
But comparing Newmont Corporation (NYSE:NEM) to GLD, the contrast is even more startling.
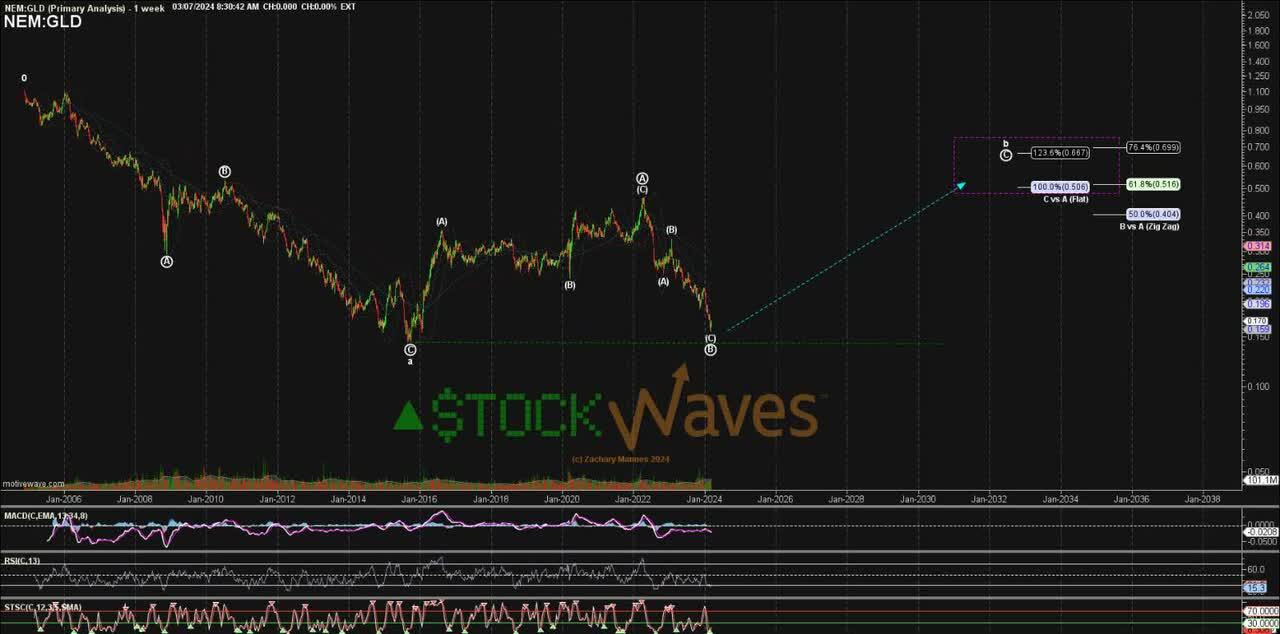
NEM : GLD Ratio (wkly) (EWT)
Second, miners have had cost increases with inflation, including the cost of labor, but the price of energy has actually moved sideways over the last 1.5 years. The best miners have continued to manage their All In Sustaining Costs (AISC) over this time and actually have had their margins increase significantly.
Third, I am looking at external factors like bond rates and the USD against the world basket of currencies, also known as the US Dollar Index (DXY). I am not someone who believes in correlations, but I do look for things to line up “in phase.” Lower real interest rates along with depreciation in the value of the US dollar could contribute significantly to a rally.
We are going to look at a stock that’s the largest component of the VanEck Gold Miners ETF (GDX) -- and also one of the worst performing miners over the past two years – and see why I think we are due for a rally.
Who is this company?
Newmont Corporation
Newmont Corporation is the largest component of the GDX, sitting at a modest 8%. Newmont produced 5.5 Moz of gold in 2023 (plus 891k gold equivalent oz in copper, silver, lead, and molybdenum). They did this massive volume at an AISC of $1444/ oz. They have a future target of 8.3 M gold equivalent oz produced in 2028. This is massive compared with all companies outside of Barrick Gold. They also returned to positive net cash flow this year, while acquiring a tier 1 miner, Newcrest Mining.
While GDX has had what feels like a grinding pattern sideways over the last 1.5 years, Newmont had a peak in price, a quick sharp correction, and a slow grind down. This has been the anchor weighing down GDX. It is hard for a sector to rally when the largest component keeps leaking lower. Newmont has been under-performing over the last couple of years with operational issues at some facilities and strikes at others. But has anything changed?
Three major things have changed.
First, existing operational issues seem to be behind them. The Peñasquito Mining strike was resolved at the end of the company's Q3, bringing the site back into operation. There was a return to positive net income through various operational improvements across all sites. The company is forecasting this to be peak AISC, with a steady decline over the next 5 years. According to their January 2024 investor presentation, their capital spend is forecast to be flat as multiple new assets are coming online.
Secondly, the acquisition of the Australian-based Newcrest Mining results in more Tier 1 operations, in preferred jurisdictions. In other words, more Canadian and Australian based operations and developing projects. These new assets will reduce the overall company AISC. Newcrest had a much lower AISC prior to acquisition, and this will increase the overall profit margin of Newmont.
Finally, the continued increases in gold, silver and copper further improve the profit margins of this company. Four to six months after the peak of Newmont in April 2022, the prices of gold, silver and copper bottomed and began moving sideways and up. While gold is ~9% higher, copper is down ~18% and silver is down ~5%, while Newmont is down ~60% from that high.
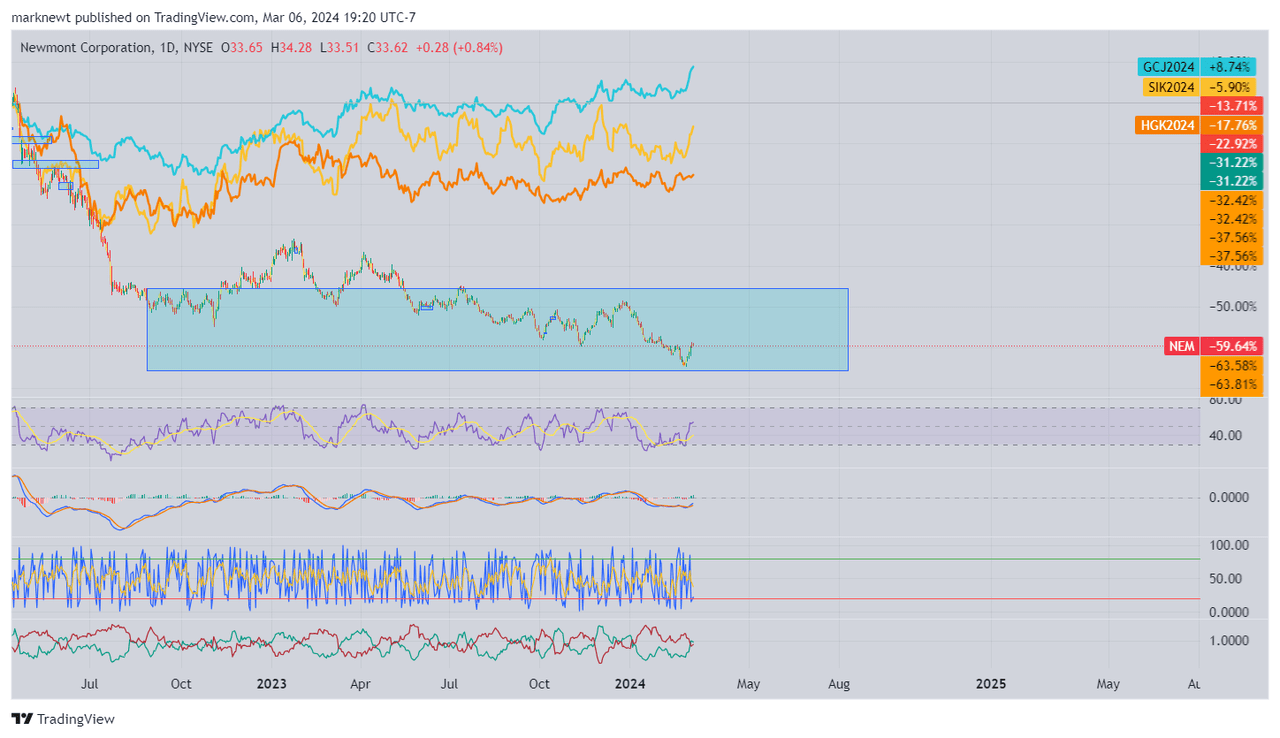
NEM chart w/ Gold, Silver, & Copper overlays (TradingView)
Technical EWT View of Newmont
Avi Gilburt posted on April 11, 2022, that he planned on beginning to harvest profits on his shares in NEM, as he viewed an important top coming soon.
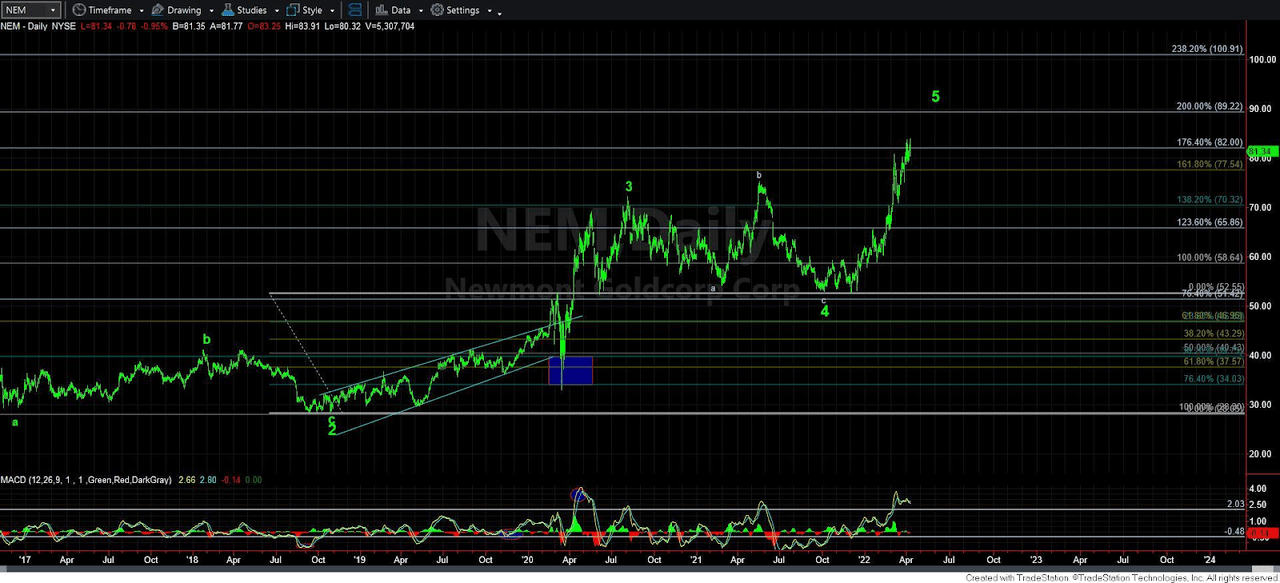
Avi's NEM chart from April 2022 (EWT)
Those who followed him on this trade entry in 2016 did very well indeed. Avi has posted many times since the April 2022 exit, but his overall decline target has remained unchanged. Recently, on February 9, 2024, he noted that a bottom was near. Garrett Patten, a senior EWT analyst, noted on February 13th that his big picture target of 29 to 30 was approaching rapidly, but allowing for a possible smaller degree bounce first into that low.
Heading into earnings on February 21, Zac Mannes, our lead analyst and co-host of the Metals, Miners & Agriculture service with Garrett, highlighted the potential for just One More Low to complete the pattern for the c-wave inside the 5th off the December bounce for 4.
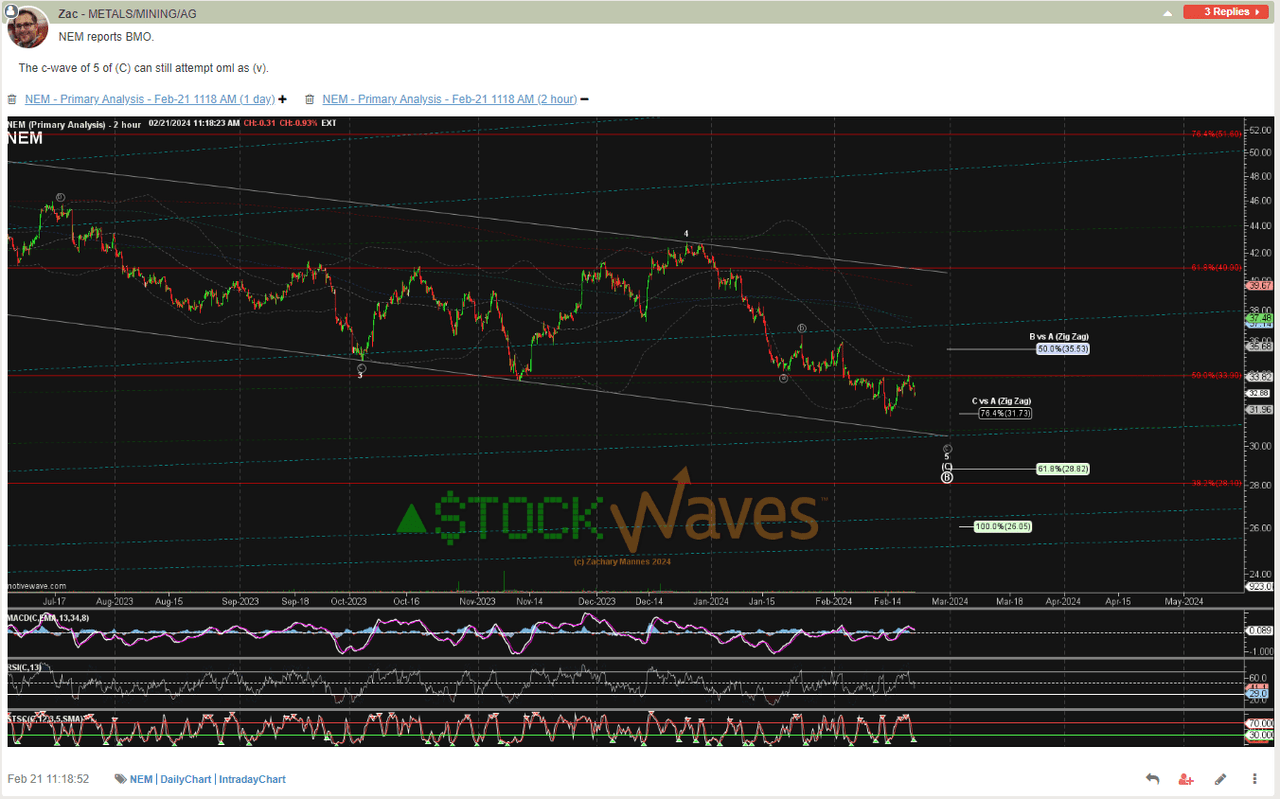
Zac's NEM chart preEarnings 2/21/24 (EWT)
On February 28 NEM stretched a little lower in the drop, post earnings report, dipping into the 29s and then started to show some hints at a reversal.
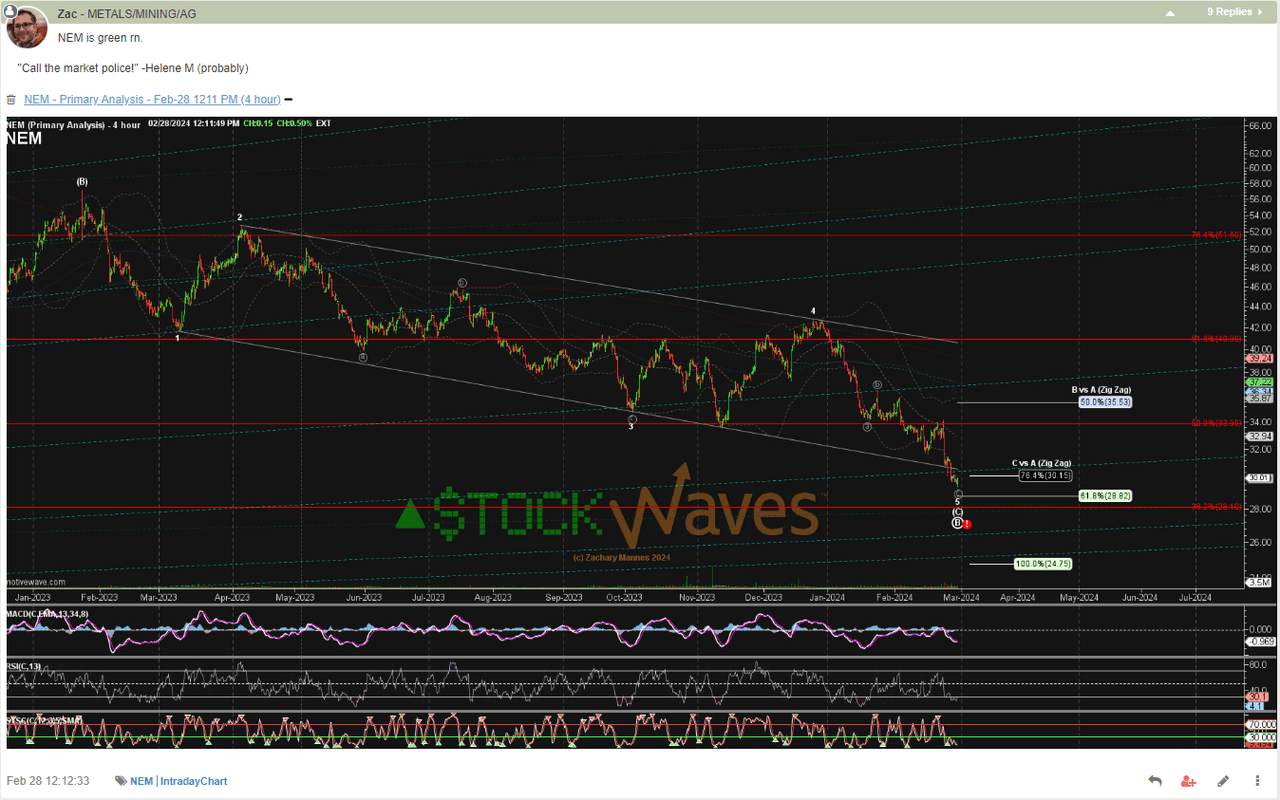
Zac's NEM chart 2/28/24 (EWT)
It has climbed over +13% from that perfect touch of the 61.8% Fibonacci retrace so far. It is not yet a clear “5up3down” to confirm a true Elliott Wave trend change, but it is working on it. The smaller degree structure we have been following up daily off the low continues to be constructive and fits nicely into the start of the larger C-wave up.
Stock Waves continues to identify high-probability targets at the intersection of fundamentals and technicals. We continue to see a very bullish 2020s decade for commodities, but not all charts are the same. We relish the diverse patterns we see even among the precious metals mining stocks as they present more opportunities for rotation than in an “all-the-same” market.

