MarketMood Thursday: Caution Lights Flashing
 By
By
Where We've Been:
Sentiment unsurprisingly reflected a focus on presidential and geopolitical themes. MMI was looking for an up day and the market closed moderately higher.
Indicator changes: None noted.
Where We're Heading:
Sentiment for Thursday is somewhat ambiguous. It still reflects a focus on presidential and geopolitical themes, but with a waning intensity or enthusiasm. There is a potential flip from up to down for Thursday, but the odds for this occurring are diminishing. If it does occur, ideally the market would display this as up first, sideways, then turning down. Without the flip (inversion), MMI would simply be up for Thursday. For Friday, MMI is down if no flip is observed (base case) and up if it looks likely that there was one (low probability alt case).
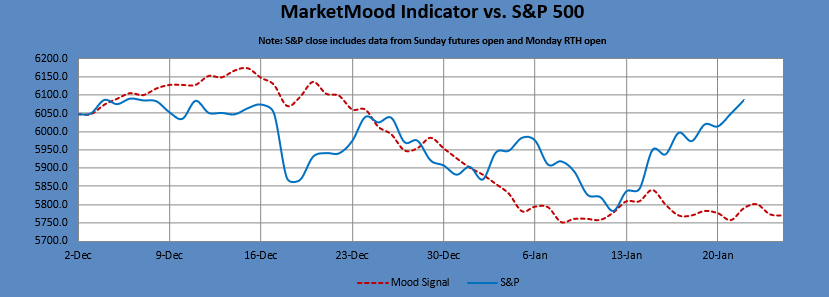
With the ambiguity of late, the bull/bear trendline (6015 SPX cash tomorrow) can be useful as a general idea of trading bias, although this approach is not immune from whipsaw.
Latest charts follow the summary tables.
Internet search theme source data for MMI input: man, president, legal, ceremony, internet, videos, info, sports, mistake, remembered, honored, time, forgiveness
Next 3 Days (days 2 and 3 are considered preliminary):
| Date | Daily MMI | CDMS* |
|---|---|---|
| 1/23 | see text | No Trade |
| 1/24 | see text | No Trade |
*Composite Daily Mood Signal (CDMS) combines the MMI daily signal and the various MM trend and trading indicators into one overall daily trade signal. Possible signals are intraday buy, daily buy, no trade, intraday sell, and daily sell. An "intraday" signal is more likely to be a mixed day, so the implied strategy is to watch for day trade setups in the indicated direction during the trading day. A "daily" signal points to less cross-currents and an implied strategy of entering at market close for the next day's trade.
MM Indicators and Trading Parameters Summary:
| Indicator | Scope | Reading |
|---|---|---|
| LTTI | Longer Term Trend | Strong Bullish |
| MMTT (main) | Medium Term Trend | Bullish > 6015 |
| MMTT (HP) | Medium Term Trend | Ambiguous |
| MMTT (b/b) | Bull/Bear Trend Line | 6015 (SPX cash) |
| MM MACD | Swing Trade | N/A |
| MAM | 7 Day Moving Average | Moderately Overbought |
Note: Medium term (MMTT ) is roughly 1 week to 2 months. Longer term (LTTI) is roughly 1 month to a year or more. Swing (MM MACD) is 1 - 3 days or more.
Short Term Charts and Indicators:
MMI vs. S&P 500 daily:
MMI2 vs S&P 500 daily:
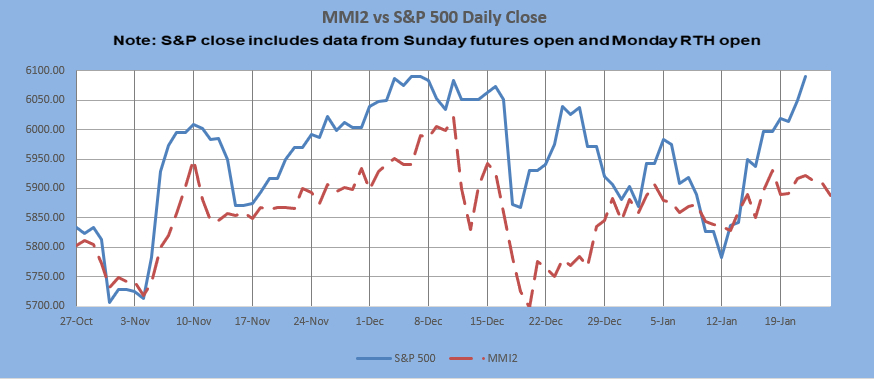
** MMI 2 uses an alternate dynamic algorithm to convert the same sentiment source data to S&P direction that the original MMI algorithm uses.
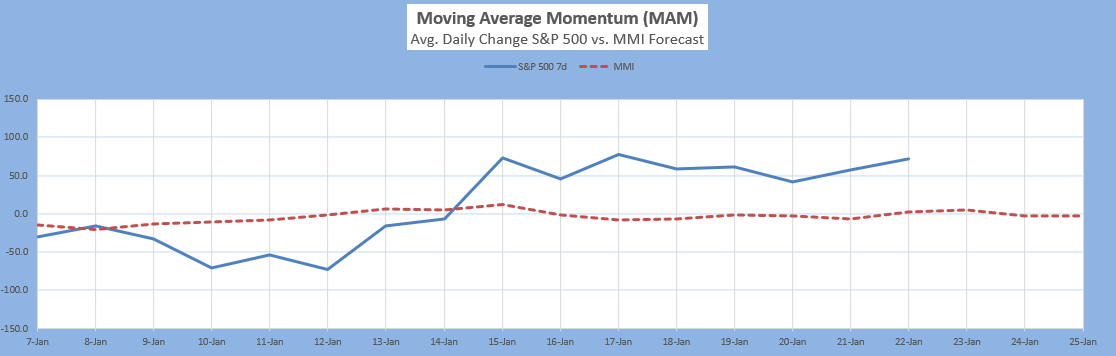
The Moving Average Momentum (MAM): The latest MAM major low signal was for August 4-7, 2023. The signal was invalidated on August 8. The last cleanly confirmed MAM major low signal was for Mar. 3-Mar. 18, 2022, with the low on Mar. 8 followed by a 10% rally. The major low signal following that, for Sept. 20 - 27, 2022 was invalidated on Sept. 29, implying more downside yet to come. The market made a low on Sept. 30, bounced, and then made a lower low on Oct. 13. It rallied 8% from there. The last major high signal was for Nov. 22 - Dec. 2, 2024. The signal was invalidated on Dec. 4 pointing to likely further gains. The last clear major high signal was for July 6-13, 2022. The high on July 7, 2022 was followed by a smaller than usual 3% decline on the S&P 500.
Current status: Highly Overbought
MM MACD signal is unconfirmed sell, and the swing level trend is up. There is no swing trade signal.
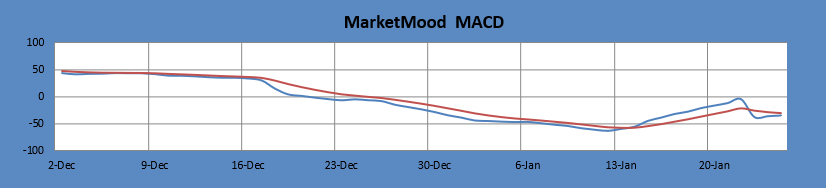
The MM MACD is similar to a standard MACD, except that it uses the MMI signal data to extend several days beyond today, while the standard MACD relies solely on historical market data.
Intermediate Term Forecast:
The latest Weekly Outlook can be seen here. The weekly chart is leaning down into late January. A Sharp Drop Alert has been added through Jan. 27. This does not mean an immediate decline is anticipated, but that conditions are right for a sharp drop at any point during this time window.
MarketMood Trend Trader
The chart below uses three sentiment trend lines to generate a swing trade signal of BUY if 2 out of 3 are greater than 0 and SELL if 2 out of 3 are less than 0. Trade length averages 9 days, but can be as short as 1 and has been as long as 60. The signal is updated each day after market close. The higher probability signal reflects sentiment aligning in direction, otherwise intermediate trend is considered "ambiguous." Note: because this is a trend trader it is not recommended for trading during periods of little to no definitive trend (e.g. lengthy EW diagonals).
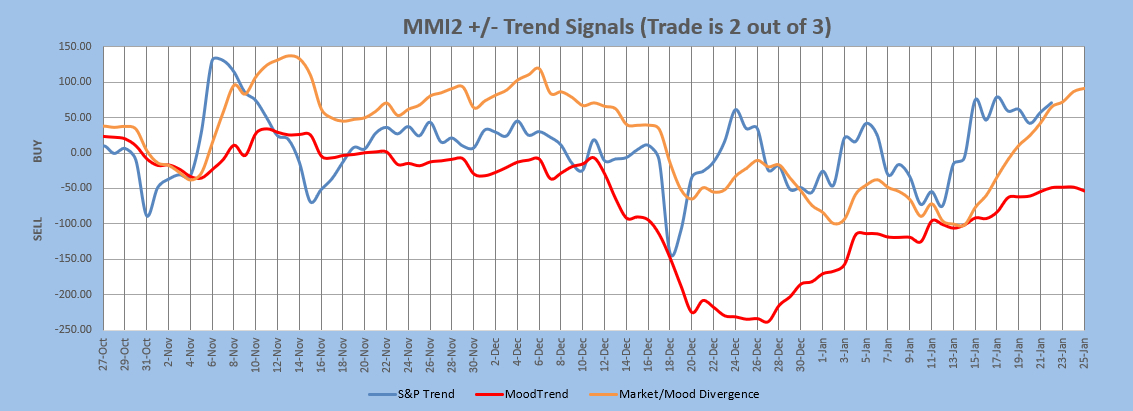
Current signal: Buy since Jan. 17. HP signal: Neutral since Jan. 17.
Long Term Forecast:
The long term trend is indicated by the general divergence between the stock market and the mood generated forecast (see long term chart below). The MM Long Term Trend Indicator (lower chart) which is derived from this divergence, indicates: "Strong Bullish Trend." The MM LTTI has had this indication since January 5, 2025. Since August 2, 2024 it has been essentially vacillating between bullish and early bearish. It had been primarily “Strong Bullish Trend" from May 17, 2023 to August 1, 2024. It was primarily bearish from April 22, 2022 to early April 2023.
Crash Event Warning: Since the Fall of 2023, we've been waiting and watching a crash-like setup develop. As of August 2, 2024 we went into active alert mode. On market open of August 5, the crash alert warning bell was rung. It was said that "whether the market can somehow still muster up one more high or not, it's assumed that this event is now on its way." The market has made another high, and it's still the assumption... a crash is baked in, and it will happen when it does (there's no definitive indication that it's about to happen any time soon). The last time the MMI vs S&P 500 divergence was even close to the recent extremes on the bullish side was initially July-August 2019, then again November 2019-January 2020, which was followed by the February-March 2020 "crash." The last time it was near that extreme on the bearish side was June-October of 2022, which was followed by a nine month rally through July 2023.
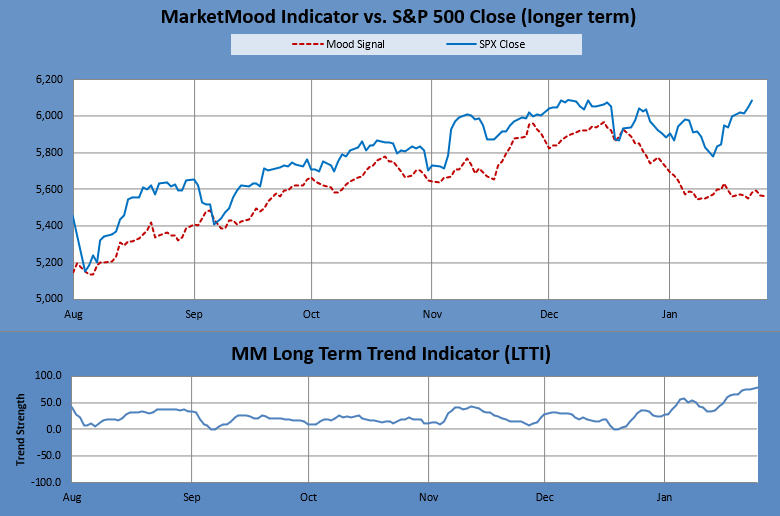
The MM LTTI measures trend strength using the divergence between the market trend and the forecast trend.
For the Extremely Curious:
In normal mode, the top of the mood chart is primary, and in inverted mode the bottom of the chart is. Orientation is tentatively assumed to be in normal mode.
Note: Sentiment pattern for Saturday (1/25) reflects systemic destabilization and/or a sense of crisis, disaster, or upheaval.
Tomorrow's market mood and news: presidential and geopolitical themes
Tomorrow's trader context: shifting circumstances
MMI does least well in these conditions-- 1) EW 4th wave, 2) EW b wave, 3) Diagonals, and 4) Topping. More than one of these conditions concurrently present will further diminish performance.
Note: Changes to next day MMI signals occur about 5% of the time, and will be announced in updates as well as the daily report should they occur. Same day signals will not change. Day 2 and 3 signals reflect the most current information, and are subject to change. The default timeframe covered by the daily signals is market close to market close. except on Mondays, as there is a signal for Monday open (i.e. "weekend close") and Monday close.
