McDonald’s: No Happy Meal For You
 By
Levi
By
Levi
By Levi at Elliott Wave Trader; Produced with Avi Gilburt
Since this issue first arrived on the stock market scene back in 1968 it has been mostly ‘up’ with a pair of principal pullbacks. One completed in 1974 and the other in 2003. The 1974 version was a -50% decline in price from the high. The next great pullback that finished in 2003 resulted in a more than -70% haircut.
If we now look at that entire structure it does show the potential for a similar stall warning being needed here. Could it even be a more important high? Yes. How are we able to make this affirmation? Let’s discuss the big picture and then zoom into what the structure of the entire chart from 1968 is telling us.
This Methodology Provides Context
What do we mean by context? The literal definition is something like this:
“The surroundings, circumstances, environment, background or settings that determine, specify, or clarify the meaning of an event or other occurrence.”
Now, let’s take that and color in the literal lines to give this us a bit more understanding when it comes to the markets. Elliott Wave is based on the fact that markets are fractal in nature. These structures are self-similar at all degrees. This means that the smaller structure should agree with the larger structure and vice versa. In fact, this is a way that a technician can ‘check’ their own work by making sure the subwaves agree with the larger context.
What Does The Structure Of Price Tell Us?
What truly drives financial markets? They are driven by supply and demand, of course. But, ask yourself, what spurs on demand? It’s crowd behavior at work before our very eyes. Sentiment, as we denominate it. So, how do you measure and then project where emotions might take the markets?
Avi Gilburt has written in-depth articles where he shares multiple studies and data points collected over years of research. These have been synthesized into understandable and actionable information for our readers. Here's an excerpt from one of those pieces:
”If you are interested in a methodology which will open your minds and eyes as to how markets really work, then let's move right into the overview.
Back in the 1930's, an accountant named Ralph Nelson Elliott identified behavioral patterns within the stock market which represented the larger collective behavioral patterns of society en masse. And, in 1940, Elliott publicly tied the movements of human behavior to the natural law represented through Fibonacci mathematics.
Elliott understood that financial markets provide us with a representation of the overall mood or psychology of the masses. And, he also understood that markets are fractal in nature. That means they are variably self-similar at different degrees of trend.” - Avi Gilburt
(You can read Part One of this 6-part series starting here)
A Bearish Setup Explained
First, let’s look at the chart to observe what may be the most salient point in our discussion.
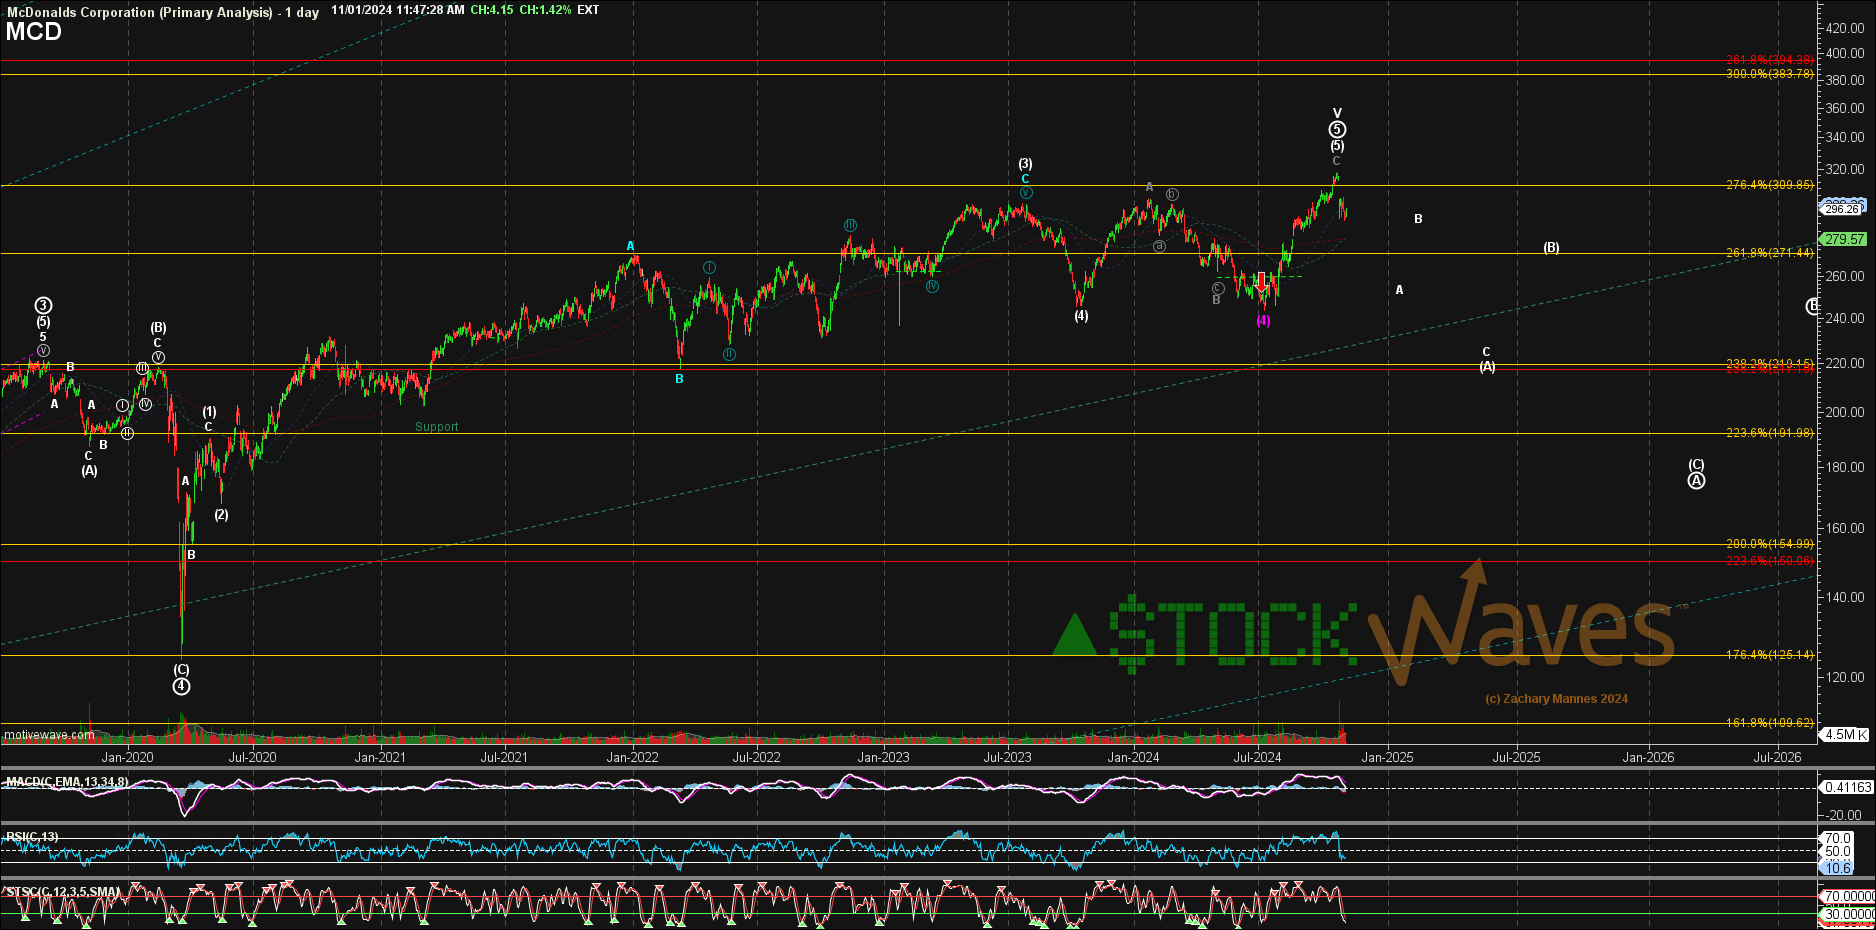
Note how the last high is the culmination of various wave degrees. This points to the possibility of a much more important top having been struck. As a brief aside, there is the chance that the current pullback is a lesser degree fourth wave and there is one more major high to be struck. However, should price move below the $270 area with follow through, then it would further confirm the likelihood of a long-lasting top in place already.
Remember as we have discussed prior, the markets are fractal in their structure. When varying degrees come to their finish then we have the setup for a high-probability conclusion of a much larger structure. This is the case with (MCD). Now we can zoom in a bit to observe the near term subwaves.
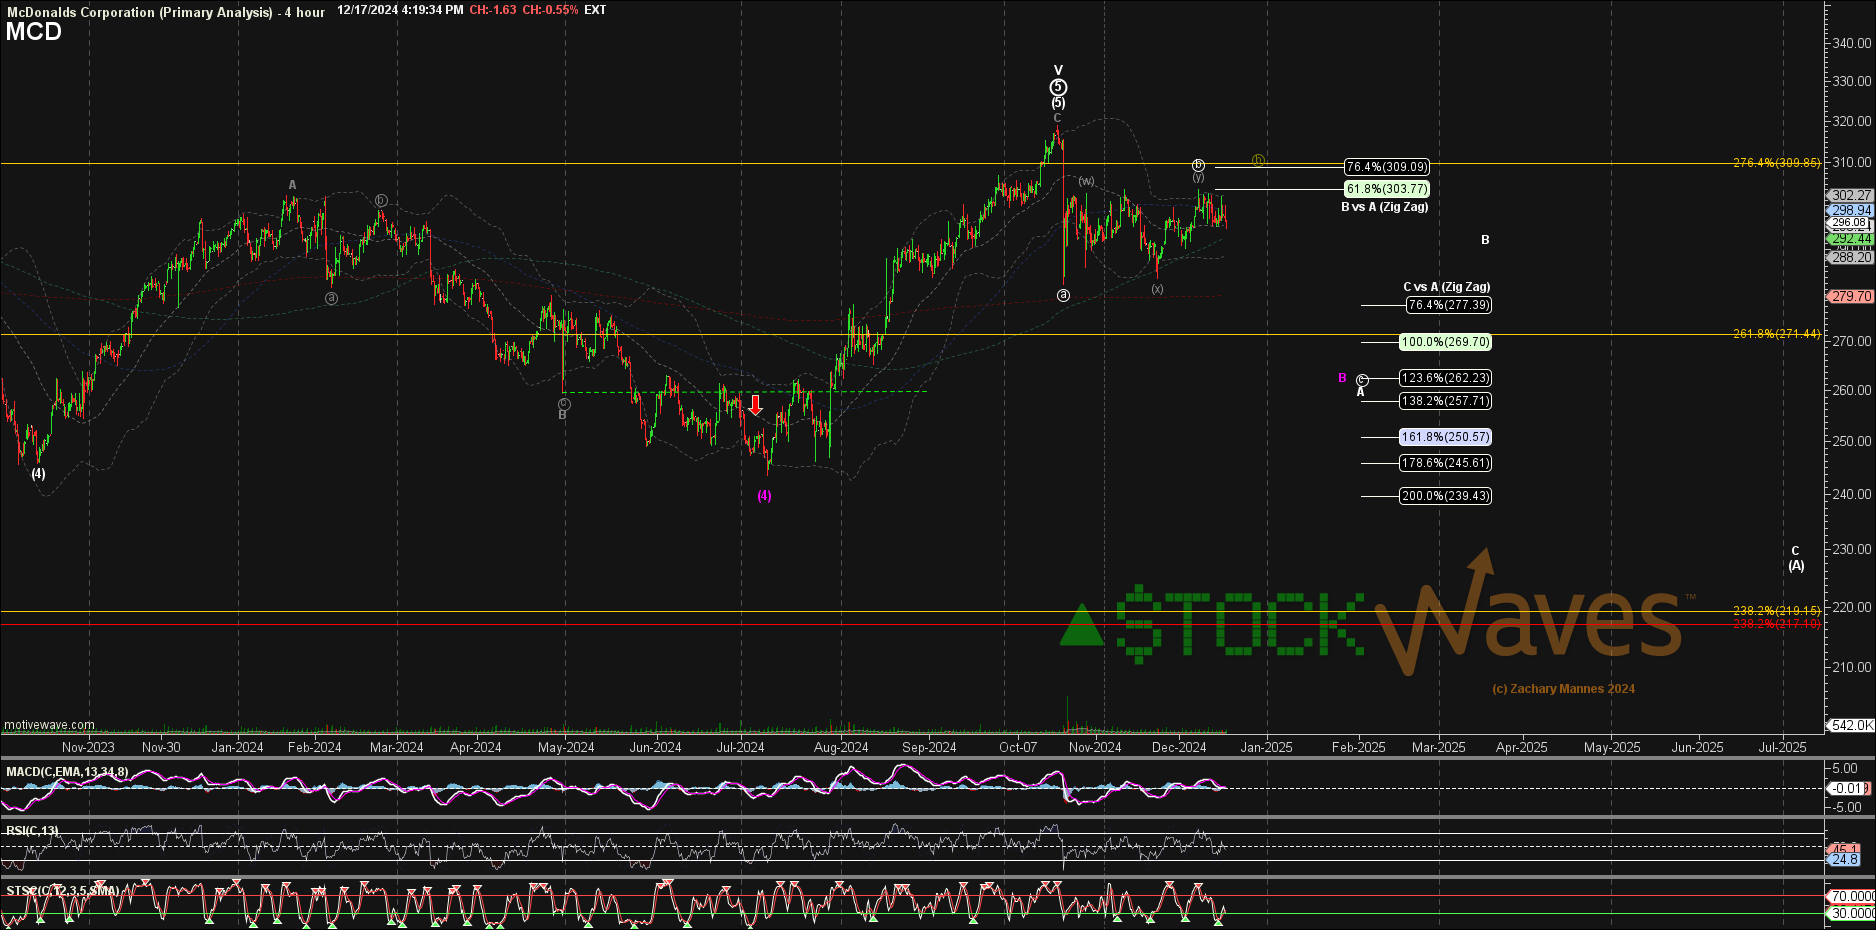
As you can see on Zac’s chart, price is likely in a ‘b’ wave of a larger ‘A’ wave corrective pattern. This will continue to develop and we will monitor its progress closely. Keep in mind as well that structures can and do morph. Markets are dynamic, so we must apply an adaptable utility so as to manage such.
If this is only a smaller degree fourth wave correction, then it likely completes at the 270 area and price will see another surge higher. But, in Zac’s primary scenario, the chart has already seen its peak and the consolidation/pullback will take some time, perhaps many months, given the degree of the wave structure.
Conclusion
Markets are emotional. They are irrational. In their wake, they can leave the seemingly most intelligent and logical among us battered, bloodied, and abandoned. Striving to constrain the markets in a linear box of reason and clean geometry will exhaust the brilliant and mercilessly bash the bravest.
This, of course, does not leave us in the lurch. A system is needed to bring structure to the madness. We have such a system in place, it's the very basis of our methodology.
I would like to take this opportunity to remind you that we provide our perspective by ranking probabilistic market movements based upon the structure of the market price action. And if we maintain a certain primary perspective as to how the market will move next, and the market breaks that pattern, it clearly tells us that we were wrong in our initial assessment. But here's the most important part of the analysis: We also provide you with an alternative perspective at the same time we provide you with our primary expectation, and let you know when to adopt that alternative perspective before it happens.
There are many ways to analyze and track stocks and the market they form. Some are more consistent than others. For us, this method has proved the most reliable and keeps us on the right side of the trade much more often than not. Nothing is perfect in this world, but for those looking to open their eyes to a new universe of trading and investing, why not consider studying this further? It may just be one of the most illuminating projects you undertake.
