NYSE High-Low (NYHL) Positional System
NYHL Positional System
Started out as a slow day.... so I wrote this up thinking of posting... and then the slow day turned into Fed day like craziness lol... anyhow, it has been a long while since I posted any new system studies in the main room.. so...
Here is a study that I have been working on for some time.. Nothing complicated about it and I have shared the chart also a few times here and there...
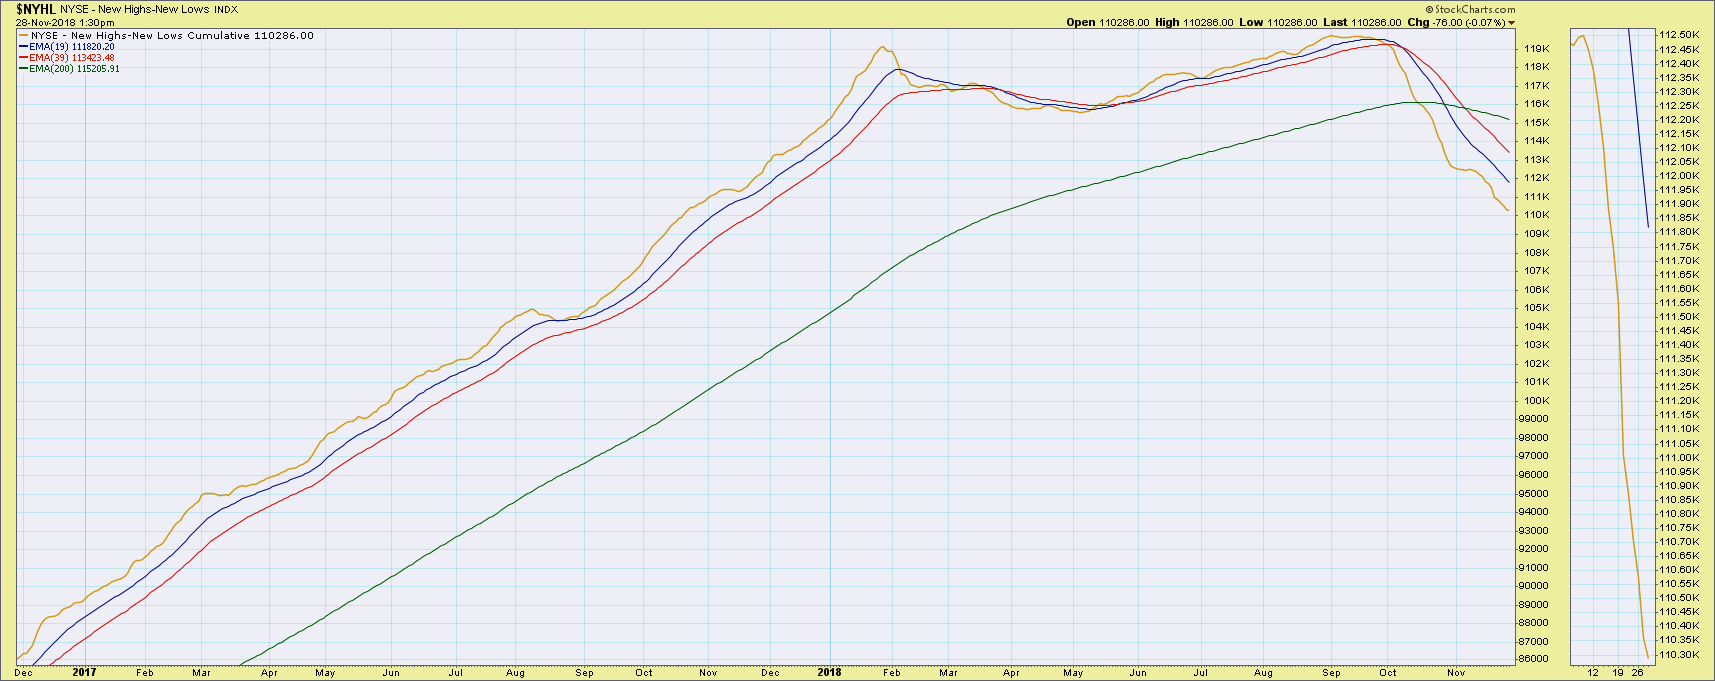
The chart below is the cumulative value of new highs - new lows on the NYSE (gold line) and the red is its 39 EMA and blue is its 19 EMA. In other words it is internal data on the market... which I have used to create a positional strategy...
Like I said though, no rocket science here... we buy when the gold line crosses above the red and the blue... we exit (no shorts in this system) when the gold line crosses back below the red AND the blue. Cross below the blue is a warning to get ready for a sell signal... close below red is the confirmation to get out of long positions.
That's it.
Right now, the system is on a sell (which means flat for us) and we are waiting for a positional buy.
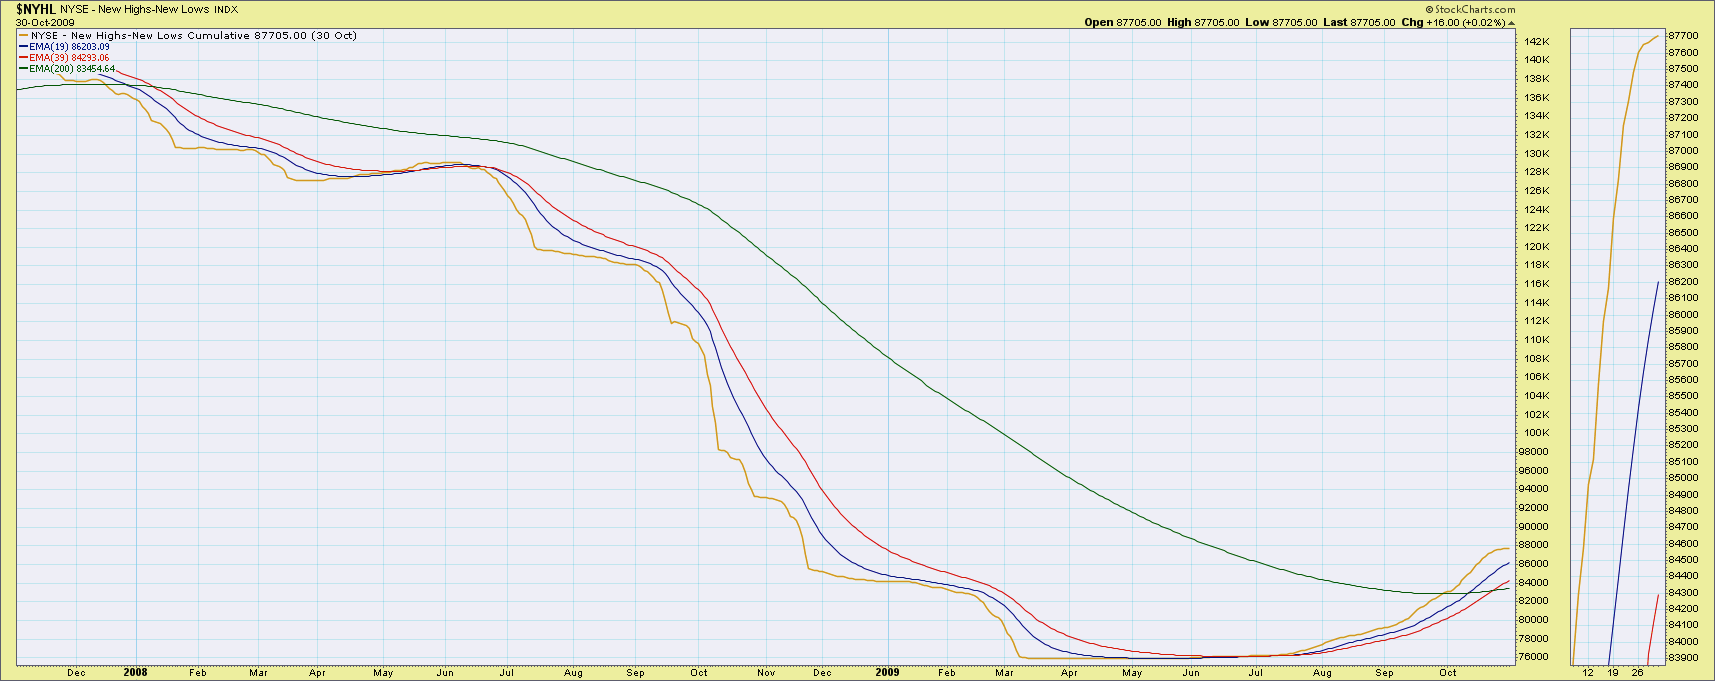
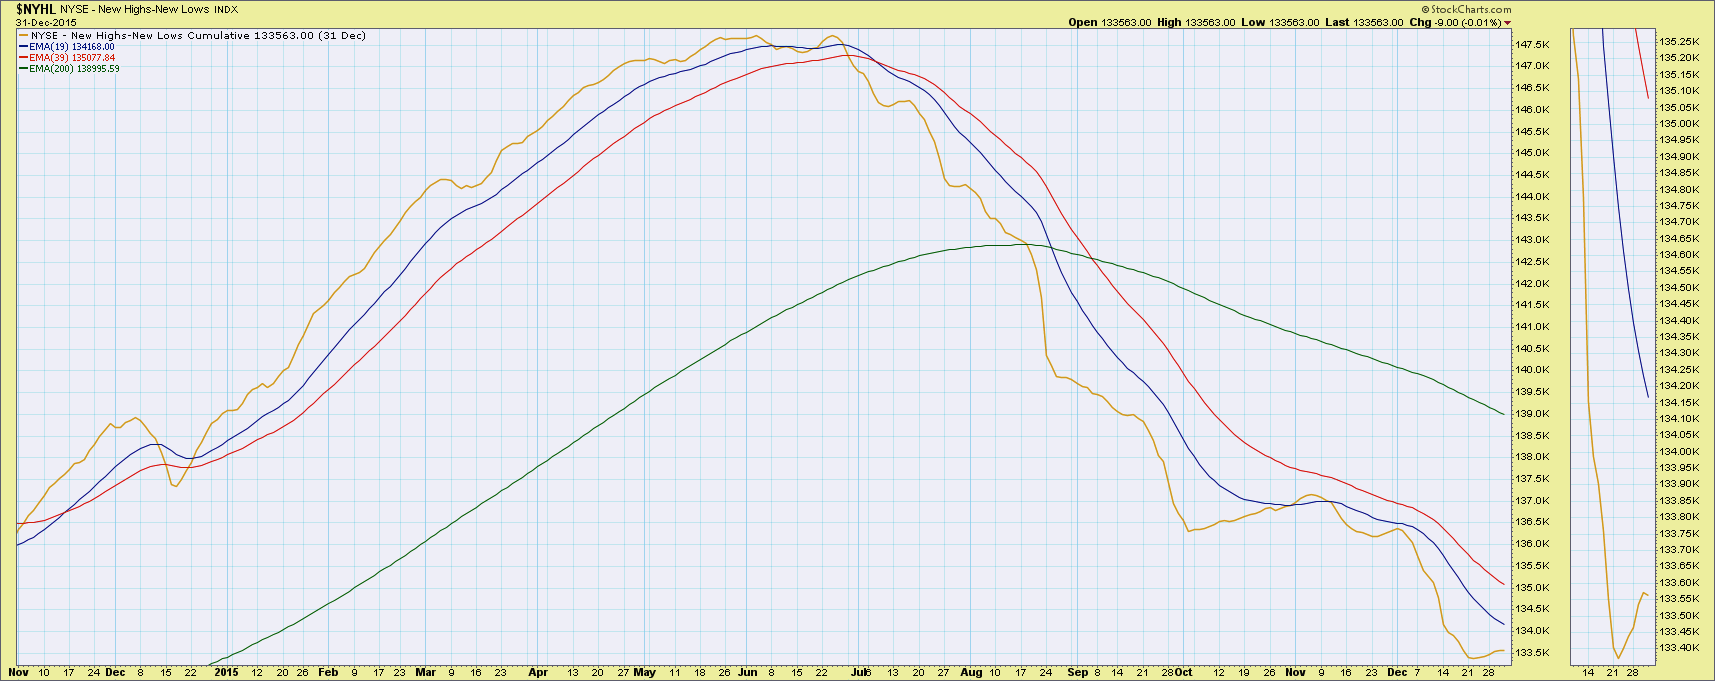
In effect, this is a positional trend following system but focus is on internals... Compared to similar system using price, this produces lesser whipsaws and will keep us in the trade for a much longer time.. And will keep out of the market when the real bear arrives... like 2008... or mini bear like 2015...
2008 and 2015
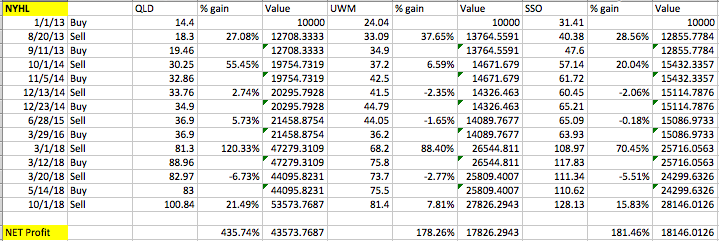
I pulled actual stats on the system from 2013-01-01 to date.. so 5 years and 10 months worth of data... we do have data back to 1990 and most of it is similar - did not note any outliers... still, this is the actual data for the last 5 yrs, 10 months....
I used SSO, UWM and QLD... three 2X ETFs based on SPX, IWM(small caps) and QQQ(tech)... no surprise that tech outperformed the other 2 greatly over the last 5 years..
QLD hit a 400%+ gain and the other two did close to 180% using the system...
Ideal case is to use the system for slow money type accounts like IRAs or 401Ks... basically no leverage... not many trades... and whoever following needs to be patient to wait for a long time either for a signal or for an exit... The main advantage of the system is that it takes out the guesswork when to buy or sell... the last sell was on 10/1/18..
Now, having said all this, we all know that historical testing and running stats is all well and good... but unless you put in real money and run this real time, you will never know the viability or better to say you will never confirm the viability of a system.
I have personally been running this system in my longer term accounts for a few months and I have been happy with it so far... sure makes the decision making much easier.. This is my positional system, I have another swing system.. and an intraday scalper system. This positional one is the biggest account and I like this system to manage it without having to guess on the direction next... just wait for the NYHL to tell us...
I will be posting an unofficial positional portfolio in the Smart money room going forward which will be allocated based on the NYHL system.. which will be tracking my longer term account and what I do in it. It is flat now so it will be from the next buy signal... this along with the swing system(usually few weeks) maybe though I am not sure of that yet... most likely in a spreadsheet form daily+ any changes when they happen... definitely do not have the bandwidth to post the scalper trades... but the positional will be posted and maybe the swings after tracking for a while how the positional are going... but ofcourse, anyone can set this particular chart up themselves and follow along if you wish to.. ![]()
I ran this setup with some stocks in the portfolio as well, but it seems the best performance are with these ETFs.. don't need to think too much about stock picking... but for someone running a stock portfolio also, the NYHL signals can be valuable information...
Comments/Questions welcome.
Best.


