Newmont: Healthy Pullbacks Are A Good Thing
 By
Zac Mannes
By
Zac Mannes
Contributed by Mark Malinowski, produced with Avi Gilburt.
Introduction
Some might say quoting yourself is a bit of an early victory lap, but back in March, we said, “Precious metals and precious metals miners are on the cusp of a run.”
Screen grab from March SA article. (SA)
Back in our March article on Newmont (NYSE:NEM)(TSX:NGT:CA), we had a strong start off a high probability bottom. Since the little jog back to 33s for a higher low, it climbed another +34% to $44s, giving us a solid five waves up off February. It has since been consolidating. Why? Did the fundamentals that supported our bullish thesis back in March change?
The production earnings reports from Q1 reflected a couple of notable things that were anticipated in our last update, but several that were not.
First, the industry standard measure of All in Sustaining Costs per ounce (AISC) was expected to rise slightly. The reported numbers moved from 1376 USD/oz in Q1 2023 to 1439 USD per oz for Q1 2024. I expect this metric to improve as redundancies from the Newcrest Acquisition are removed. Second, Newmont’s net income, while vastly improved from Q4, was still well below that of Q1 2023, despite higher gold equivalent ounces sold. This continues to reflect their higher borrowing costs in the current elevated interest rate environment. I expect this to continue to improve in Q2 with higher output, further reduction of debt, and Fed rates being reduced.
The first unexpected element of the report was a return of capital through board authorization of a 1.0 billion share-repurchase program. I view these actions as a reflection of internal calculations showing the rate of return for buying back shares at the current price is a better investment than more debt reduction. The ultra-conservative view on commodity prices assumptions was the second thing I noted in their report. Using gold prices of 1900 USD/oz and silver prices at 23 USD/oz most likely reflects some of their contracts and hedging, but I still view this as very conservative. Third, the Brucejack facility only produced 37 k oz in Q1 2024. The annual production rate for 2023 was 286 k oz (71.5 k oz/ quarter). While in the bigger picture, production continued to ramp up, there are no press releases about Brucejack restarting since it was shut down after a tragic fatality in December 2023.
Brucejack’s shutdown is likely the most significant negative impact on results. The unanticipated things outside of Brucejack’s shutdown that I have identified from combing through their reports are not significant needle-moving things for Newmont’s share price.
In other words, we need a catalyst for the share price to make a large change. That also means there has been very little in the way of fundamentals that have changed for Newmont, so why has the share price pulled back so much?
Pullbacks
From an Elliott Wave perspective, when a stock retreats 50% or slightly more of its move off a low, it is one of the healthiest things for long-term price follow-through. From a Fibonacci Pinball perspective, the ideal retrace zone is a bit more broad, starting at a 38.2% retrace all the way back to 61.8% retrace.
Everyone loves an investment that immediately takes off to the upside as soon as they buy it. Many individual investors who bought that opportunity try to just keep riding that stock higher. Sometimes that works, sometimes it does not. The immediate boom and grind higher pattern can be very difficult to choose good opportunities to add and maximize your investment return. Equally challenging can be identifying technical levels of support in order to place stops. The comment I often overhear about stocks like this is, “I only wish I had gotten more.” However, the reality is that a chart with a clear price structure and “predictable” pullbacks is far superior. You might ask, how can that be?
Pullbacks are healthy
From an Elliott Wave perspective, a clear price structure with the right proportions is the ideal. By clear price structure, I mean waves up and down that are proportional with an ideal mathematical model. These waves provide clarity about key targets and supports. They also let you know when you are wrong, so exits can be made gracefully, rather than being all or nothing trades. If we do not get pullbacks, it is extremely difficult to provide shorter term targets and support levels or to know when you are wrong.
I am sure many of you have seen this before, but it is the illustration of why pullbacks are so important. The simple answer is all the math is based on the move up off the low and the place where it pulled back to. Simply put, we call this a i-ii or 5 up and 3 down setup. To people experienced with this description of a chart, this is similar to ringing the dinner bell.
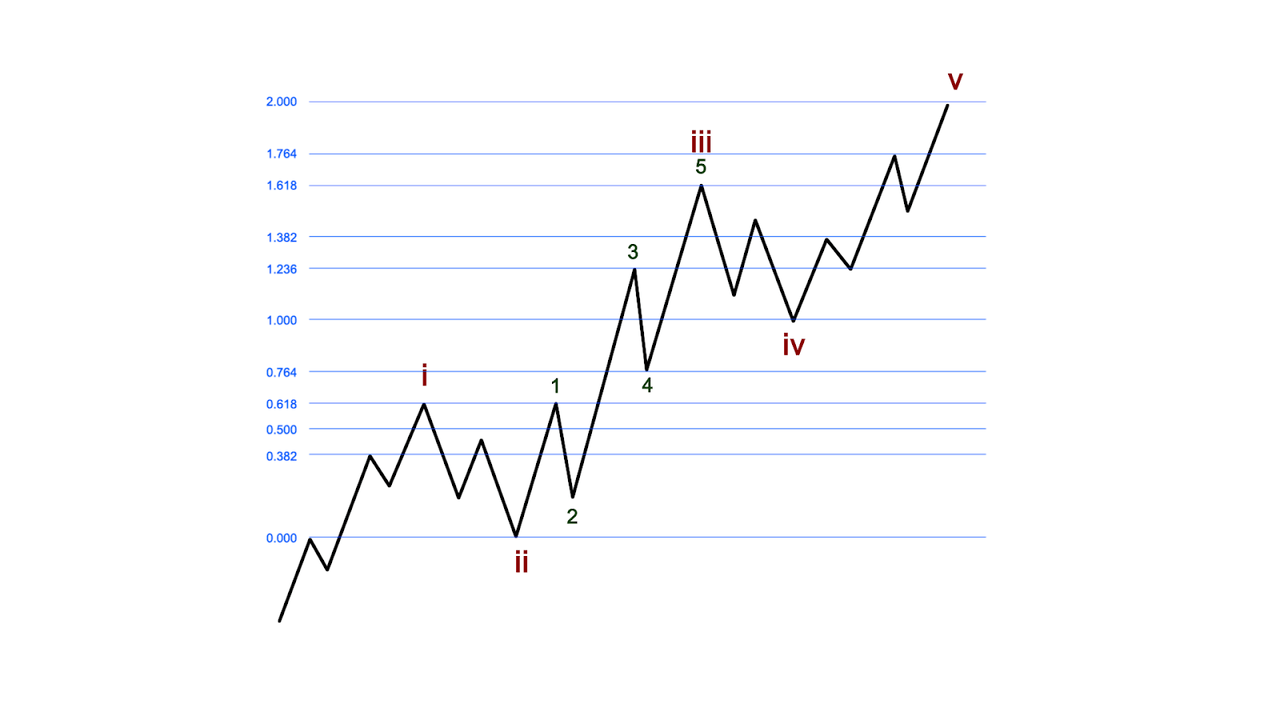
Basic Fibonacci PinBall Structure (EWT)
Updating the Keys to Success
Last time I talked about all the reasons I was bullish on metals and miners from the stretched prices, ratios and the fundamentals of Newmont. We talked about 3 key things changing for Newmont.
First, the Peñasquito mine has been up and running since October (it was shut down last year for 5 months due to a labor dispute). For context, this is the fifth-largest silver mine in the world, the second largest in Mexico and wholly owned by Newmont. Second, the income is starting to roll in from the purchase of Newcrest Mining in November 2023 with the second full quarter of revenue coming to a close at the end of June. The cost savings from removing redundancies is still coming (this takes about 9 to 12 months for 75% of the savings to be realized in my experience). Thirdly, the expected increases in the price of gold, silver and copper continue to play out. Newmont produced almost 400 thousand more gold equivalent ounces in Q1 2024 than they did in Q1 2023.
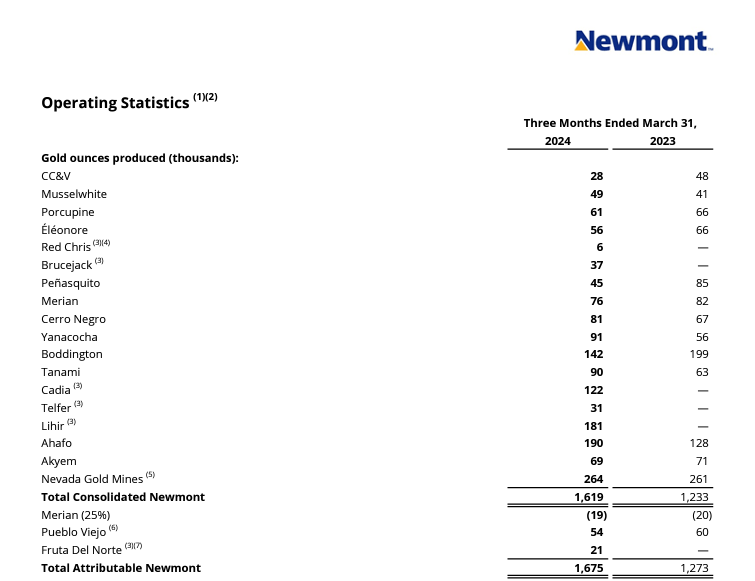
Table of NEM Operating Stats (Nemont)
The delta will be even larger in Q2 and Q3 when Peñasquito was open for 2 months of Q2 and closed for all of Q3. Investors are starting to catch on. The bottom line is, Newmont production has and will year-over-year show significant increases.
If you want to review or reread that discussion in more depth, check it out here: Looking for a Spark.
Next, let’s look at some of the charts.
First, let’s look at the GDX to Gold Futures Ratio. This says to me that we have started, but miners are still lagging the move that gold has made over the last 8 months. In other words, I am looking for miners to continue to outperform gold. I also feel like the ratio is showing us that there is a long way to go yet in the bull run for miners relative to 2016 and 2020.
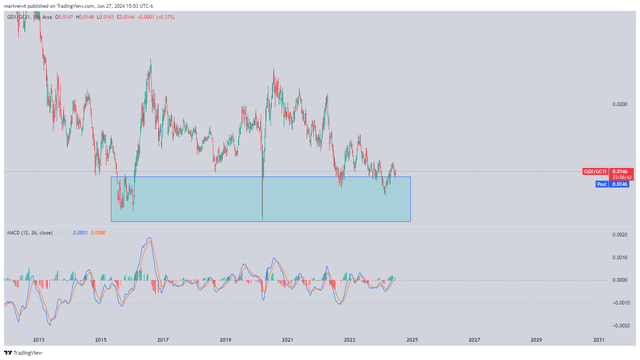
GC to GDX Ratio (Trading View (Mark))
Comparing Newmont with the price of gold, silver and copper, we can see the outperformance continues to be significant, but only when measured relative to the April 2022 Newmont high.
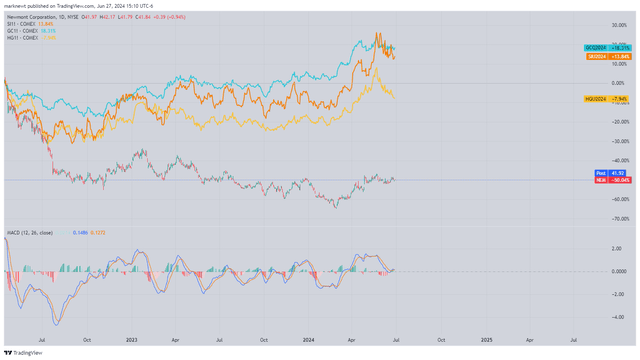
NEM vs Precious Metals 1Day (TradingView (Mark))
If we compare them to the low in Newmont in February, we start to see a very different picture unfold.
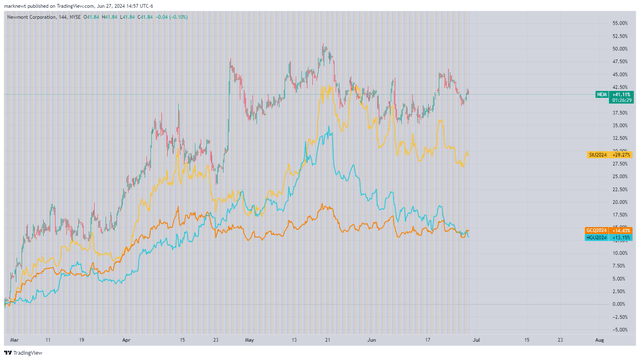
NEM vs Precious Metals 144min (Trading View (Mark))
Technical Analysis:
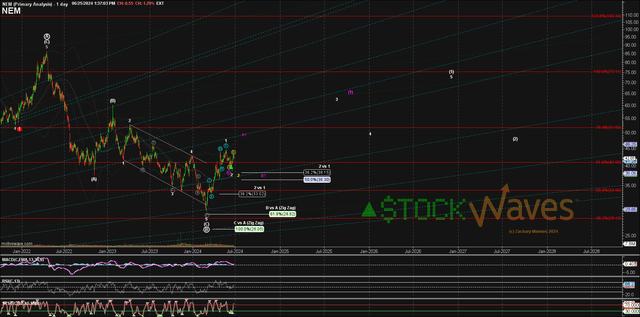
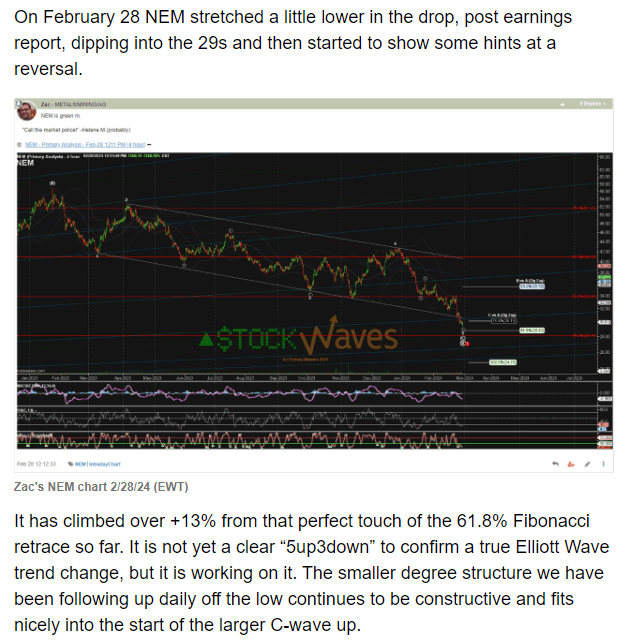
NEM June 25 Daily chart (MMA (Zac))
Zac posted the following in the MMA room on June 25 along with the chart above:
“NEM has given us a solid potential 5up off the Primary degree high probability low for a B wave we were looking for back in February. It has not yet given us a clear reliable retrace into the ‘ideal’ Fib support region but is behaving well as a corrective retrace digesting the +50% move off the lows. The most reliable Fibonacci retrace zone starts at the 38.2% and extends down to the 50% and then 61.8% Fibs. Since a more shallow retrace is certainly valid, but not initially reliable we are leaving the door open to the yellow path shown for a wider and deeper wave 2.
This 1-2 structure fits as the first pieces of 5up for a larger Intermediate degree (1) of our Primary C starting. Moving over the recent high would make the yellow path less of a threat, however it would still not be wholly reliable as a start to 3, rather we would then be considering the possible purple alt shown where a move over 44s could be the alt v of a larger 5up. This might be too big to be just the wave 1 of (1) but not large enough for (1)... since a C-wave up could be an Ending Diagonal pattern I have labeled that purple alt as an A-B of (1).”
In the simplest of terms, pullbacks are the cooling of sentiment associated with any chart. Charts cannot continue on a hot streak without melting down eventually. It is much better for metals to be heated and cooled in successive cycles to increase their strength.
While we place a certain importance on the largest component of the GDX having a bullish set-up, we do see many names that have consolidated quite nicely over the last month. Every chart is treated individually, even when the overall sector has a bullish pattern.
Stock Waves continues to identify high probability targets at the intersection of fundamentals and technicals. We continue to see a very bullish 2020s decade for commodities, but not all charts are the same. We relish the diverse patterns we see even among the precious metals mining stocks, as they present more opportunities for rotation than in an “all-the-same” market.
