Silver Is Never Easy – Until It Explodes
Now, the purpose for which I am providing this analysis to you is not to make you go out and mortgage your house and buy silver calls. I want you to be very deliberate and reasonable when you approach this chart I am going to show you. But, the reason I am posting it is because I want you to understand what I still expect to see in the silver market before a major top is struck in the metals complex.
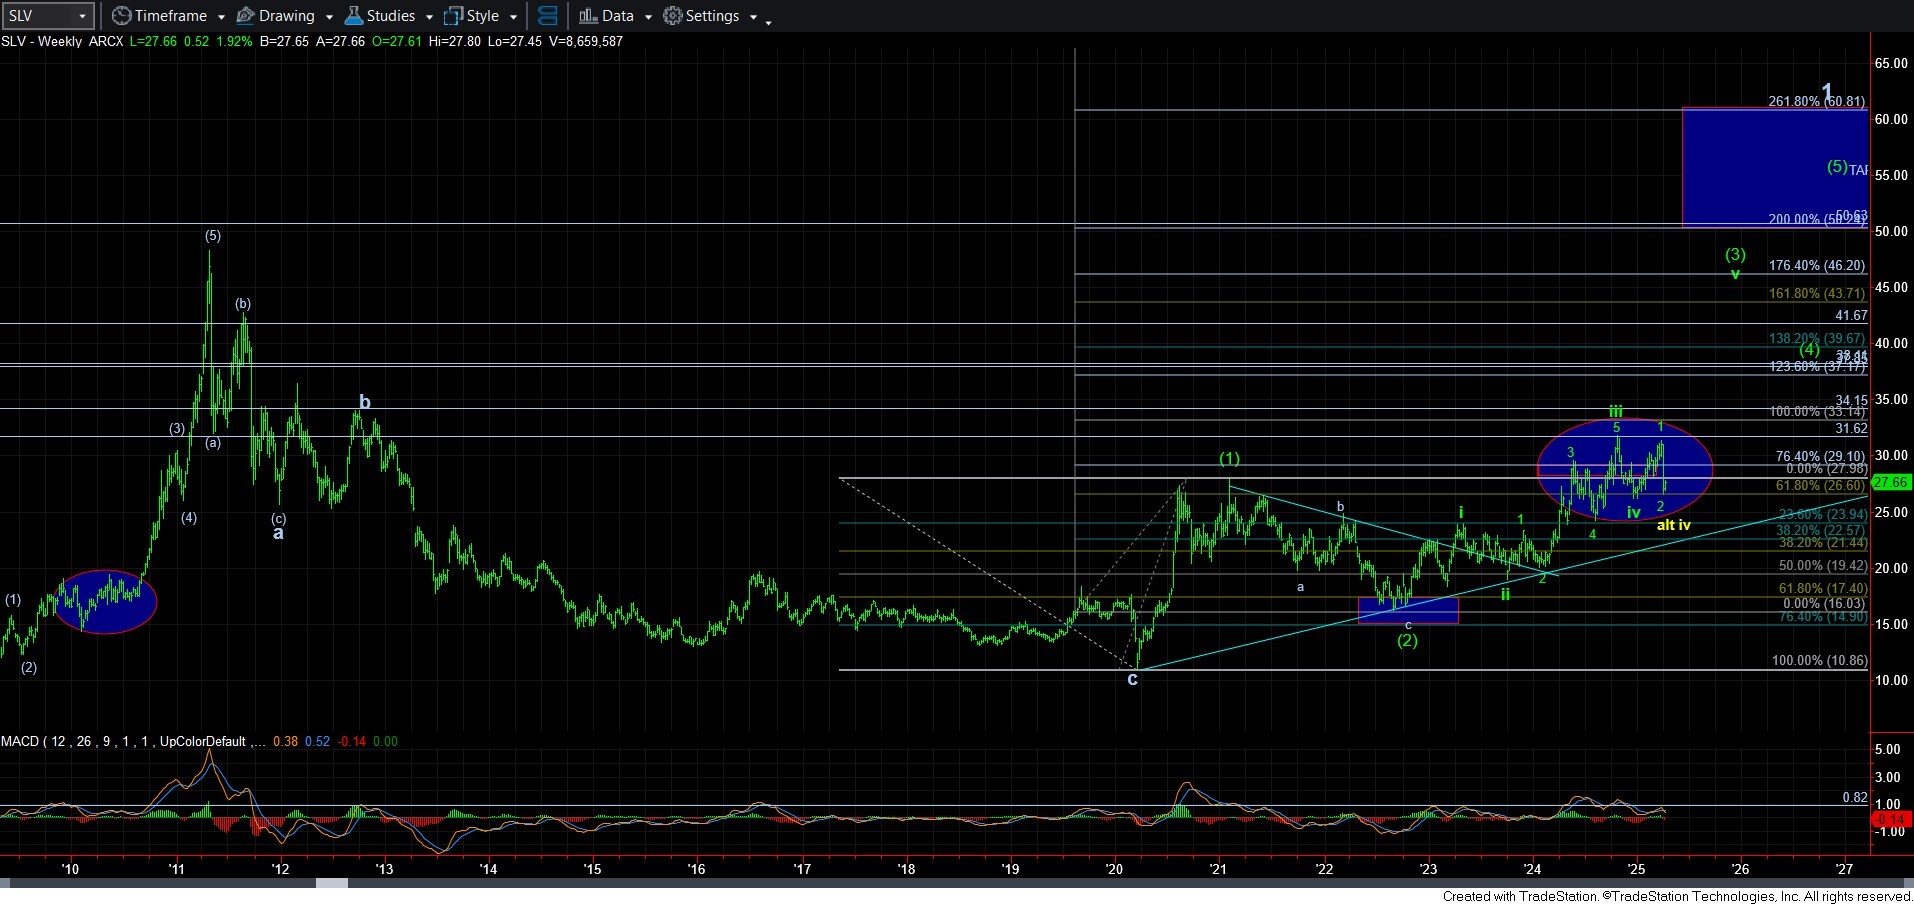
If you look at the attached SLV weekly FRACTAL chart, you will see two ellipses noted on the chart. The one on the left represents the consolidation before the explosion in silver in 2010-11. That consolidation took about 9 months to complete. And, the ellipse on the right represents where I believe we are akin to that consolidation. Currently, we are approximately 9 months into this consolidation as well.
But, remember, I still want to see a solid 5-wave rally take shape before I begin to turn aggressive on this chart. Of course, there is some potential that I may miss an opportunity if it takes off too fast, but whenever I move into aggressive positions, I will always make sure there it is a lower risk and higher probability set up. Right now, I do not think we are there yet.
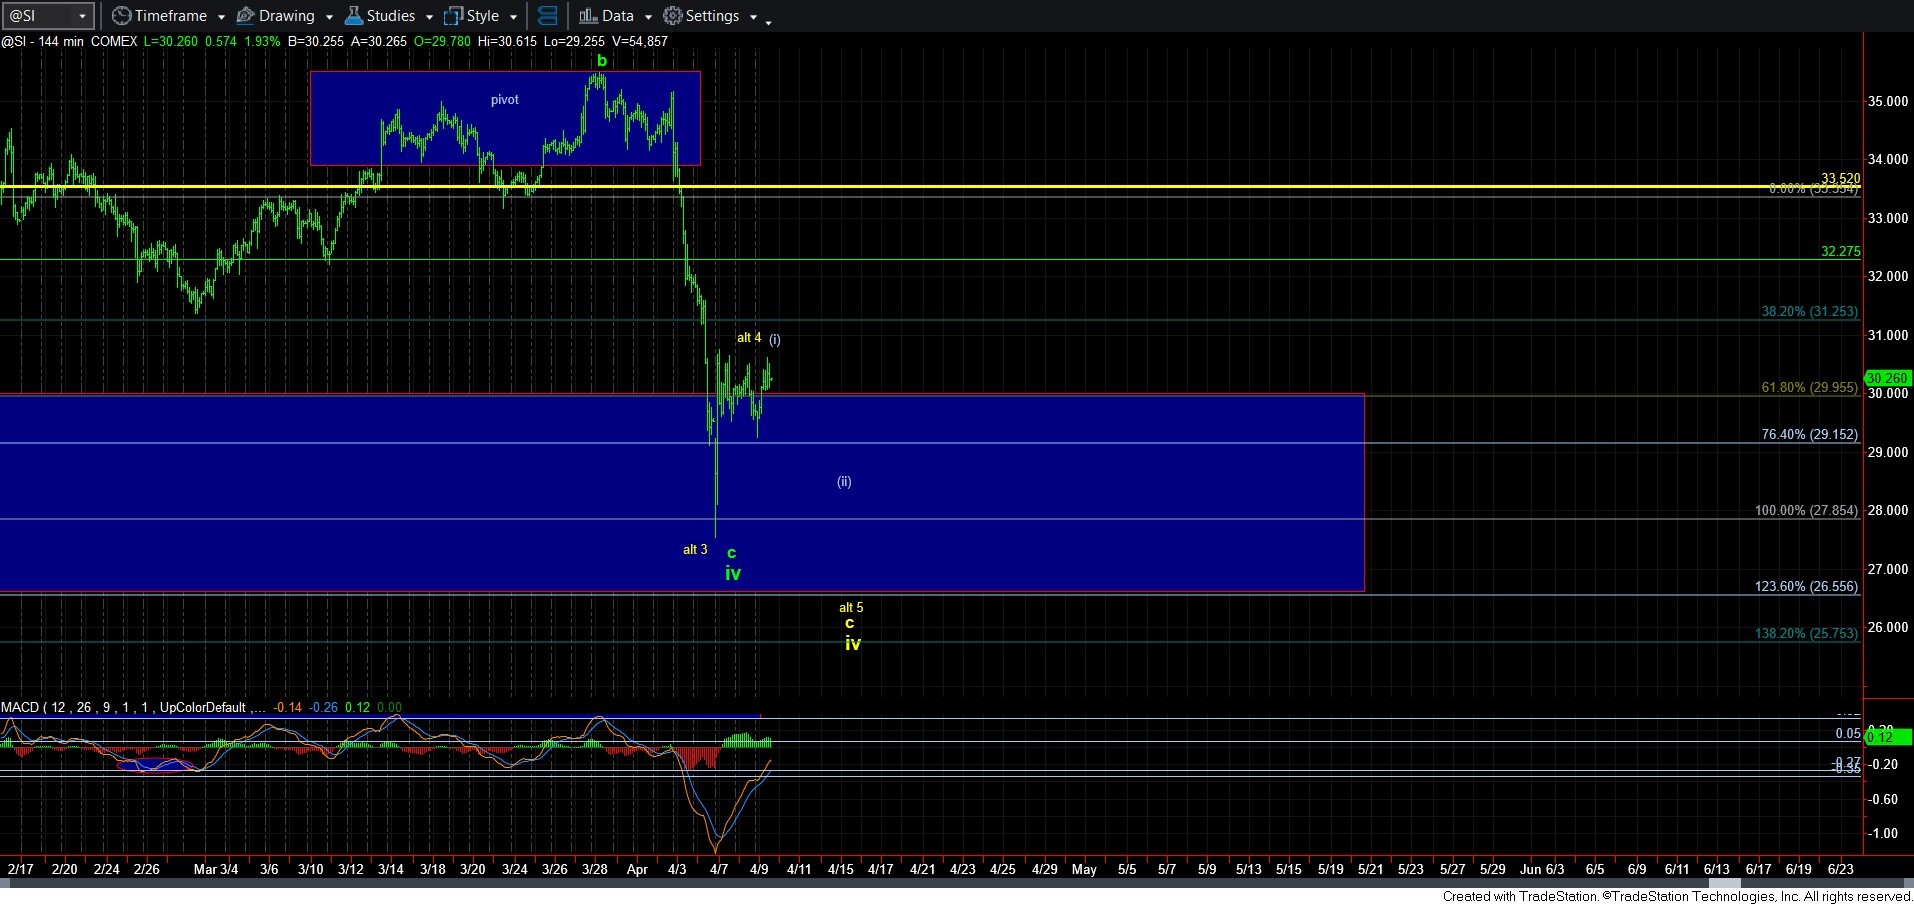
There are two things right now that would have me move into more aggressive positions in silver. Either a clear 5 up and 3 back, or if we should get a 5th wave lower low, as presented on the 144-minute chart attached. But, for now, I am expecting that the next rally “should” finally provide us with that break-out, at least based upon this fractal.
For now, I have a hard time adopting the [i][ii] shown on the 144-minute chart, as it is hard for me to buy into a truncated 5th wave for that wave [i], especially with such a larger potential 4th wave in that wave [i]. But, I am trying to keep an open mind.
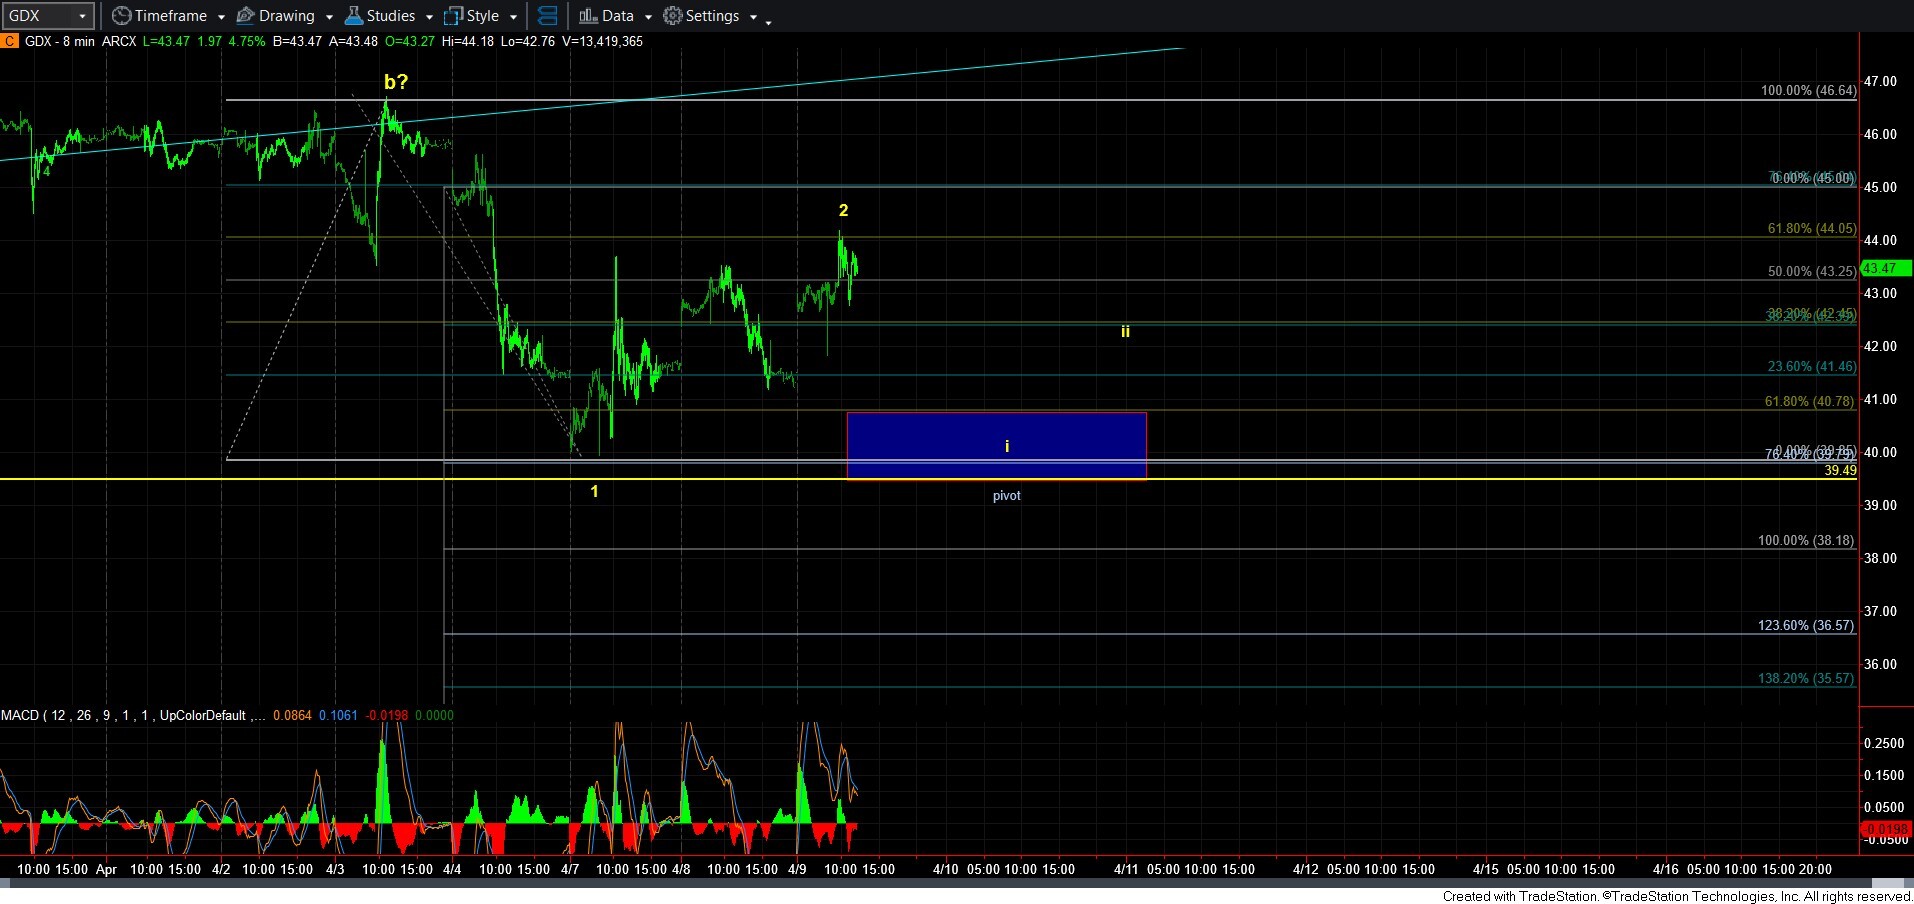
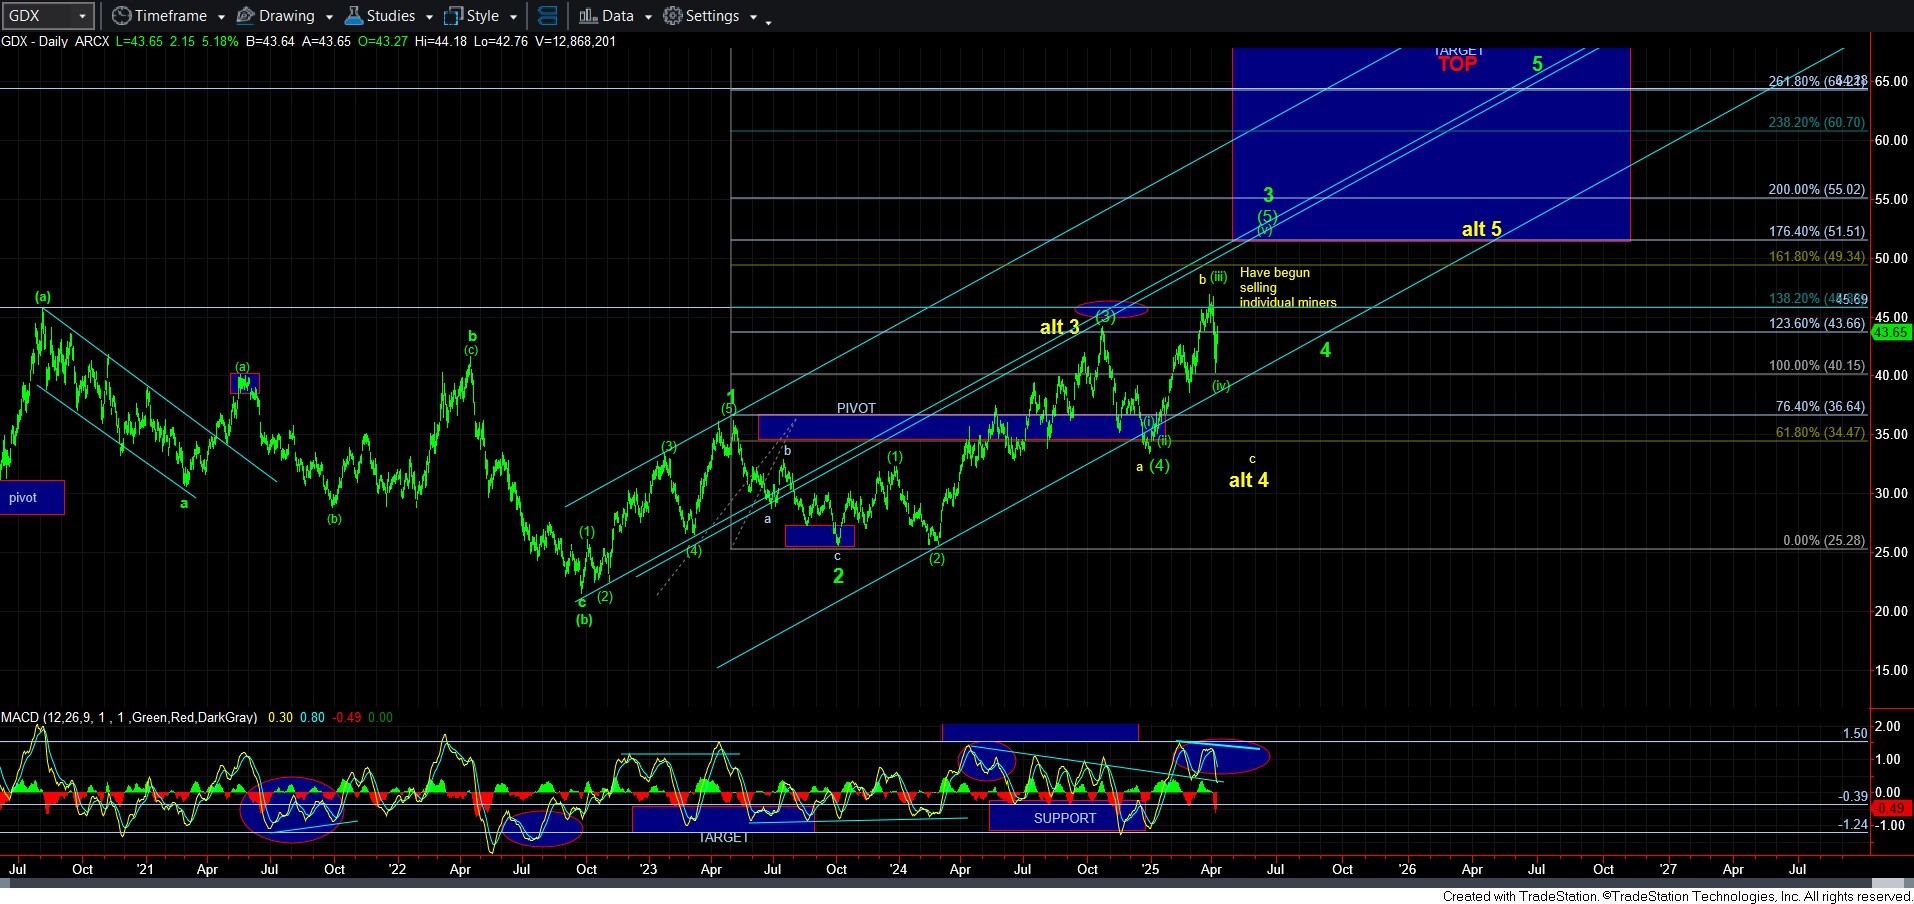
Now, GDX, which has also lagged, is not providing us with a clear micro expectation. The rally we have had over the three days has not exactly provided us with a clear 5-wave structure to signal that we are on our way to wave [v] of of [5] of 3 on the GDX daily chart. And, the yellow count relies upon a truncated b-wave top structure, which is not terribly reliable either.
So, as I said in the live video this morning, should I see another 5-wave structure to the downside which could turn this into a 1-2, i-ii downside set up pointing towards the 30 region, then this would become an actionable set up on the short side. The in-between perspective is that the downside set up would only represent a c-wave decline rather than a full 5-wave decline, but that still would likely point us to the 35-37 region, as it stands right now. For now, I am simply awaiting a bit more clarity in the smaller degree structure. Yet, I can say that I see nothing that is clearly immediately bullish at this time.
Gold also has two paths I am tracking, the difference between which I outlined in the live video this morning.
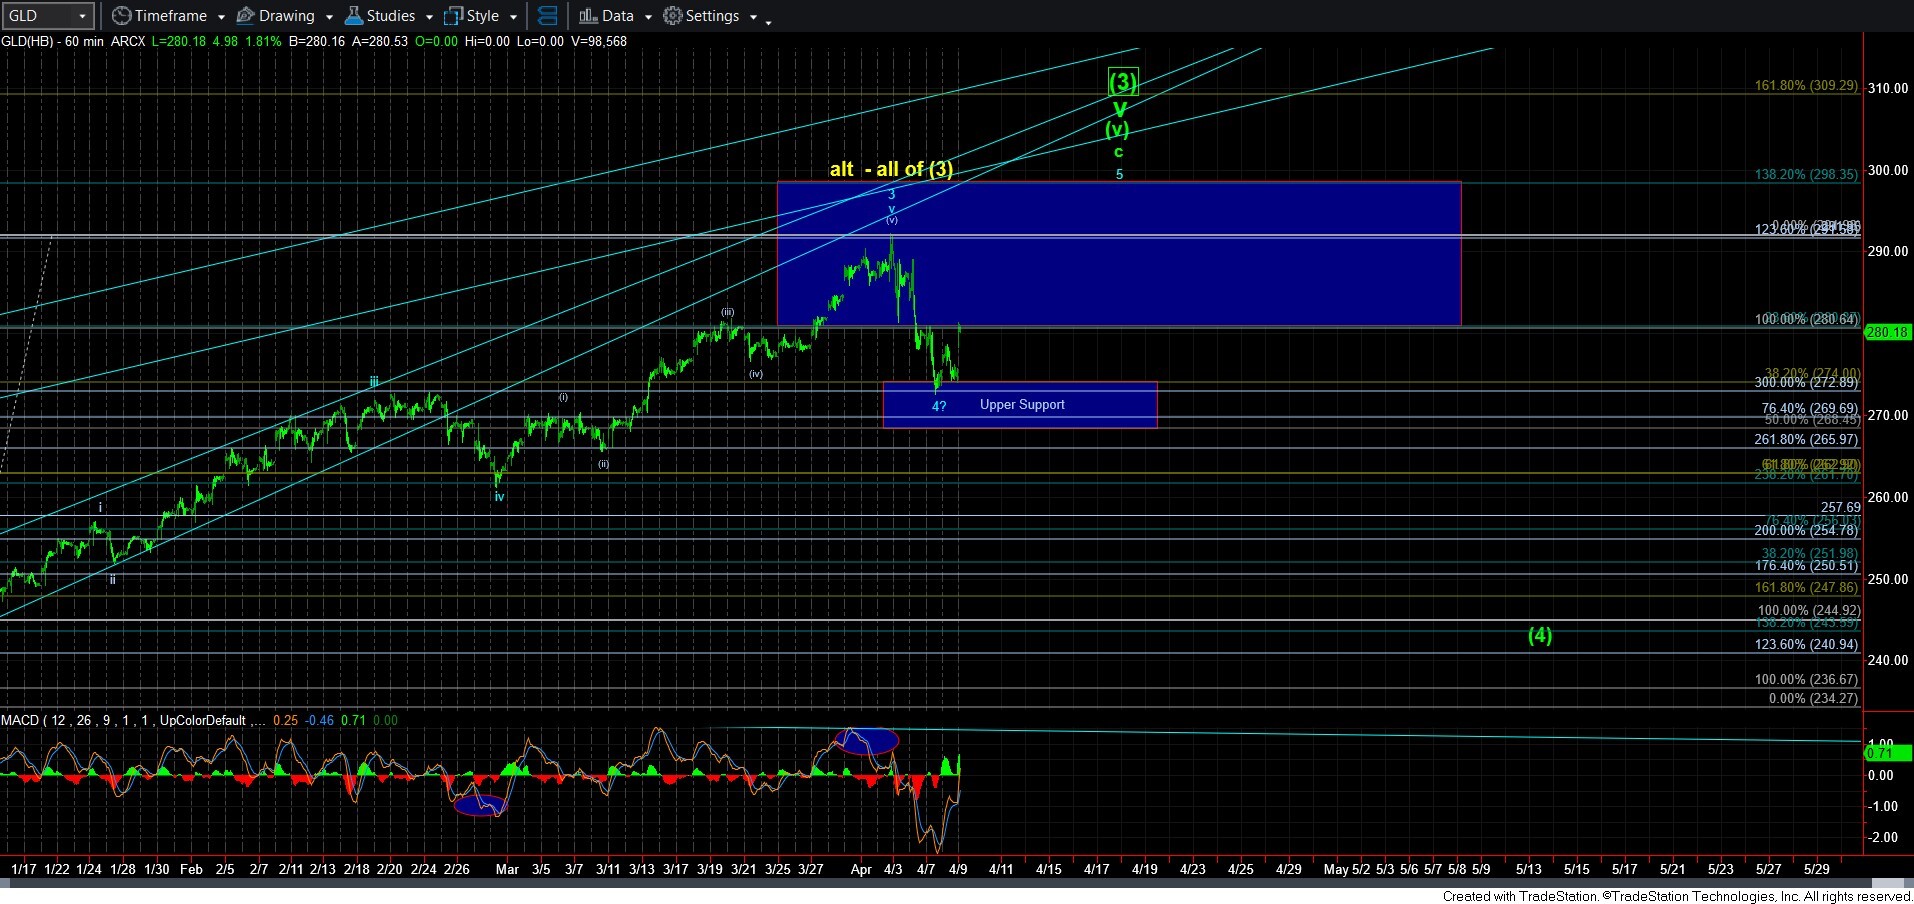
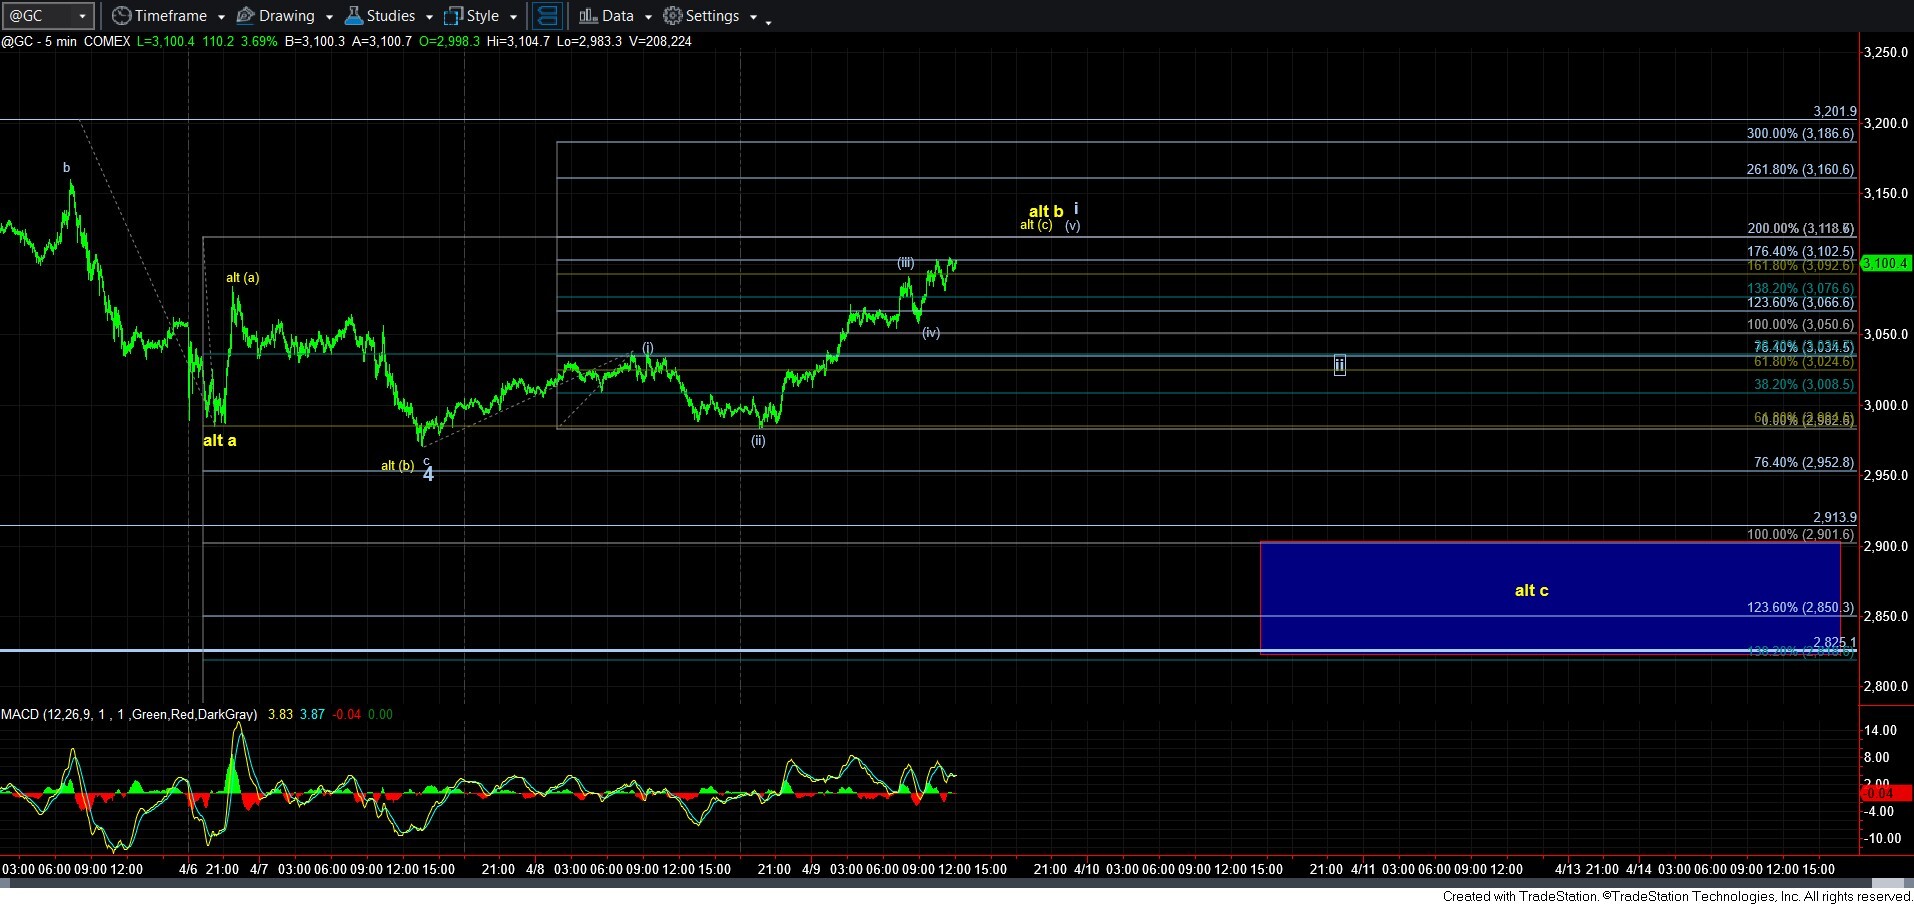
As you can see from the attached GLD chart, we have come down exactly to the top of the support box wherein one would expect to see a wave 4 pullback bottom at the .382 retracement of wave 3. Yet, I cannot say that I can give the “all-clear” just yet. You see, the 8-minute GC structure has an extra wave that really counts best as shown by the yellow count. So, I am going to allow the manner in which the market pulls back in the coming days tell us which is the applicable count.
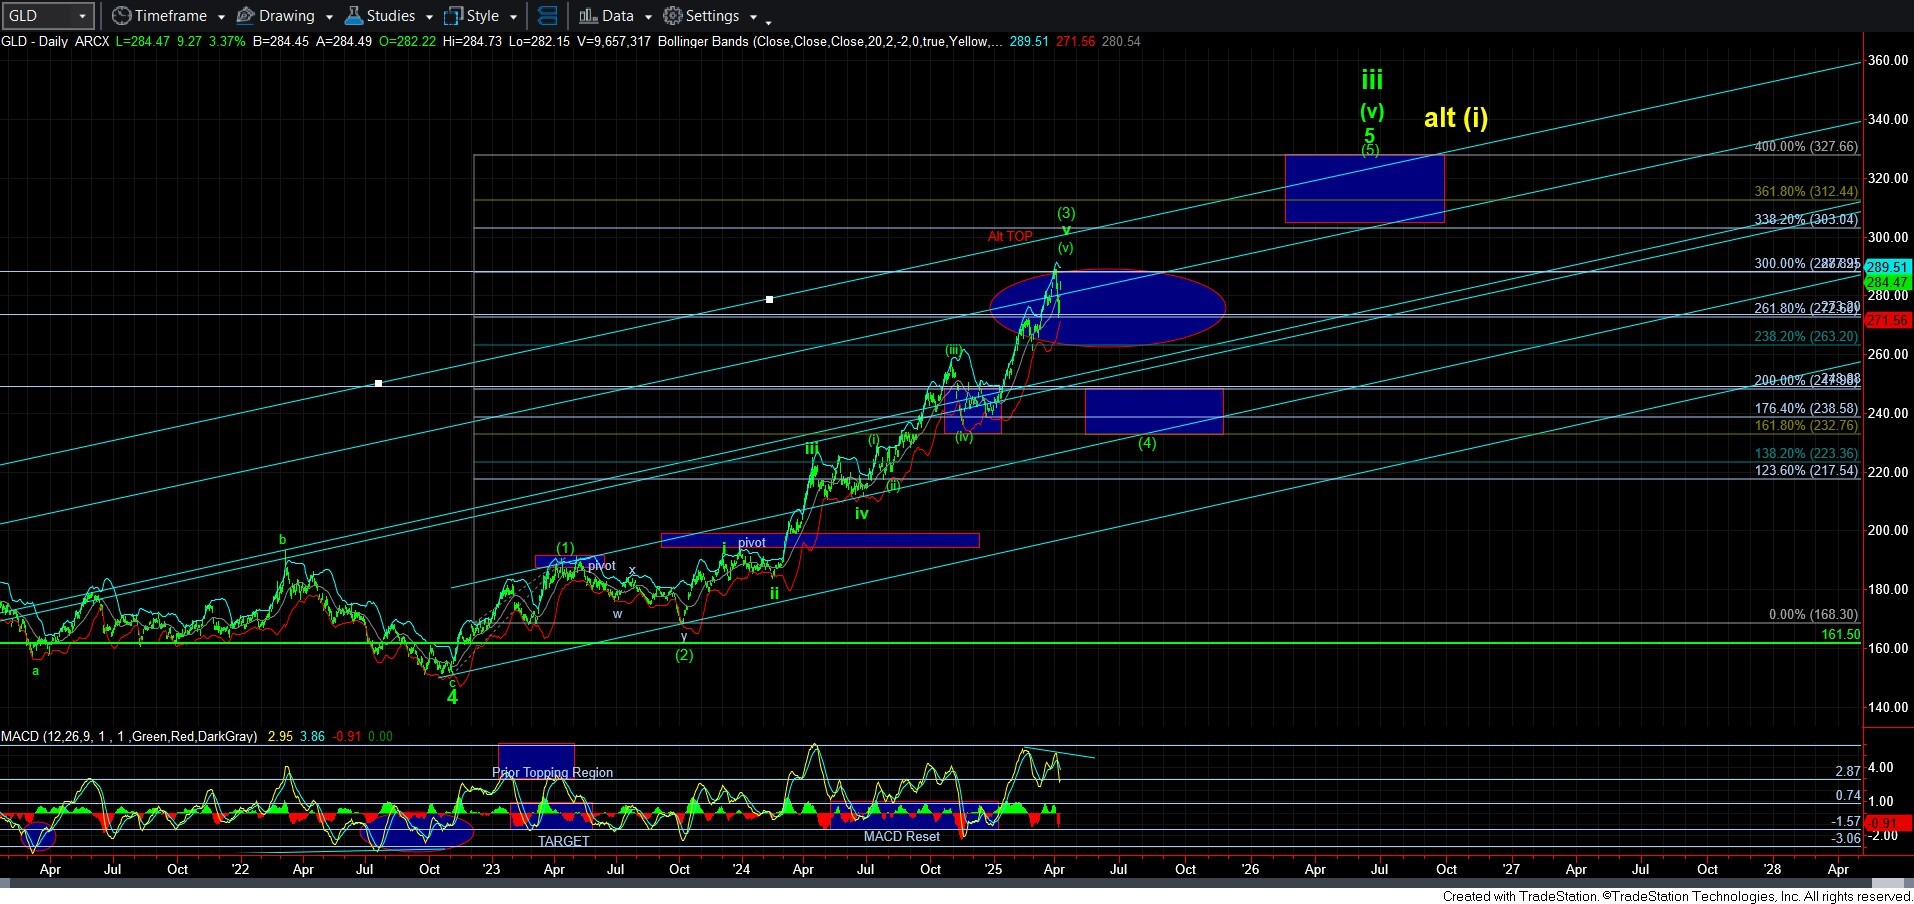
If we do see a corrective wave ii pullback, followed by an impulsive rally, then we are going to see a nice extension in wave 5 for gold. However, if the next pullback takes shape as an impulsive move lower, then I am expecting a test of the support box on the 8-minute GC chart. That decline will either represented a deeper wave 4, or it would be an a-wave of the larger degree wave [4] pullback on the daily and 60-minute GLD charts. We will know based upon the structure of the rally which develops off that support box.
For now, I still expect more upside action to be seen in the coming months in the metals complex. My only question now is where and how it begins. And, I do not yet believe we have seen the end to this bull market just yet.