TGT: Stay On Target
By Levi at Elliott Wave Trader; Produced with Avi Gilburt
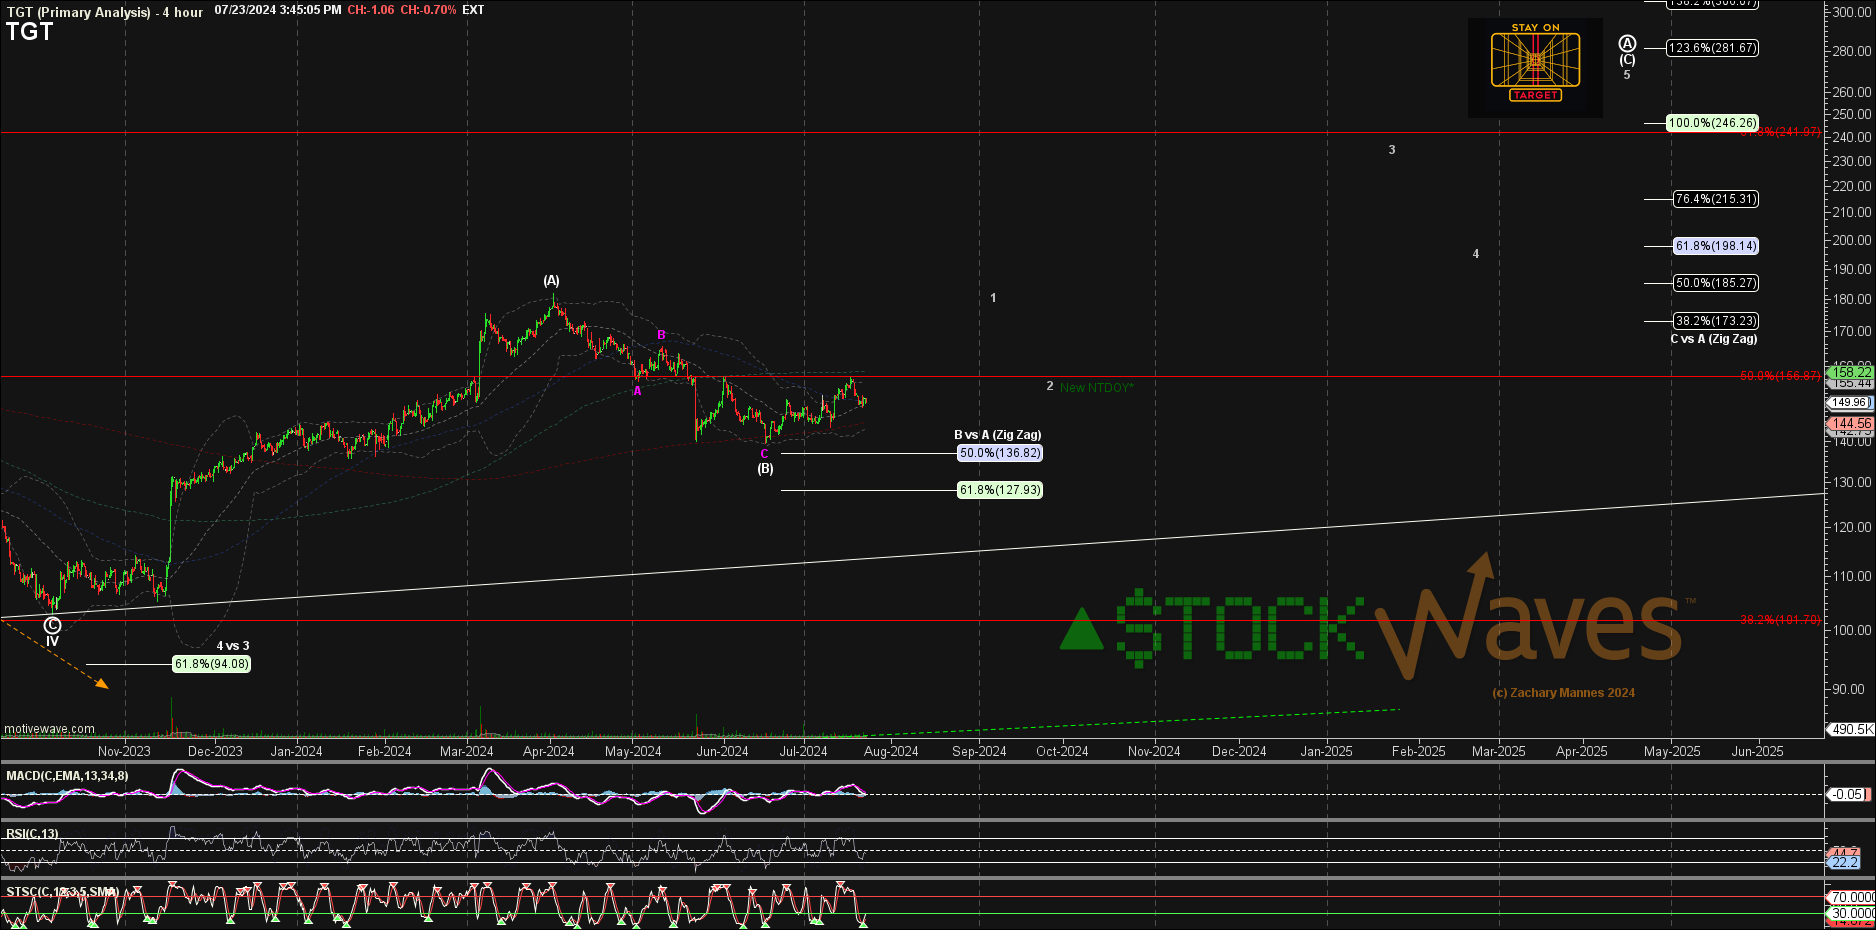
Any Star Wars fans (the original film) will get a kick out of Zac’s chart that he shares below. And for the true aficionados, they will readily recognize which scene it comes from. It also provides us with a starting point for this piece. We are able to identify a probable path forward for TGT. In the article we will share with you the methodology that leads us to this conclusion.
Where Fundamentals Meet Technicals
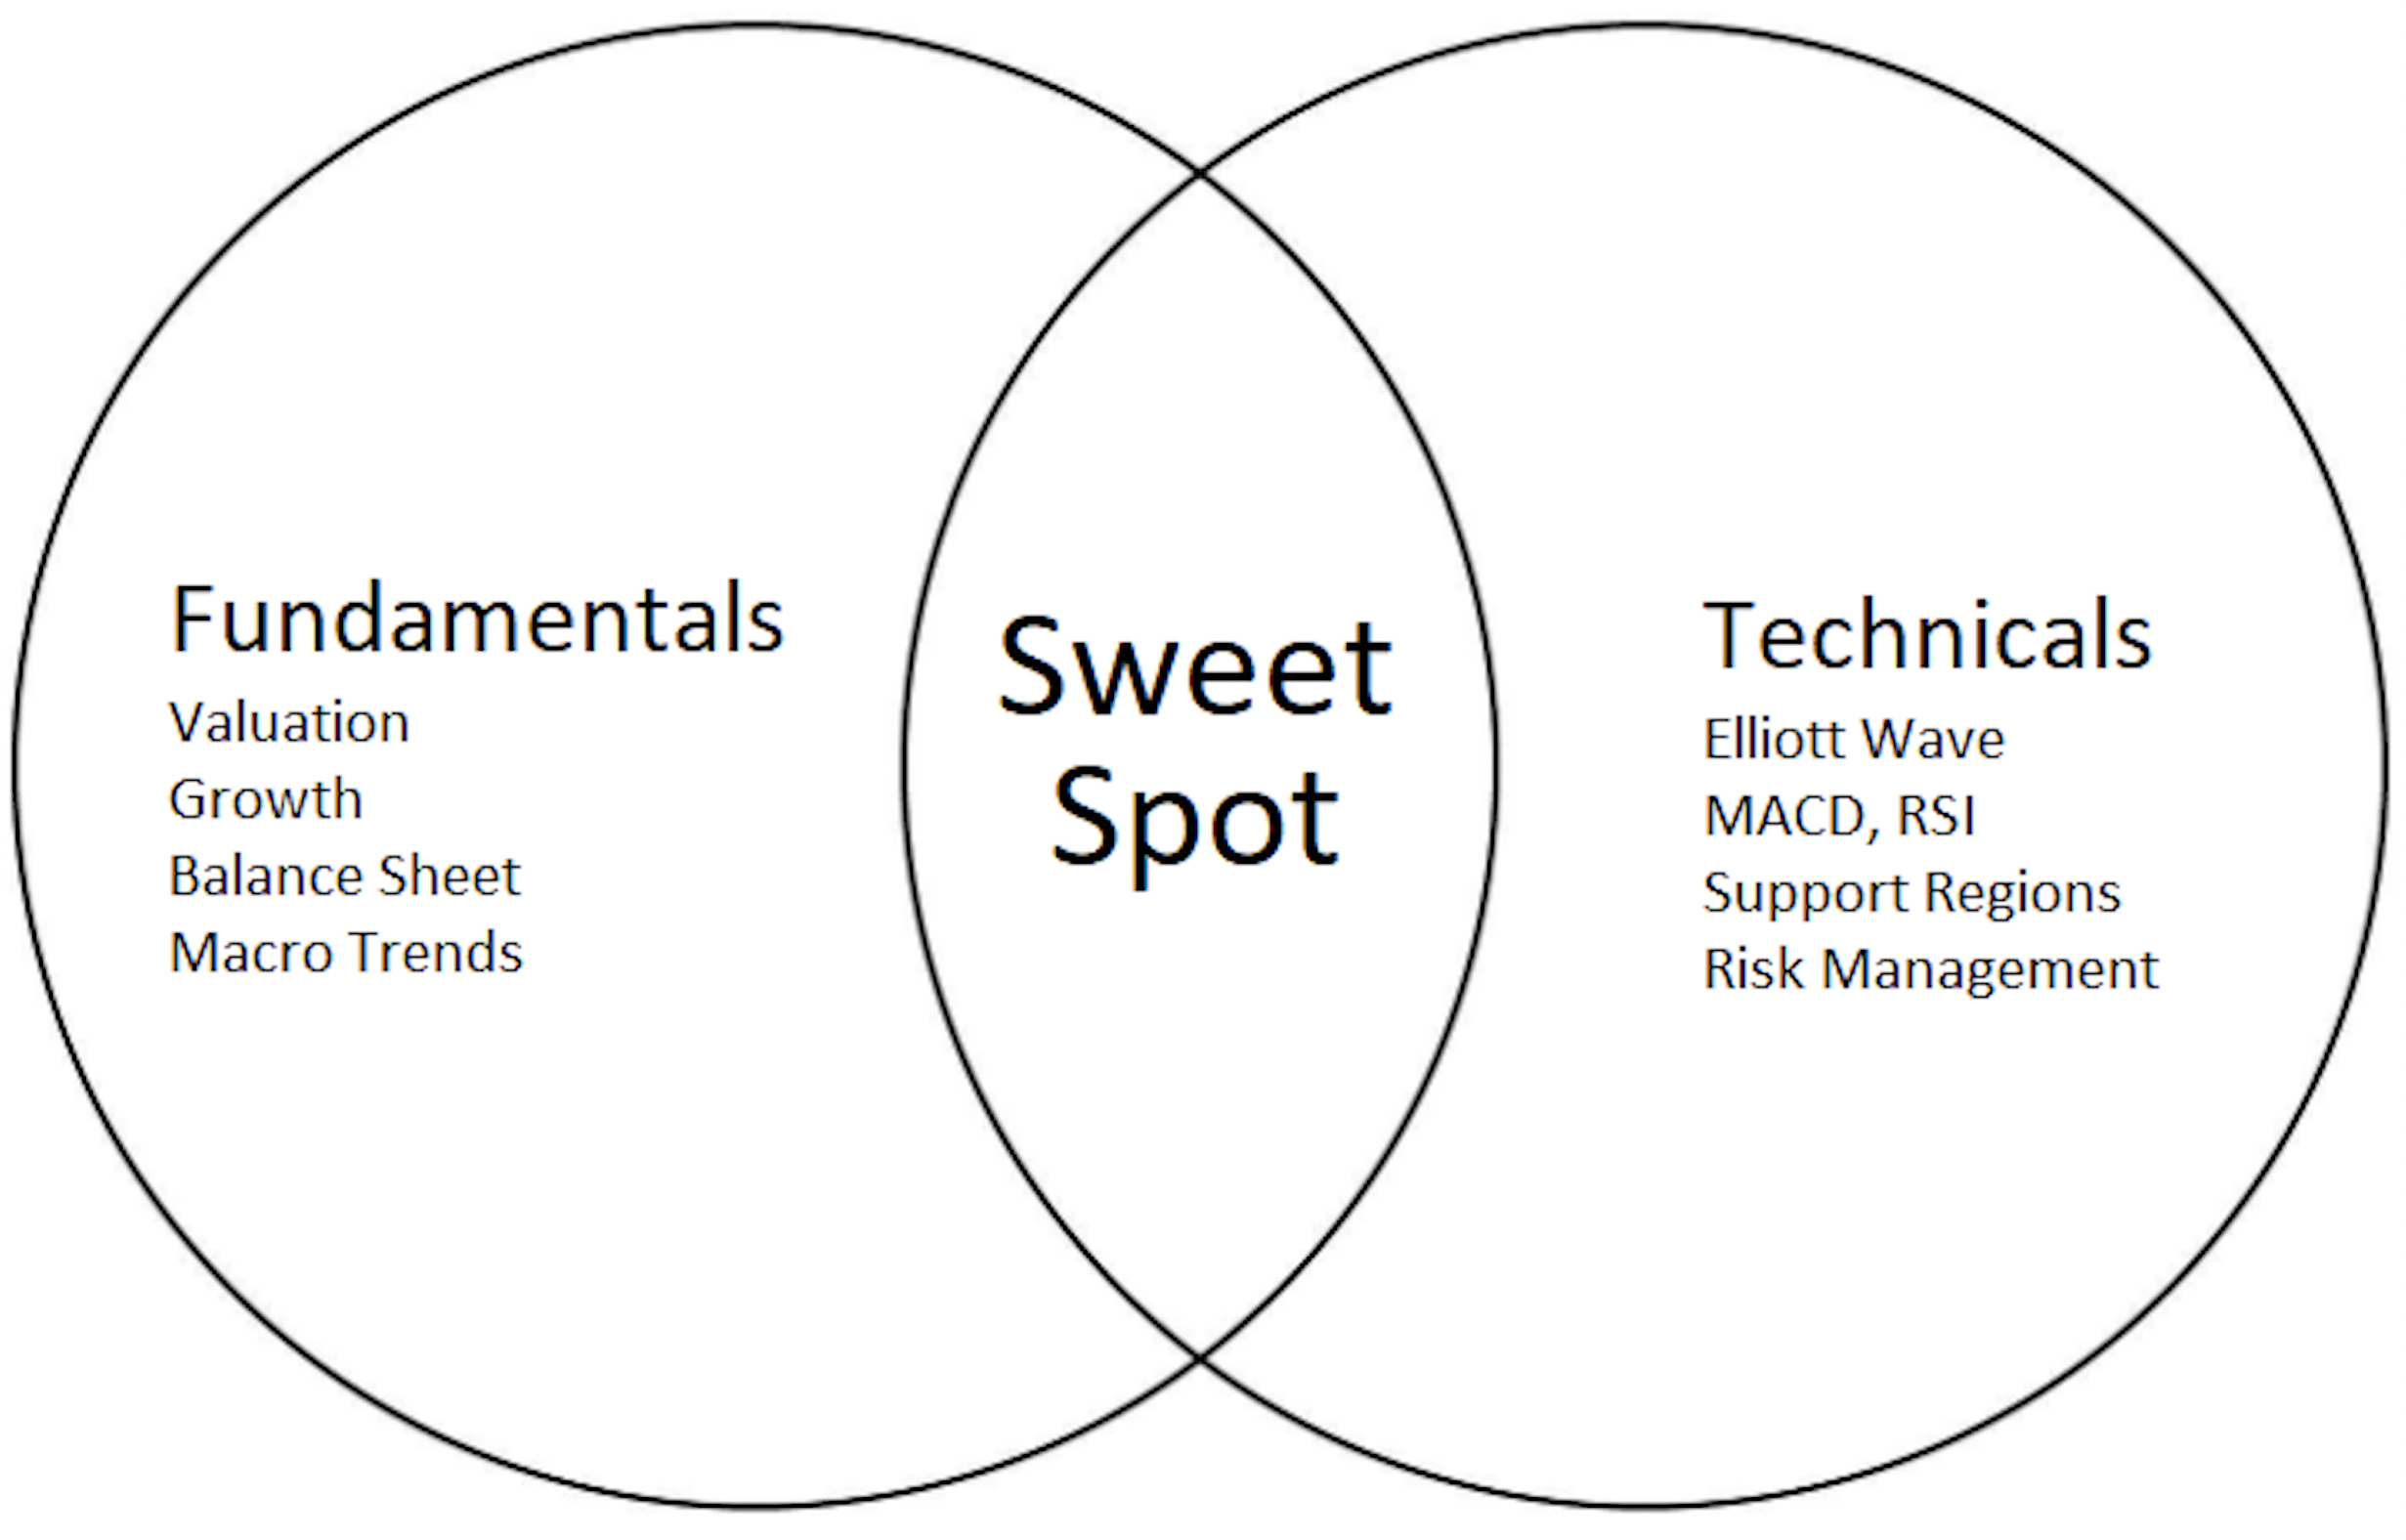
For those that have followed our analysis provided to the readership here you will know that we look for a sweet spot where Fundamentals meet Technicals.
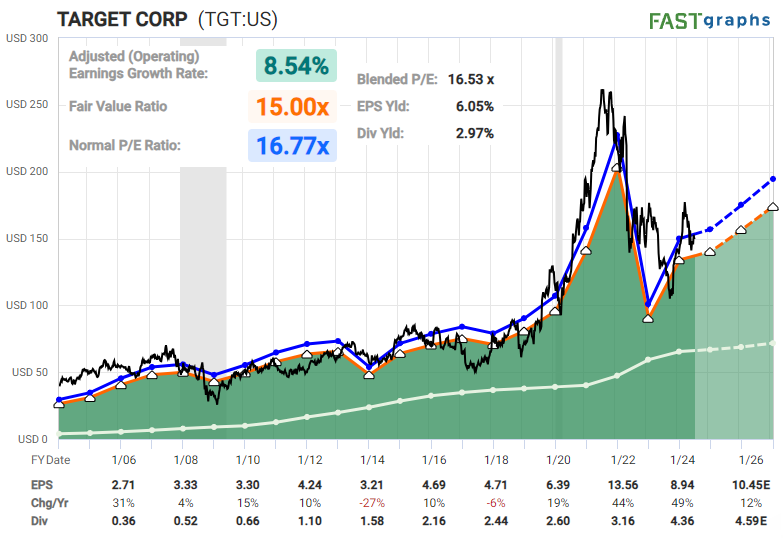
Particularly in individual stocks, we want to have an overview of the fundamental landscape. This is exactly what we do in looking for the synergy between fundamentals and technicals. As one of our lead analysts, Lyn Alden provides key information and data points for us in sectors across the marketplace. Let's get her current take on TGT.
"There's a good fundamental case to expect that TGT's bottom is in. They went through a period of earnings retracement and some publicity/boycott issues, but have shown some stabilization.
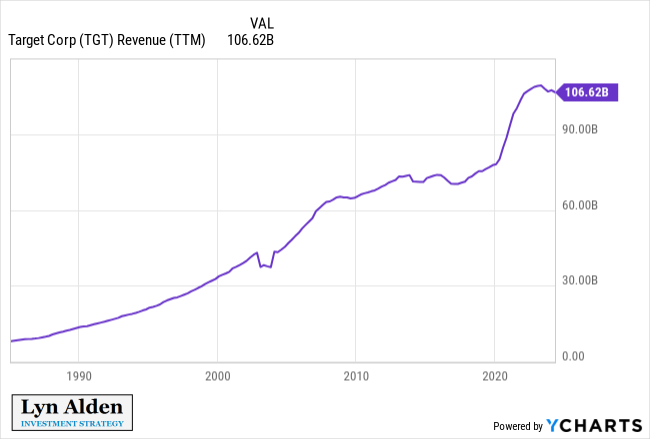
I would have more conviction on TGT once I see the revenue numbers stabilize as well. Neither COST nor WMT have had the revenue slump that TGT has had, but then again they trade at 2x or 3x the earnings multiple that TGT does. So once TGT does show further signs of stabilization, that could be interesting. For now, an investor could begin with the base case that stabilization is occurring, with stop losses on the recent higher-low as a risk management tool.” - Lyn Alden
Well, Hello Technicals
I will tell you though that these are not the technicals that you are familiar with in the traditional sense. For fans of traditional technical analysis, terms such as MACD, RSI, stochastic fast and slow, trendlines, and the like seem to brighten their eyes when mentioned. And they are tools that many use in their analysis. Allow us to introduce you to an entirely new way of viewing the markets. While some may label this as “Technical Analysis”, it’s really more the study of human behavior as manifested by the structure of price on a stock chart. Here is one specific case study in TGT.
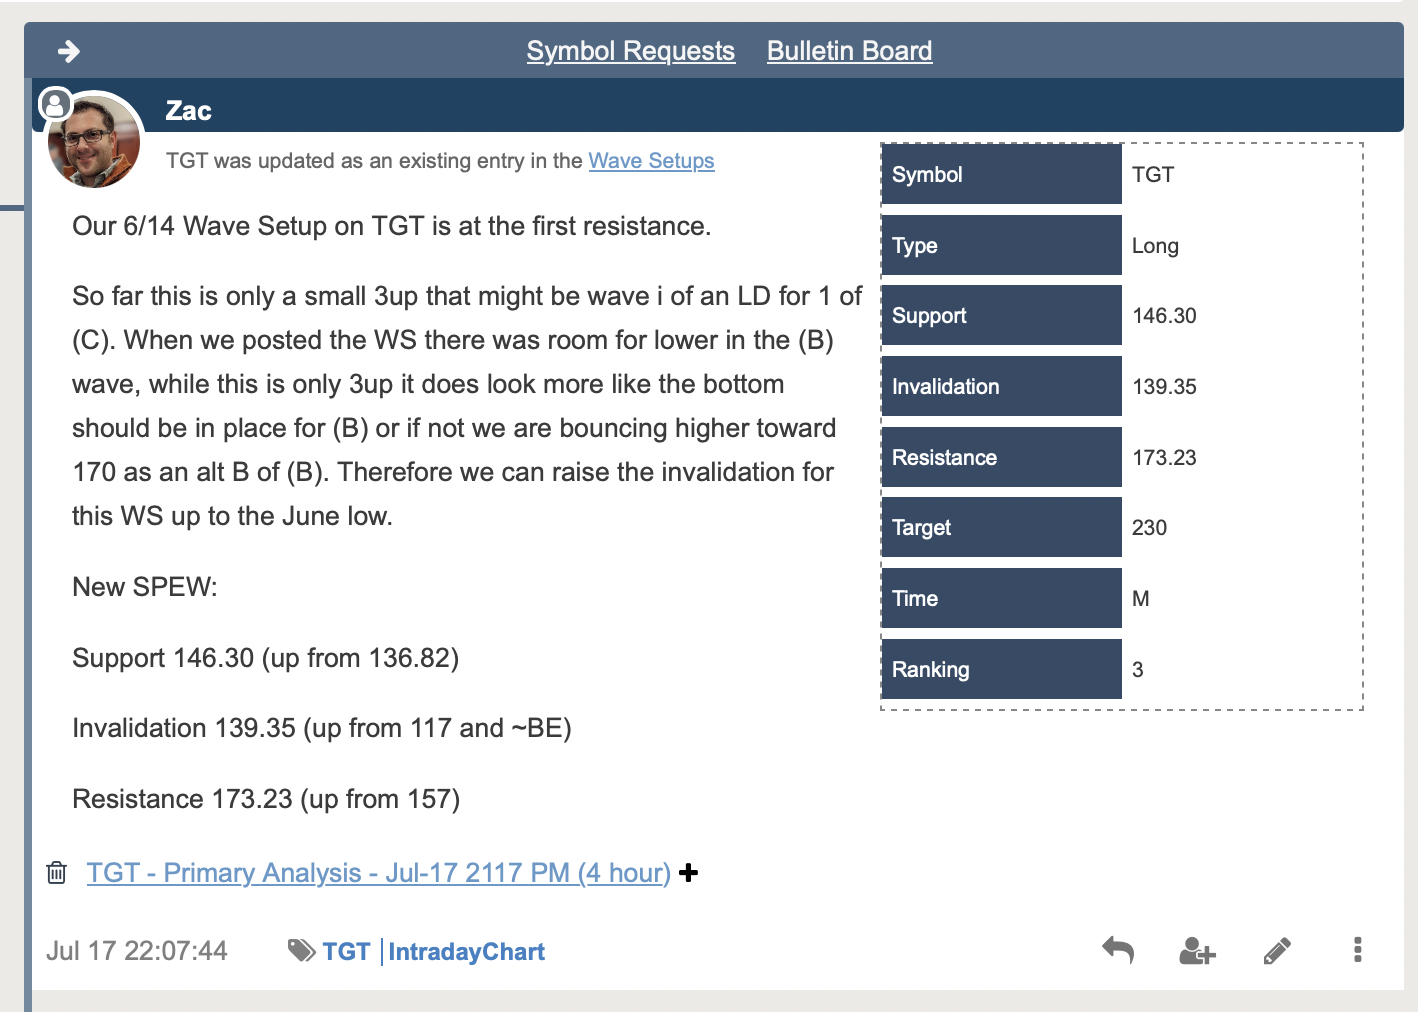
One highly useful feature we use is called Wave Setups. Below is a recent example for the ongoing setup in TGT.
Note how there are key levels to act as waypoints in the journey. These will give us either further confirmation of the setup or will tell us when any adjustments are needed. Or, perhaps even when this one scenario would invalidate. Zac has also provided a chart to illustrate the setup.
As you can see, the low struck back in late 2023 appears to have been a major turn in price. That is labeled as a Primary C wave of a larger wave IV. Naturally, V follows IV, so we will anticipate much higher prices for TGT in the months and possibly even years to come. How might this multi-month rally shape up?
Note that Zac is plotting wave V as potentially an A-B-C structure inside that larger wave up. And inside the initial Primary A wave up, it is also subdivided as an A-B-C. Waves [A] and [B] look to have completed. So, we are now looking for wave [C] of the Primary A of the larger wave V to now fill in. This should be a 5 wave structure and price is likely inside wave 1 of that rally.
Once waves 1 and 2 complete, it will give us an even more probable target to project overhead for the entire wave [C] of Primary A.
What Truly Leads The Markets?
We follow the fundamentals with Lyn Alden. Fundamentals are important. However, they typically will frame a thesis for a 3 to 5 year time period. As well, we have observed that fundamentals rarely lead the stock price on a chart.
So, if it isn't fundamentals that lead, what is the driving force of important turning points in the markets? Sentiment. Simply put, fear and greed that battle against one another until the force of one overpowers the other.
Sellers will exhaust themselves at bottoms and buyers famously flame out at tops. All have observed fundamentals that get strenuously stretched to what appear to be absurd valuations to both extremes. Markets seem to be what we deem 'irrational' at these points. This is because markets are not logical, thinking entities. They are fluid, dynamic and non-linear in nature. Markets are sentiment in action before our very eyes.
Note this brief excerpt from an article that Avi Gilburt wrote regarding what truly moves markets. The piece was entitled, 'This Analysis Will Change The Way You Invest Forever'. In part-2 (you can read it here) of the six-part series, Avi shared this point regarding Ralph Nelson Elliott's market research and findings:
In 1941, Elliott stated, regarding the financial markets, that "[t]hese [Fibonacci] ratios and series have been controlling and limited the extent and duration of price trends, irrespective of wars, politics, production indices, the supply of money, general purchasing power, and other generally accepted methods of determining stock values." As you can see, the more research conducted into this subject, the more support we find to Elliott's theories set out almost 100 years ago.
There are many ways to analyze and track stocks and the market they form. Some are more consistent than others. For us, this method has proved the most reliable and keeps us on the right side of the trade much more often than not. Nothing is perfect in this world, but for those looking to open their eyes to a new universe of trading and investing, why not consider studying this further? It may just be one of the most illuminating projects you undertake.

