Tariffs Or Not, Here Comes NIKE
 By
Levi
By
Levi
By Levi at Elliott Wave Trader; Produced with Avi Gilburt
- Go back with us to more than two years ago as we review the projections made in StockWaves for NKE and how they aged since.
- We will discuss why this played out as it did even though many at the time doubted the stock would strike as low as it did.
- Then we will look forward to see what the larger structure of price suggests is most likely next.
There has been and likely will continue to be those that will claim causation for this move down is squarely on the shoulders of tariffs. Is this really the case? Let’s take a look back at when NKE actually saw its peak - November 2021. Tariffs were not even on the investor chalkboard yet. This current downtrend from the 2021 high of $179 was already well underway.
So, what did cause the move all the way to the $51 level late last week? In a simple word - Sentiment. First, please allow me to illustrate what we were seeing more than two years ago via some key charts from Zac Mannes. That will then bring us to today. After, we will discuss how we arrived at these projections. Finally, what these are telling us is on deck for NKE.
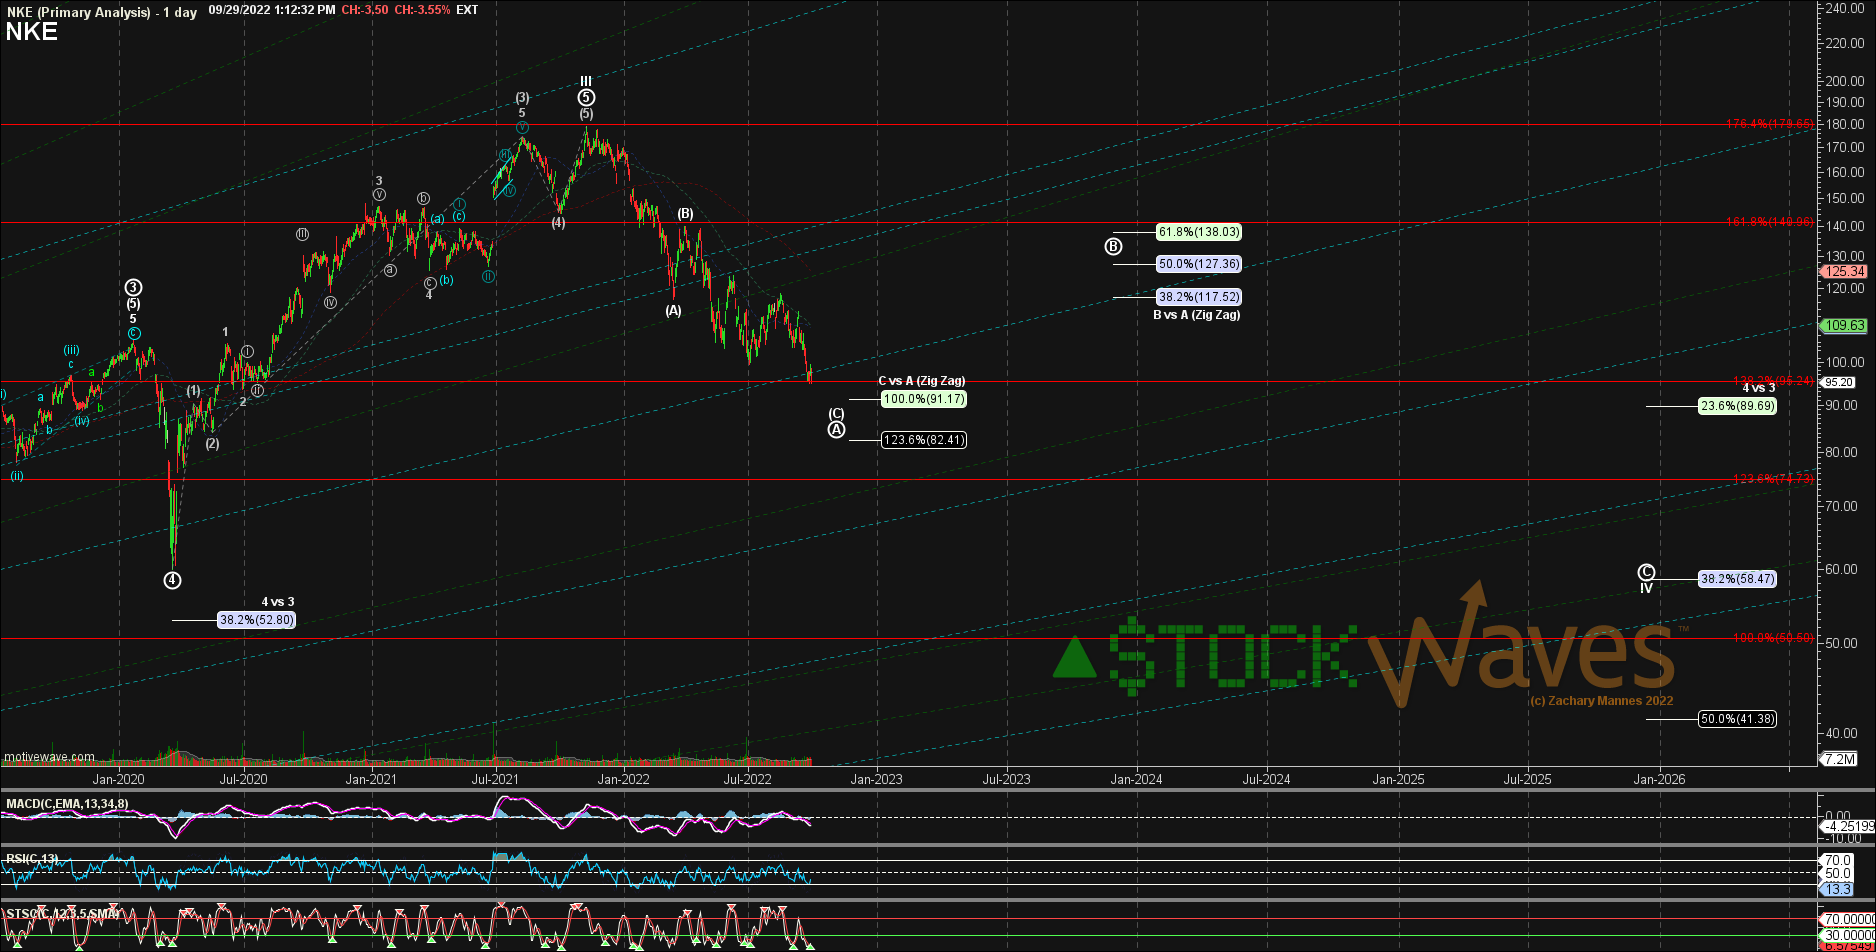
This first memory is from late September 2022. You can see on the time/date-stamped chart that Zac was anticipating a low in primary wave ‘A’ of the larger cycle IV correction. As well, keep in mind that he was also projecting the primary wave ‘B’ bounce and final low in primary ‘C’ of IV. What’s also standout is that the typical retrace of this entire move was set at the $58 level. Now, this is more than two years ago. How did this all end up aging for this chart? I’m glad you asked - let’s see.
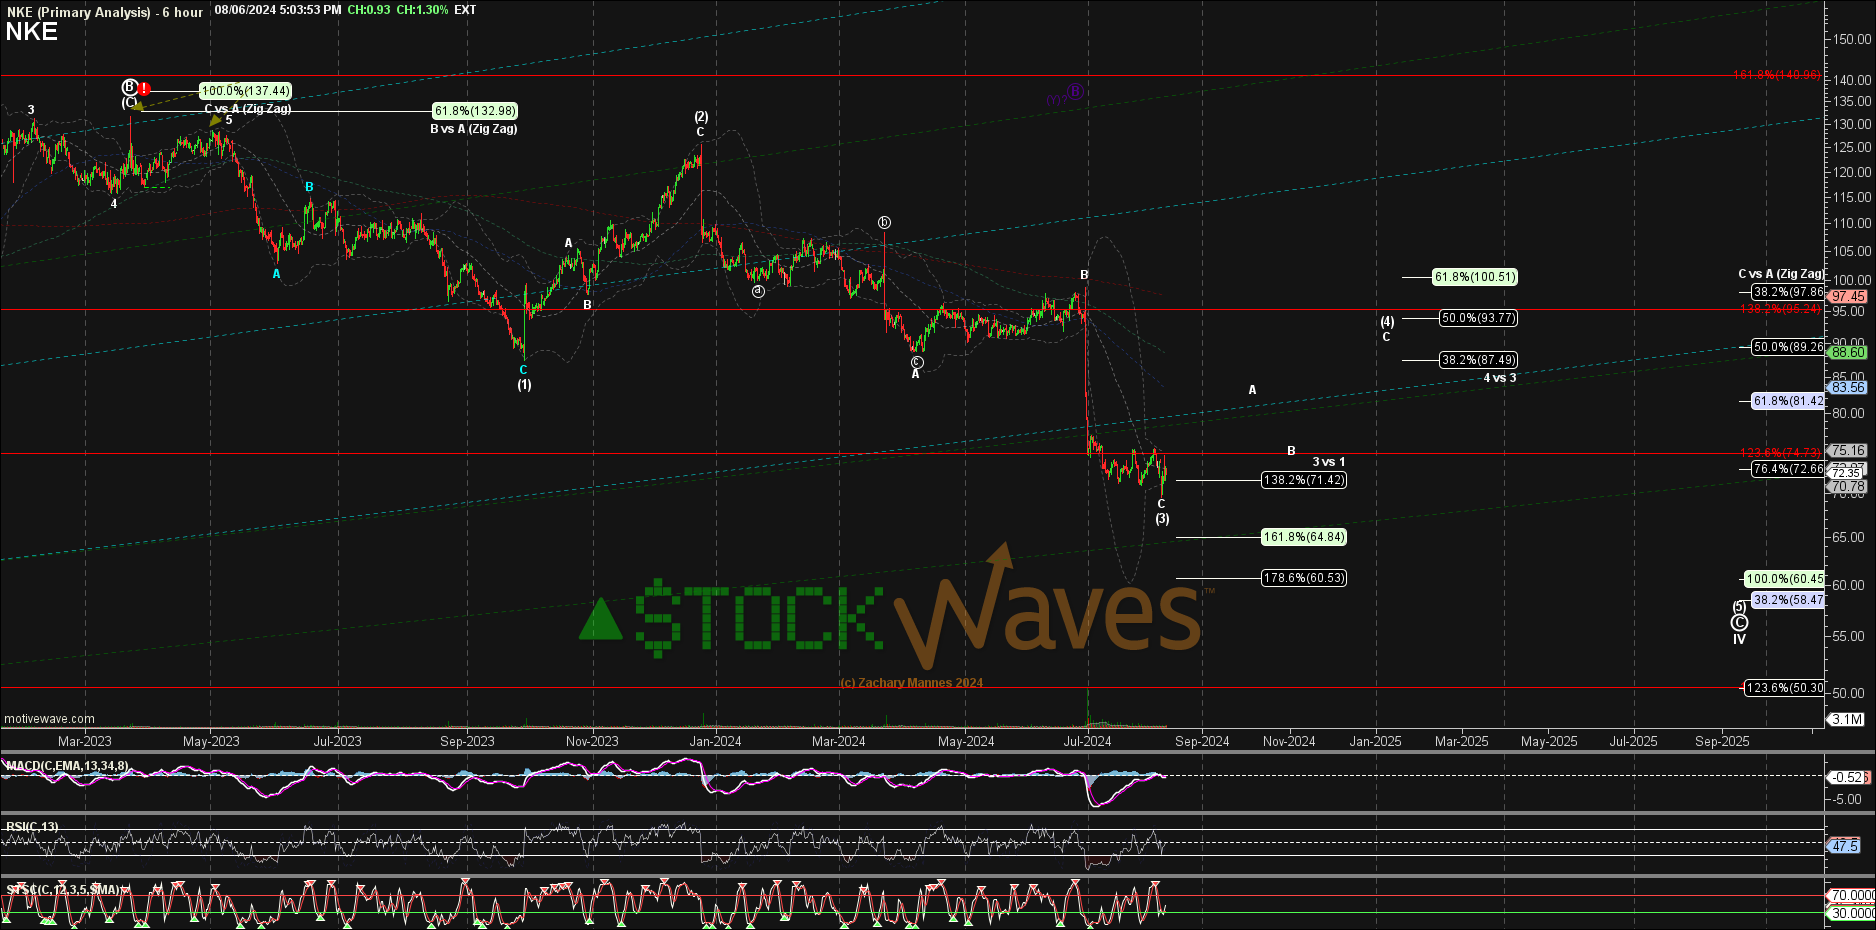
Fast forward now some 22 months. What has happened? Primary wave ‘B’ did indeed strike its ideal target in the $130’s and then kicked off the Primary wave ‘C’ crash-like move from $133 down to the last low at $52 just last week.
It still was not time to look at this one for a potential long-term investment scenario. There were yet subwaves to complete.
Now, how did Zac possibly project this entire move from two years ago? The answer remains the same - Sentiment. Please let me share with you why this works.
The Structure Of Price Speaks Volumes
Avi Gilburt has frequently commented regarding our use of Elliott Wave Theory with the overlay of Fibonacci Pinball:
“As an investor, your job is to objectively understand the market in order to maintain the correct side of the market action. Unfortunately, most investors follow specious market theories because it makes them feel as though they have a certain amount of control over the market if they can come up with a reason for the market move, no matter how contorted that reasoning may be. Yet, you must come to the conclusion that such control is an illusion, in the same way that much of the analysis leading to such a false sense of control is intellectually dishonest.
As for me, I simply apply a mathematically-based approach to the market price action, which tells me rather objectively if my analysis is right or wrong and allows me to adjust rather quickly when I am wrong so that I am not adopting and trading false beliefs of the market.” - Avi Gilburt
Using this mathematically based analysis methodology, we can project probable paths for NKE, but also when we would need to shift our primary scenario and where it even might invalidate. Does your current system allow you to do this? Over many years of keen observation and in-depth study, we have come to appreciate that Elliott Wave Theory, when correctly applied, is the only method of analysis that provides us with market context at any moment in time. What is this telling us about NKE, and where is it likely to go next?
What Context Tells Us About What’s Next For NKE
While there are some keen nuances in our work that we must follow and abide by, some simple truths also exist. One of the most basic is that 5 always follows 4. Yes, I say that just a bit tongue in cheek, so please forgive me if it comes across a bit glib or too light-hearted. But, next is how that simple truth fits into our discussion. Please keep reading for more insight.
When we zoom all the way out on the NKE chart with the high for Cycle wave III at $179 and the potential low for Cycle wave IV here at $52 or perhaps just a bit lower, then we have the context for a Cycle wave V move much higher from current levels. That’s the main overview and key takeaway from this analysis. What parameters can we share to provide potential guidance going forward? Let’s have a look at these.
What To Look For In The NKE Chart
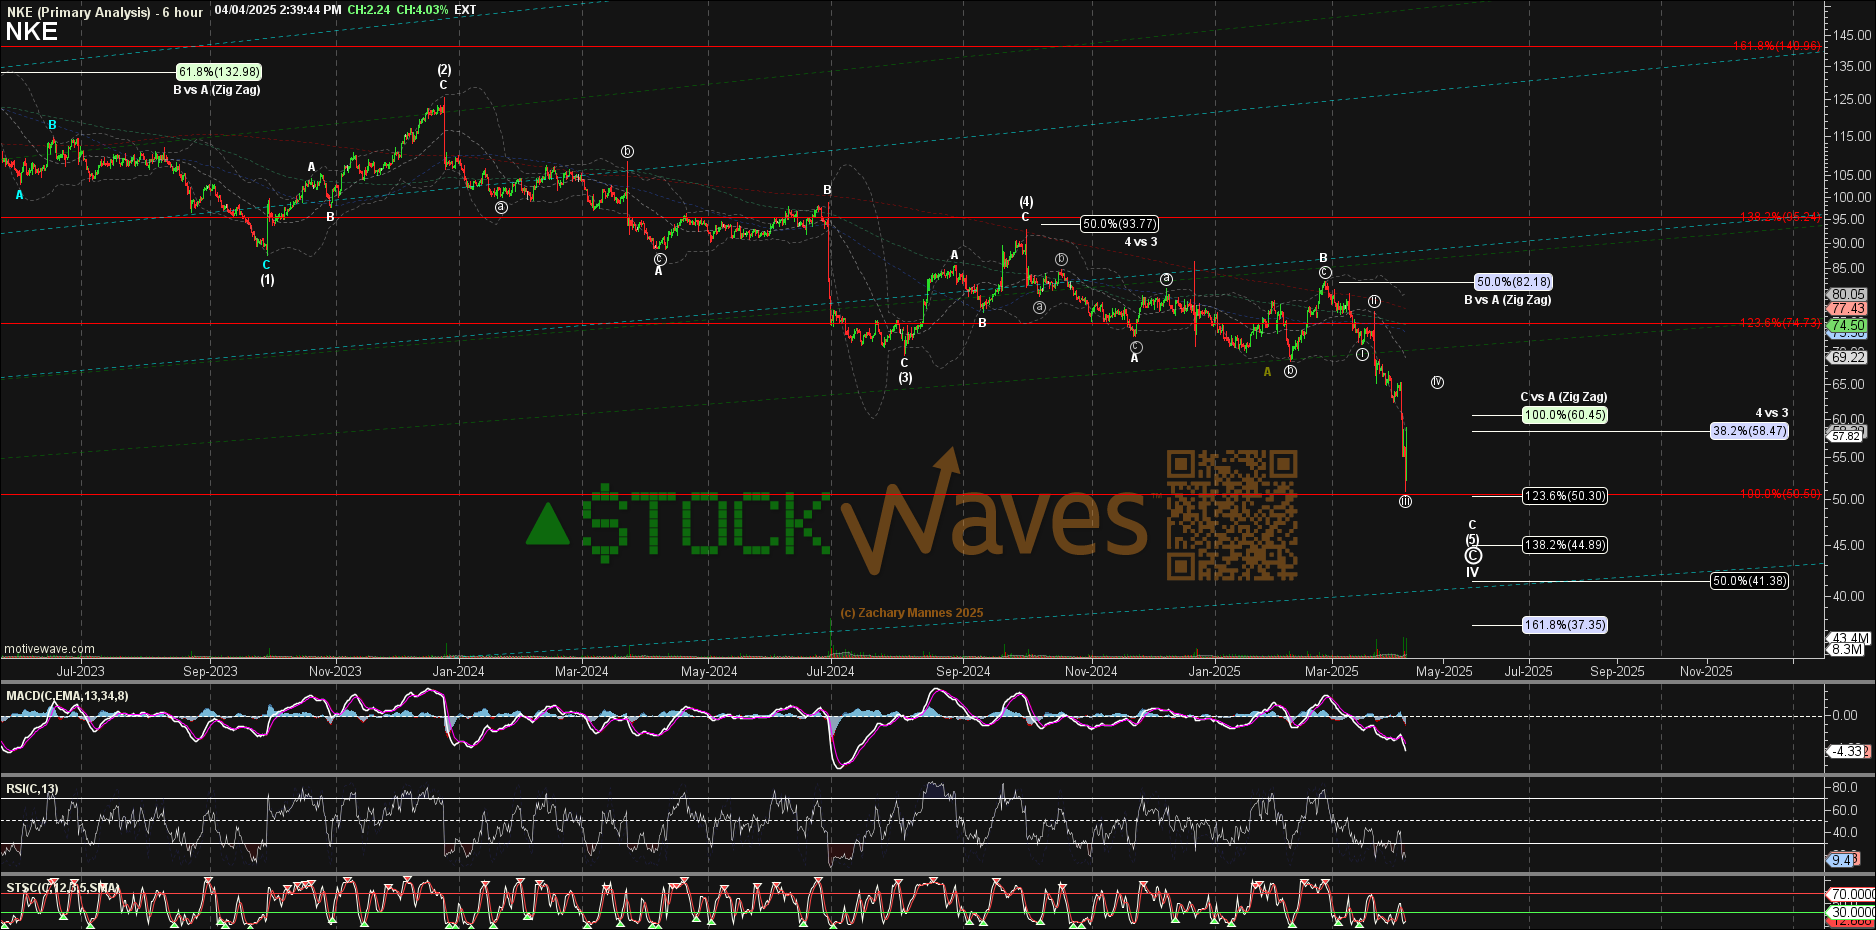
Here’s where we find ourselves at the moment. The low struck at the $50.89 level pre-market Friday morning has the potential to be all of C of (5) of Primary ‘C’ of IV. However, price would need to prove its bullish intent with a move above $60 and follow through above $66. Until that takes place it seems more likely that the low on Friday was wave circle ‘iii’ and that a corrective bounce just filled out with the move to $59 as circle ‘iv’ with ‘v’ to follow.
If instead price moves above $60 then this may have already found a low at $50.89. In any event though, the larger structure of price appears to be at or quite near a pivotal low for NKE. We will closely monitor this structure as it continues to unfold in what is to be a multi-month rally should our primary scenario play out as drawn up.
Conclusion
Markets are emotional. They are irrational. In their wake, they can leave the seemingly most intelligent and logical among us battered, bloodied, and abandoned. Striving to constrain the markets in a linear box of reason and clean geometry will exhaust the brilliant and mercilessly bash the bravest.
This, of course, does not leave us in the lurch. A system is needed to bring structure to the apparent madness. We have such a system in place, it is the very foundation of our methodology.
Please keep in mind that we provide our perspective by ranking probabilistic market movements based on the structure of the market price action. If we maintain a certain primary perspective as to how the market will move next, and the market breaks that pattern, it clearly tells us that we were wrong in our initial assessment. But here's an important part of the analysis: We also provide an alternative perspective at the same time we provide our primary expectation, and let you know when we might adopt that alternative scenario.
(Disclosure: I/we may initiate long positions over the next 72 hours in NKE stock according to the parameters set forth in this article.)
