The Market Is Setting Up For A 500 Point Move
With the market topping out this past week just above the .382 retracement of the recent decline from the all-time highs, there are a number of ways to interpret this action. So, I am going to continue to elaborate on the paths we have been tracking, but I am also going to note two additional ways to view the action for the various reasons I will explain below. So, as I said in my updates over the last week, I still think we could be setting up for a 500+ point move in the coming weeks and months, and the market should clarify the path over the coming weeks.
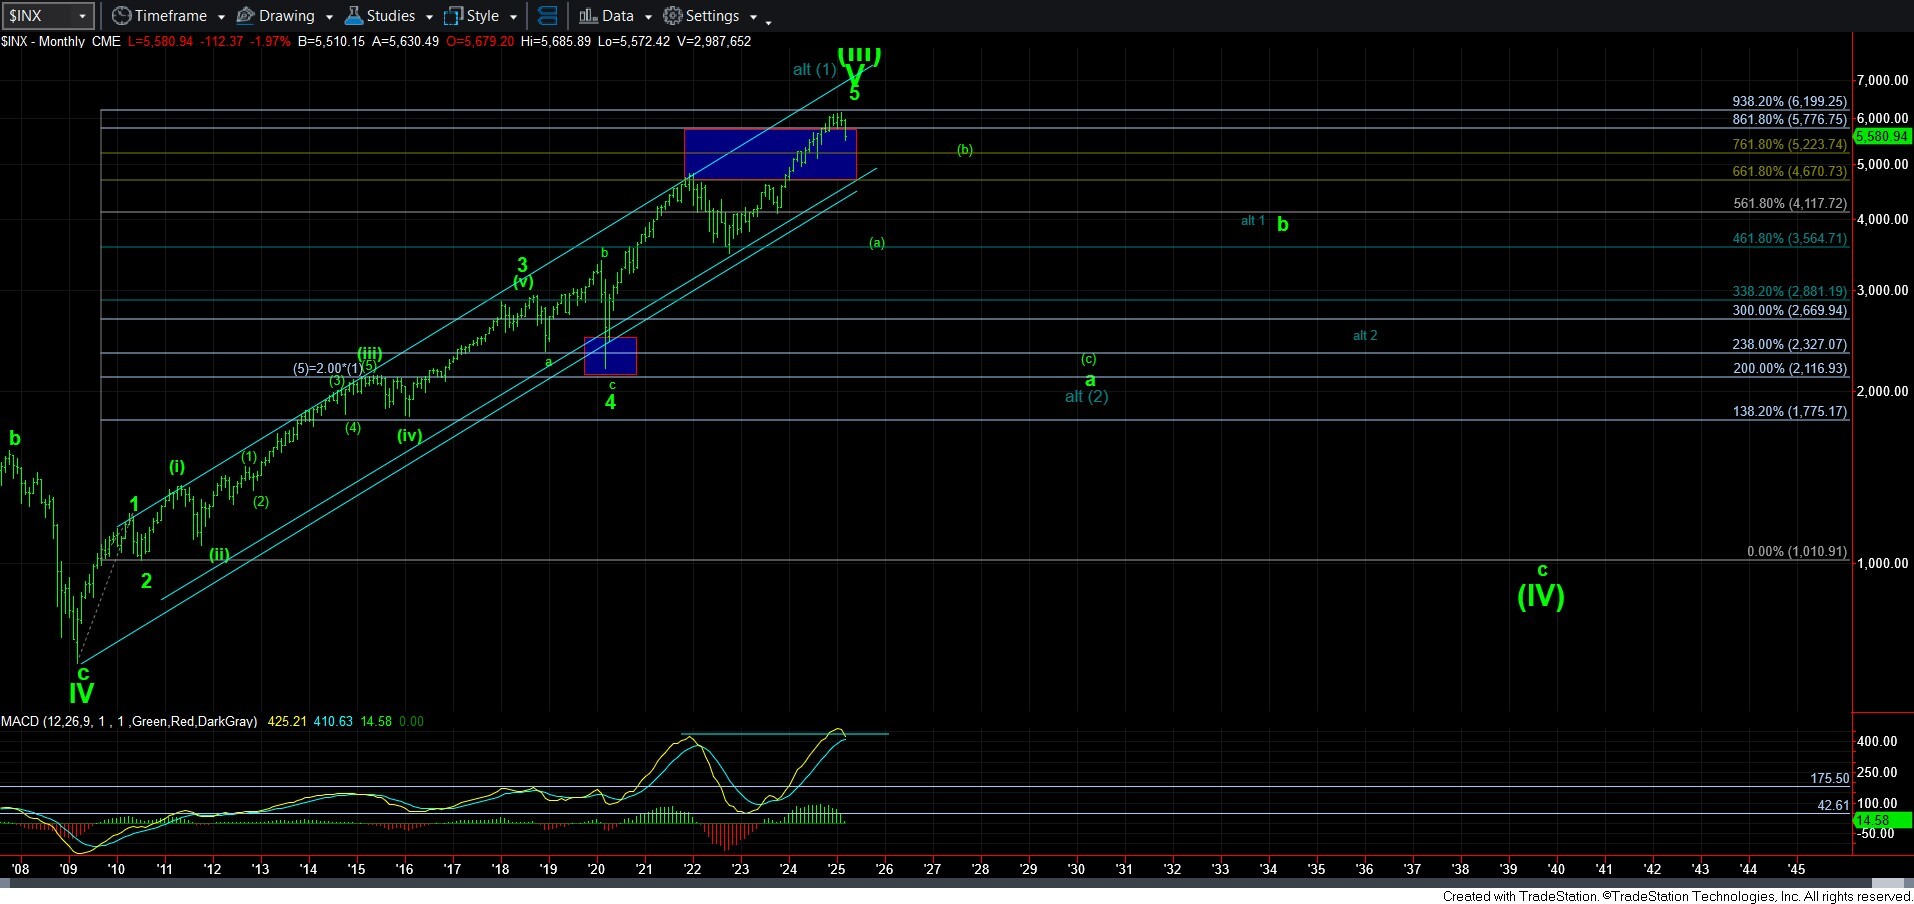
As many of you know, I have been quite cautious of this market for the last year or so despite the overly bullish mantras being presented across the internet and media. And, the main reason was due to the larger degree expectation I have presented based upon the long-term trend from the 1932 low, as we are likely concluding a 3rd wave of immense proportions, which will have lasted for almost 100 years.
While the expectation of a long-term bear market which could potentially last as long as two decades is not something that any investor should take lightly, it is further exacerbated by the fact that the Fed has created a false sense of security for investors worldwide. Indeed, each time the market has seen a major decline, investors have been trained to believe that the Fed has the ability to save the market. Most investors are so convinced of the Fed’s ability that they will risk their life’s savings on this premise, and continue to “buy the dip” during each and every market swoon.
I do not intend to deeply delve into why this is an incorrect perspective with which to view the market in this weekend’s update, but I am going to refer you to an article I wrote in 2021, which outlines my view as to how market participants have been trained by the Fed in a Pavlovian manner, just as the moral hazards created by our governments and central banks have risen to historic proportions. I strongly encourage you to read it again.
https://www.elliottwavetrader.net/trading-room/post/6736638
So, of course, the million-dollar question is if we have finally entered that bear market? And, those that have been following my work closely know that we are looking for specific signs to confirm that potential, which I have outlined in many past weekend updates.
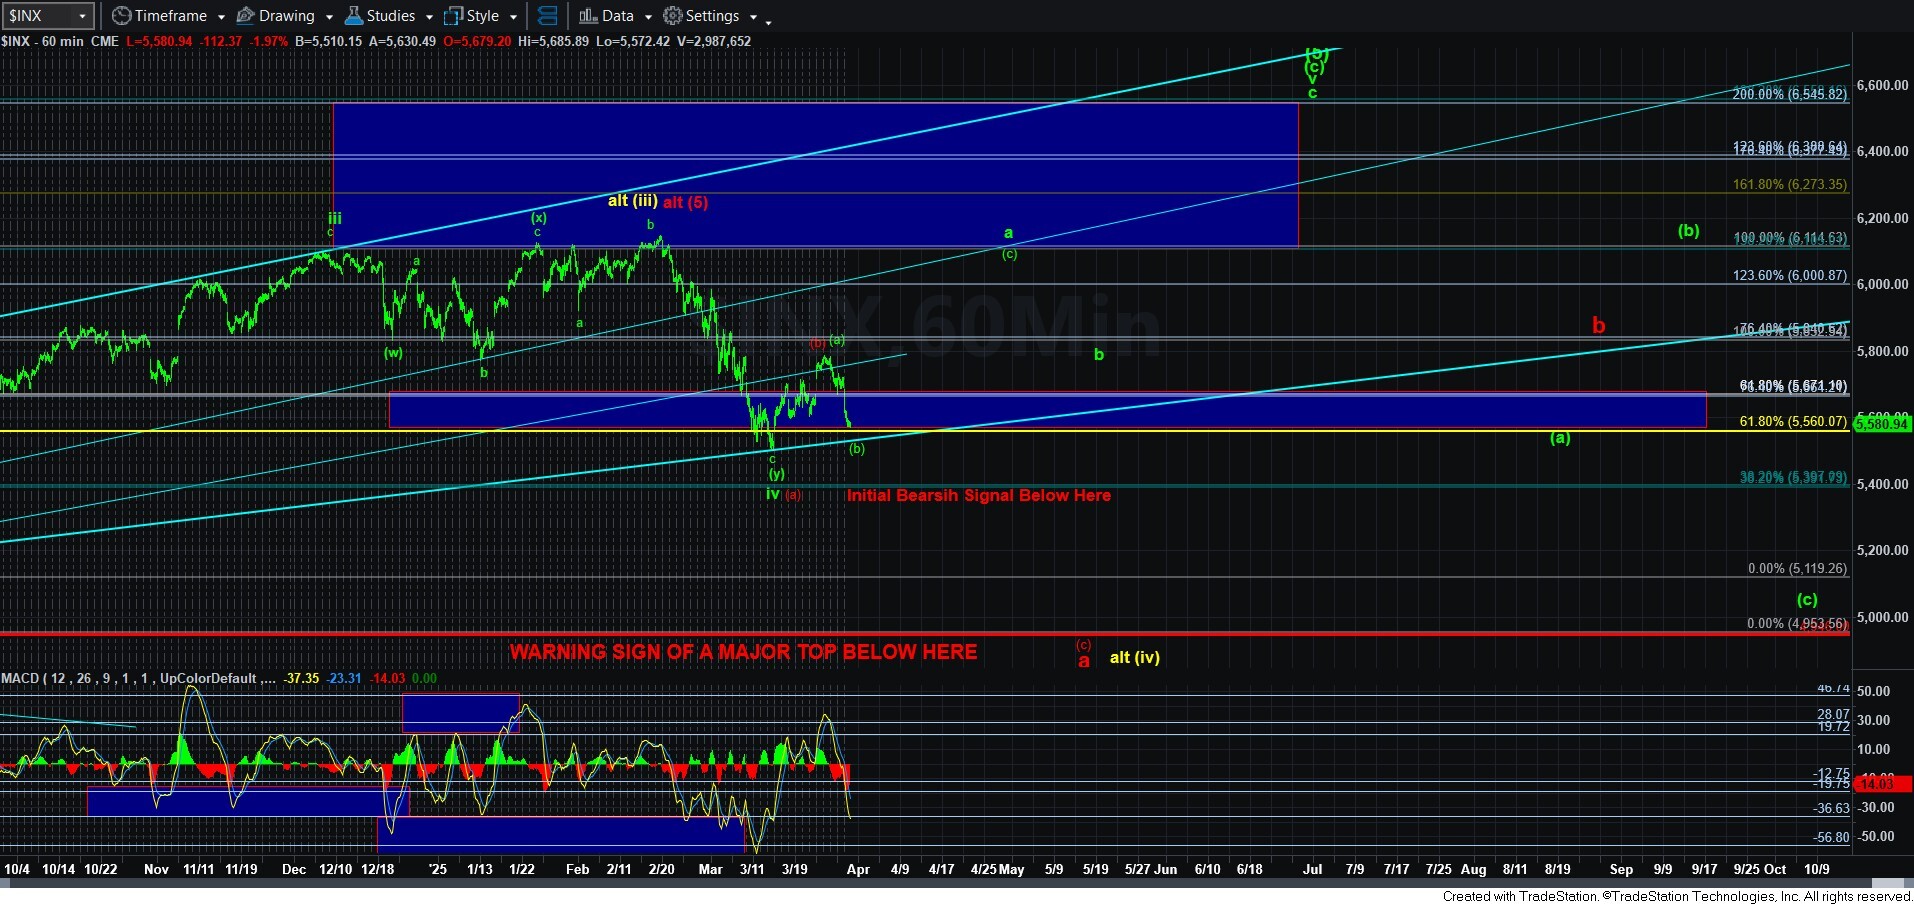
Based upon my analysis, there are still two paths which can take us higher one more time before this bull market completes its final top. The first is from the current region at which we stand. That is represented in the green count (to which I am adding a small adjustment presented in blue, which I will explain below). The second is from the 5000SPX region, which is presented in yellow, which I currently view as a much lower probability for a rally to new highs. I have discussed the reasons I see this as a lower probability many times in recent live videos and in prior updates.
So, of course, the immediate question with which we are now grappling is if the market can still provide one more rally north of 6200SPX from this general region before a major top is struck in the green (blue) wave count?
We have been tracking the recent bounce very carefully over these last few weeks, and I have warned that once we get to the bottom of the target/resistance box, risk will rise and we will have to be on guard for a potential set up to take us down to the 5000SPX, thereby increasing the probability that a long-term bear market has begun.
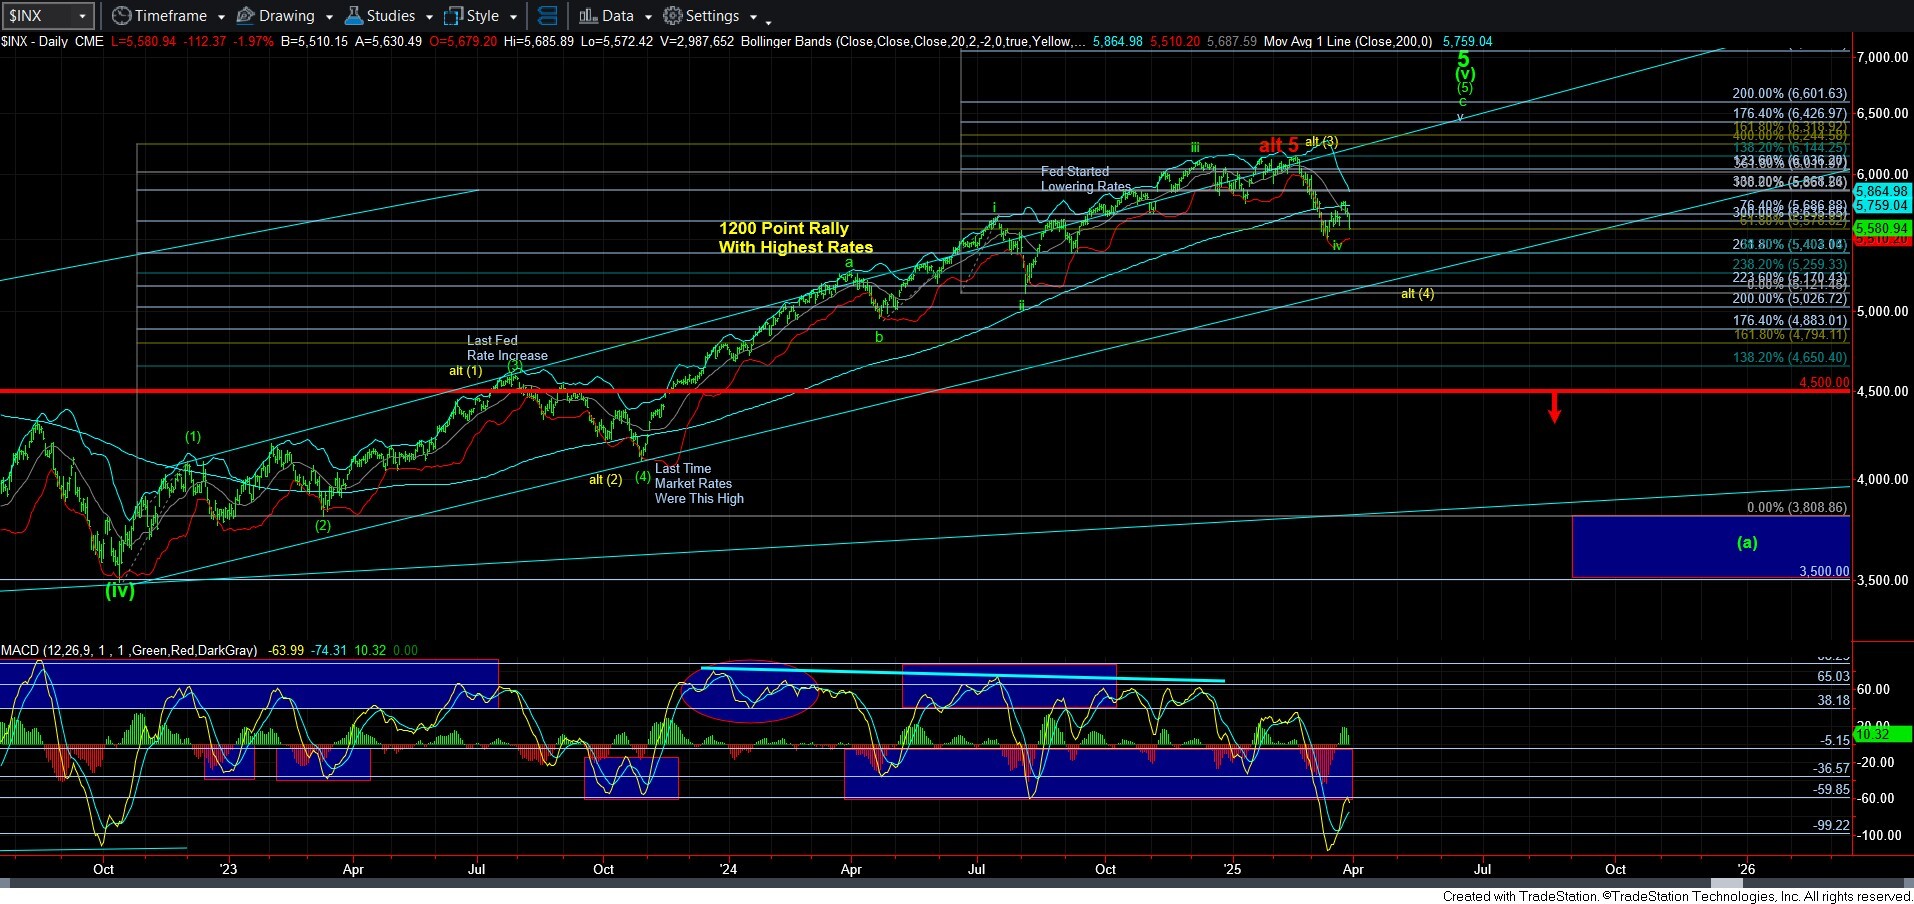
At this time, I want to digress for a moment to outline the environment I expect within the impending bear market over the coming decade or two. While many believe that if we head into a bear market, we will see a crash similar to what was seen in 1929, which dropped the stock market by 89% within 3 years. This is not at all my expectation. Rather, if you look at my monthly chart, you will see that I believe it will be a long and protracted bear market with many ups and downs, and likely many c-wave crashes seen along the way, along with many b-wave multi-year corrective rallies. A long and protracted bear market such as this will likely cause much greater pain than what was seen during the Great Depression, at least in my humble opinion. And, this is all based upon Eliott’s theory of alternation. For this reason, I believe, when it is over, it may be called the Greater Depression.
Now, please do not mistake me for being a perma-bear. Anyone that has followed me throughout the years knows that I am not a perma-anything. In fact, when the market was bottoming out in 2020 at the 2200SPX region and I was calling for a major rally to 4000+ from there, despite all the economic blight being caused by Covid at the time, I was laughed at as a perma-bull. But, again, I am not a perma-anything. Rather, I view the market as objectively as humanly possible, and provide to you my honest and objective assessment. As one of my subscribers noted many years ago, I am simply “perma-profit.” And, that honest and objective assessment suggests that a larger degree multi-decade 4th wave bear market is something that is likely in our future.
Let’s now move back to our discussion of the current market structure. Thus far, the decline from the resistance box has provided us with a 3-wave event. Yet, that 3-wave decline has broken down below the .618 retracement (and the.764 retracement in the futures) of the prior decline. That usually does not bode well for this being counted as the green [b] wave. But, for now, I am going to be taking this market one step at a time, and allow each potential count to invalidate before we are left with the highest probability path. This is a treacherous market and I intend to analyze and trade it with great caution and scrutiny. So, if we complete 5 waves down in the SPX, that would invalidate this potential green structure as currently shown.
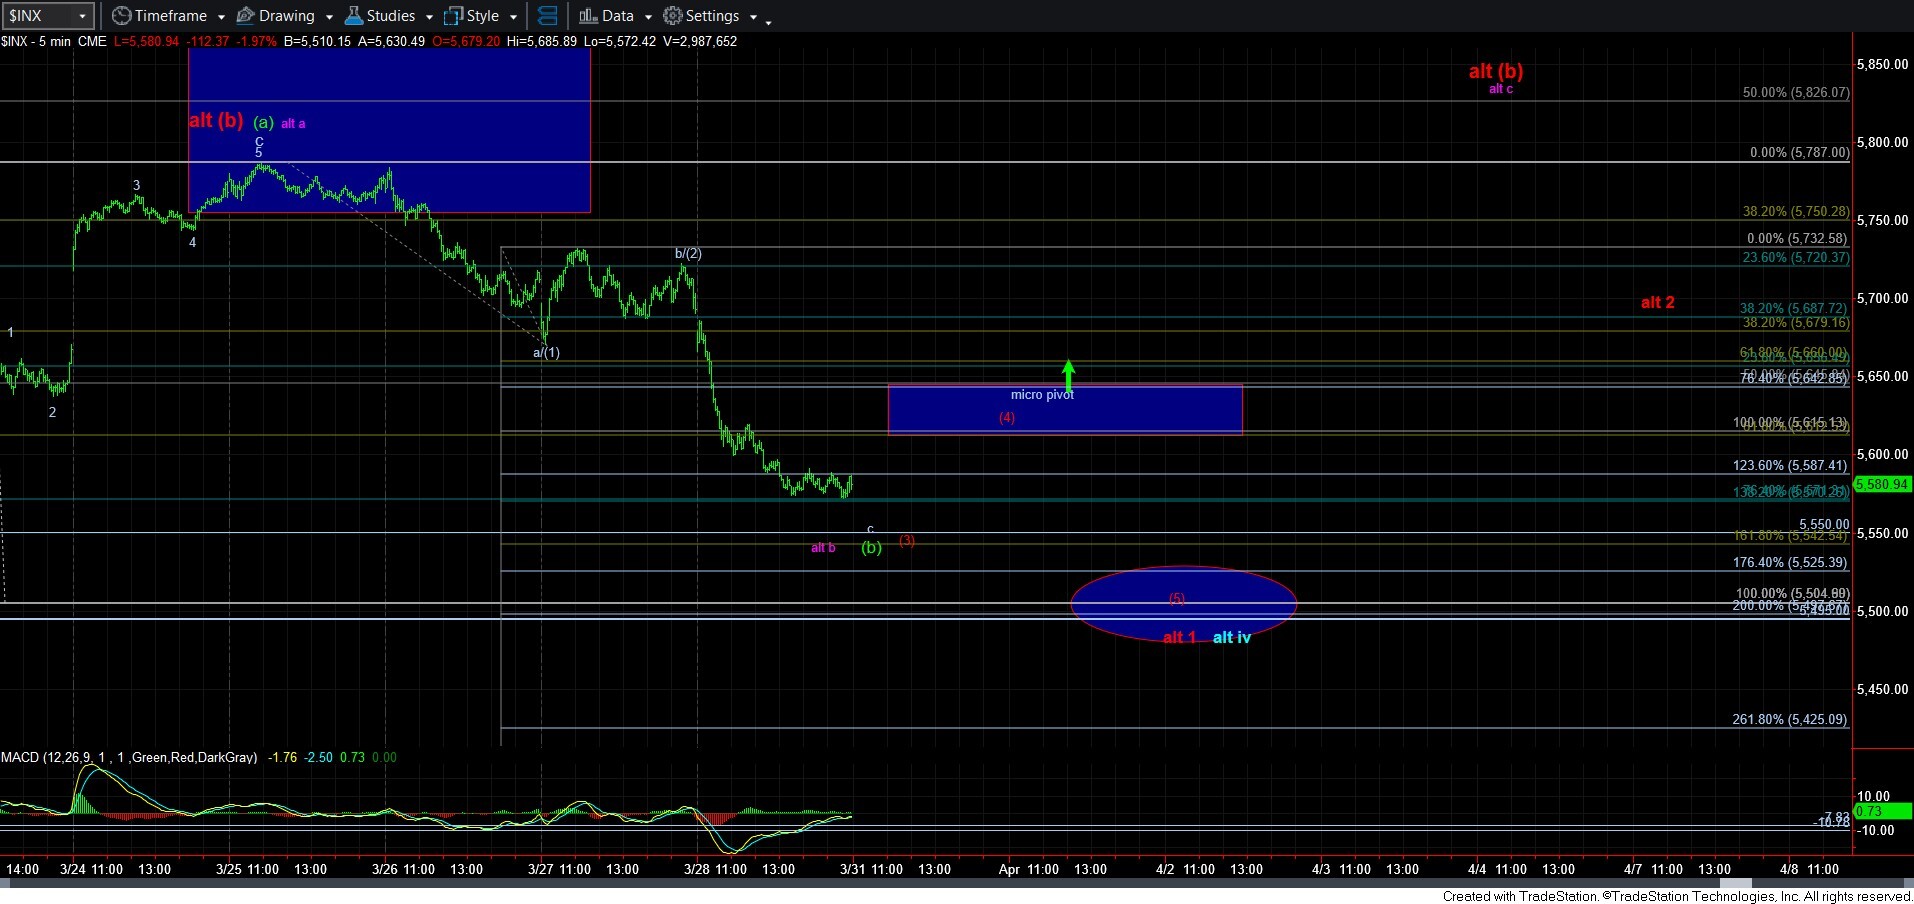
The alternative we have been tracking is that this past week represents the top of the red [b] wave, and if we are able to complete 5 waves down off that high, then we have potentially begun the [c] wave down to the 5000SPX region. Within this count, we are now only completing wave [3] of wave 1 of that [c] wave. I have lowered the resistance box for a wave [4] bounce on the 5-minute SPX chart, with the ideal resistance being the 1.00 extension at the bottom of the box. Should the market bounce correctively to resistance and then drop to make a lower low to complete waves [4] and [5], then we have to be on the lookout for the wave 2 bounce, followed by another 5-wave decline in wave [1] of 3. Should that take shape in the coming week or two, then this will have me move into the red count as my primary count, and be looking for a 500-point decline towards the 5000SPX region over the coming weeks and months.
Now, in between these paths, there are still other structures that could develop, which I am keeping in the back of my mind for now. While these were not considerations to this point, I have to remain objective in my views of the market structure, which forces me to open my mind to other options at various times. You see, the daily MACD on the SPX does trouble me a bit, as I just don’t think it moved up high enough to support an expectation for the red [c] wave decline to have begun already. Of course, the green count pushing us much higher is still well within reason as well, but the depth of this retracement has certainly weakened that potential as of now. So, due to the muted bounce thus far in the daily MACD and the depth of the drop not being typical of what I would expect for the green [b] wave, I have to at least consider other options over the coming week or two.
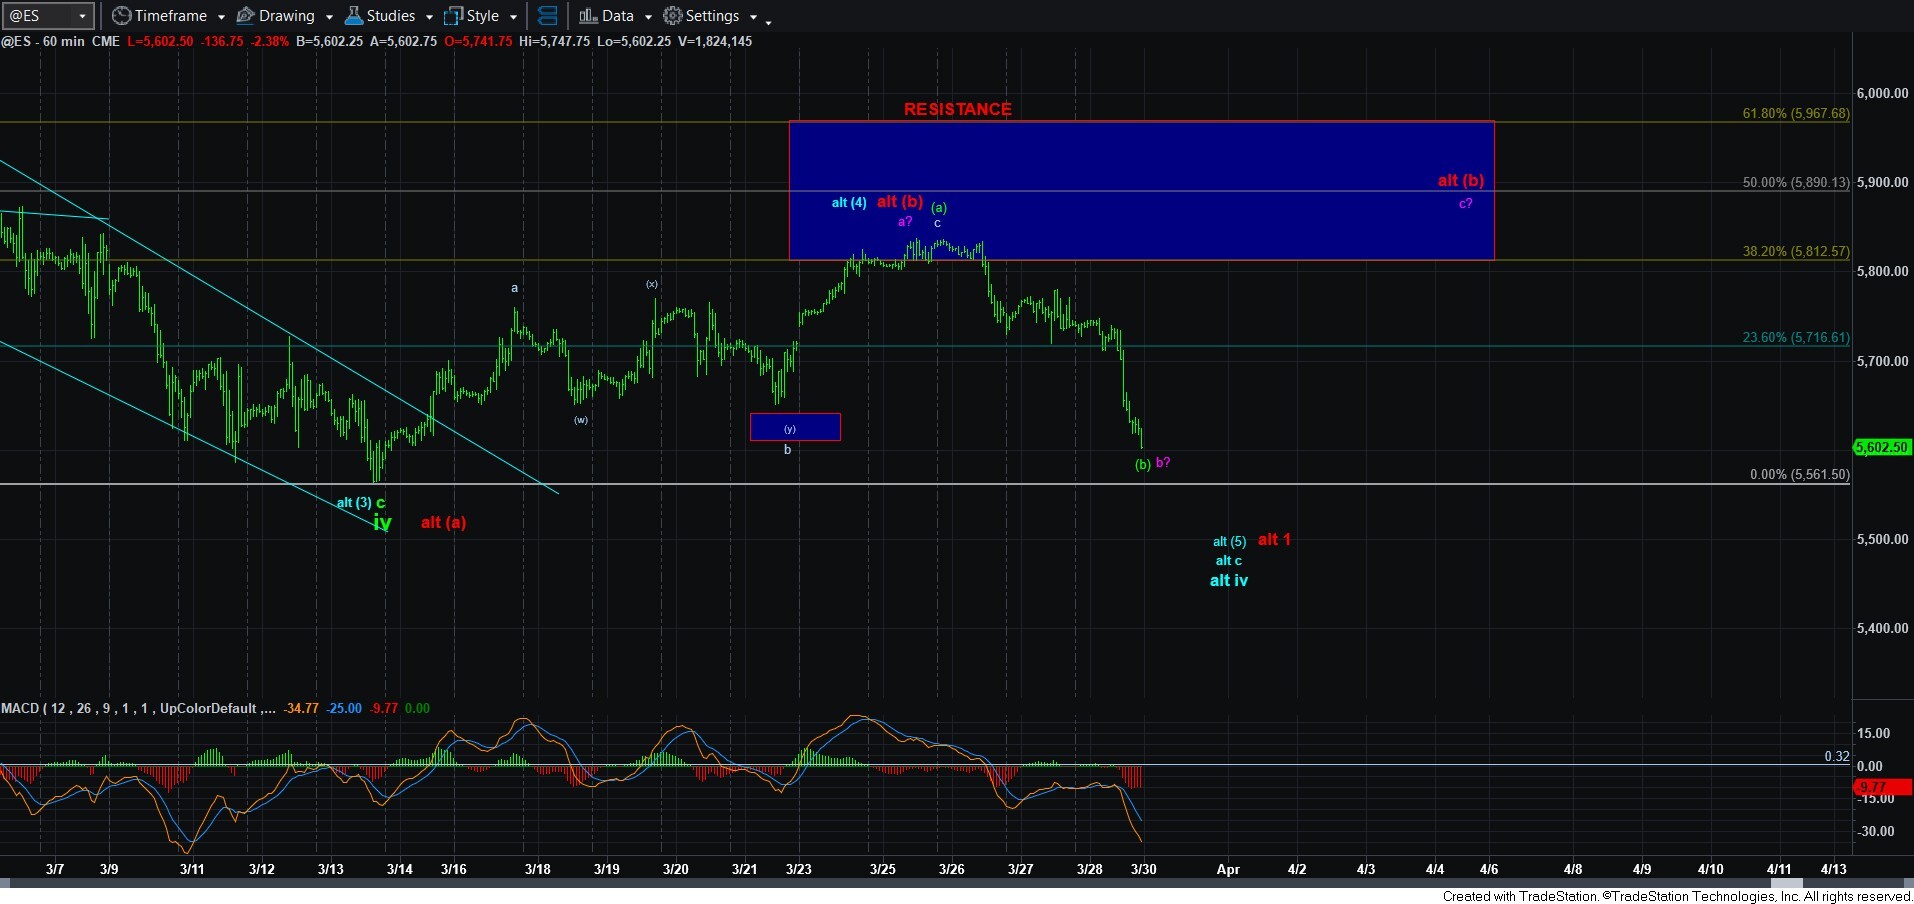
For example, there is potential for the market to bottom as a 3-wave decline, and then rally in a 5-wave structure and still not be bullish. You see, because the market dropped so deeply in this move into Friday’s low, it could present the potential for a larger red [b] wave flat, which would still see a c-wave rally back into the resistance box, as I am presenting with the purple a?-b?-c? on the 60-minute ES chart. Should this pattern take shape in the coming week or so, followed by another 5-wave decline, then I would view that as a larger completed [b] wave in red, followed by wave 1 down in the [c] wave, ultimately pointing us towards the 5000SPX region to complete that red [c] wave.
The other potential I am now forced to consider is if the rally to the resistance box was simply a 4th wave in the c-wave of the green wave iv, which I am now presenting as a potential path to consider in blue. As I said, due to the muted bounce seen in the daily MACD, I have to consider other options that would align with that indicator, and see us develop another rally to bring that daily MACD to a higher point before any further decline structures set up. And, as the market provides a bit more clues in the coming week or two, we can narrow down these potentials into the most likely path for the next 500-point market move.
In truth, I really do not like to provide complex analysis, as it increases the difficulty of decision making. In fact, at any given time, I will usually have 4-5 different paths within my consideration on any chart for which I provide analysis. But, I usually only provide to you the 2 highest probability paths in order to keep the analysis as simple as possible.
However, when the market provides various clues that suggest we have to keep our mind open to other paths, I am forced to present those to you as well. I feel as though I am not doing my job as an analyst in presenting you two options when the market is providing clues that it could present us with another twist or turn in the coming weeks. And, until we can reduce those possibilities to reach a very high probability path, well, as I said before, I am going to be approaching the market in a very cautious, objective, calculated, and deliberate manner.
In summary, as we get more information from the market over the coming week or two, we can narrow down the paths to a higher probability one over the coming weeks. But, the more immediate bullish path in green has certainly been weakened by Friday’s drop below its standard retracement expectations, and may be revived by the blue path I have added this weekend. For now, the bulls have a lot to prove before I would suggest another long potential that points us to 6200+ as a high probability. Lastly, I am on high alert for further evidence that we are dropping to the 5000SPX region sooner rather than later.
Lastly, I want to welcome all our TMPW to your new home at Elliottwavetrader. I look forward to many more years of navigating the markets together on our main platform.