Time For Some Bullish Defensive Plays
By Levi at Elliott Wave Trader; Produced with Avi Gilburt
Rather tongue-in-cheek, some will refer to these types of defensive plays as Beans, Bullets and Beer. Others will go even deeper and add on Bunkers and Bullion. If you are searching for bullion-related content, here is a recent article of ours with a bullish setup that you may want to review, “Barrick Gold: Being Number 3, In A First Place World”. Sorry, but you’ll have to get your own bunker.
Take your pick of the ‘B’ words, but it would appear that there are quite a few charts lining up with ‘B’ullish setups. We will feature 3 in this article. As always, Lyn Alden provides us with keen insights via the fundamentals on each of them. Let’s start there and then we’ll delve into the structure of price on the charts.
Current Fundamentals
HRL: “I avoided HRL for a while due to it being overvalued. It has come back down to a reasonable valuation, but from a fundamental perspective I would like to see the catalyst of revenue and earnings turning back up before being too bullish.
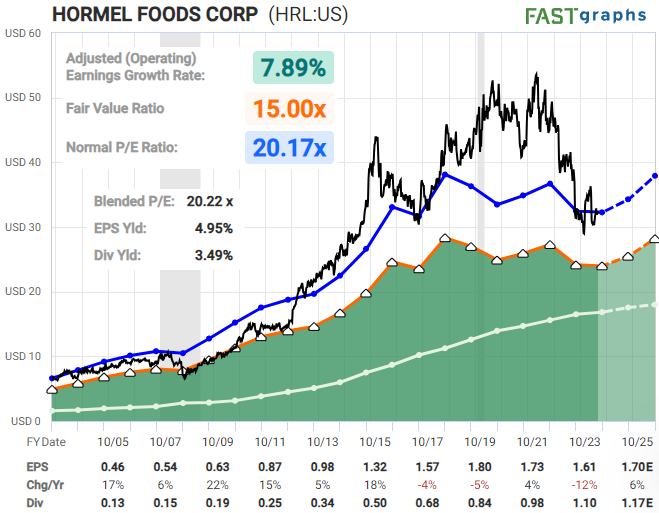 It's an interesting defense stock if it can stay above its recent low and if it can start to show revenue and earnings stabilization in the quarters ahead.”
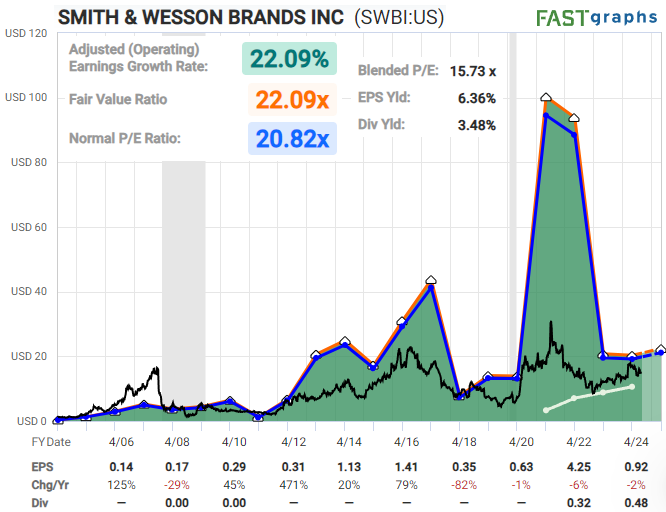
SWBI: “SWBI is very cyclical, and its revenues now are similar to what they were a decade ago, indicating stagnation.
Their balance sheet is strong, and they are relatively inexpensive. I don't try to predict future spikes of gun sales, and whenever they do occur, SWBI tends to use the extra cash flows to buy back shares. Overall it's a reasonable value opportunity but not particularly compelling in my view unless one feels confident in modeling the probability of another sales spike within the next few years."
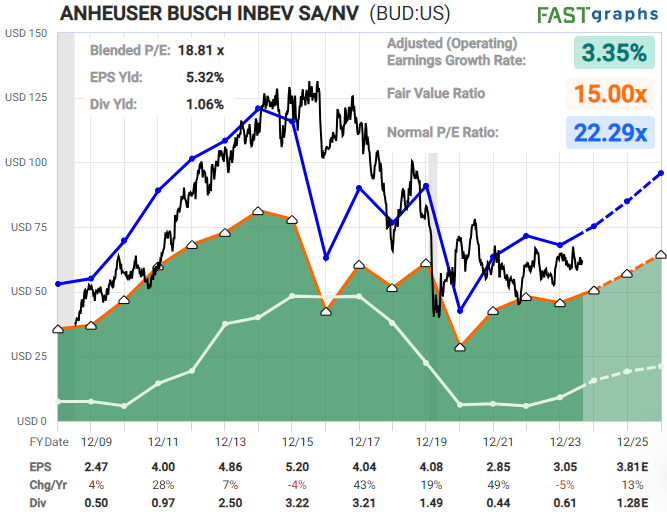
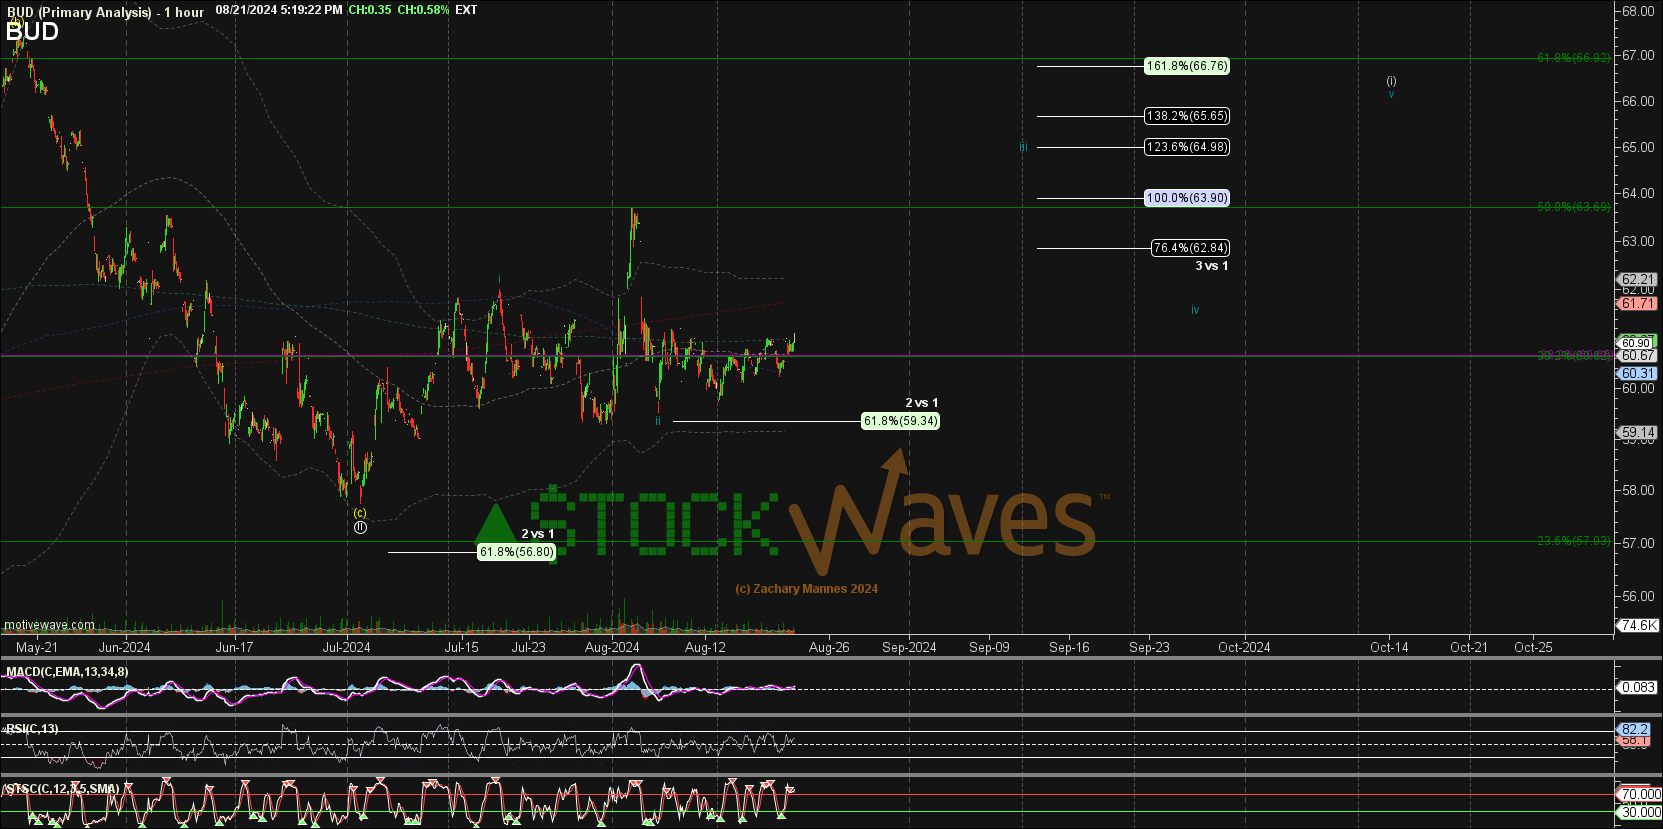
BUD: “BUD has returned to earnings growth and is trading at a reasonable dividend-adjusted PEG ratio of under 2x.
There's a very reasonable opportunity for bullishness here. But it's a very competitive space and so risks should be monitored to ensure that the growth is coming as consensus analysts expect.”
Let’s Talk Structure Of Price
Well, in all actuality, this structure is going to talk to us. As price forms on each respective chart we study, the structure that it displays will communicate what is most likely to unfold next. This is simply human behavior in motion right before our very eyes. And there is a tried and true methodology that can help track and trade these structures. Let us show you the specific setups below as we use Elliott Wave Theory with Fibonacci Pinball.
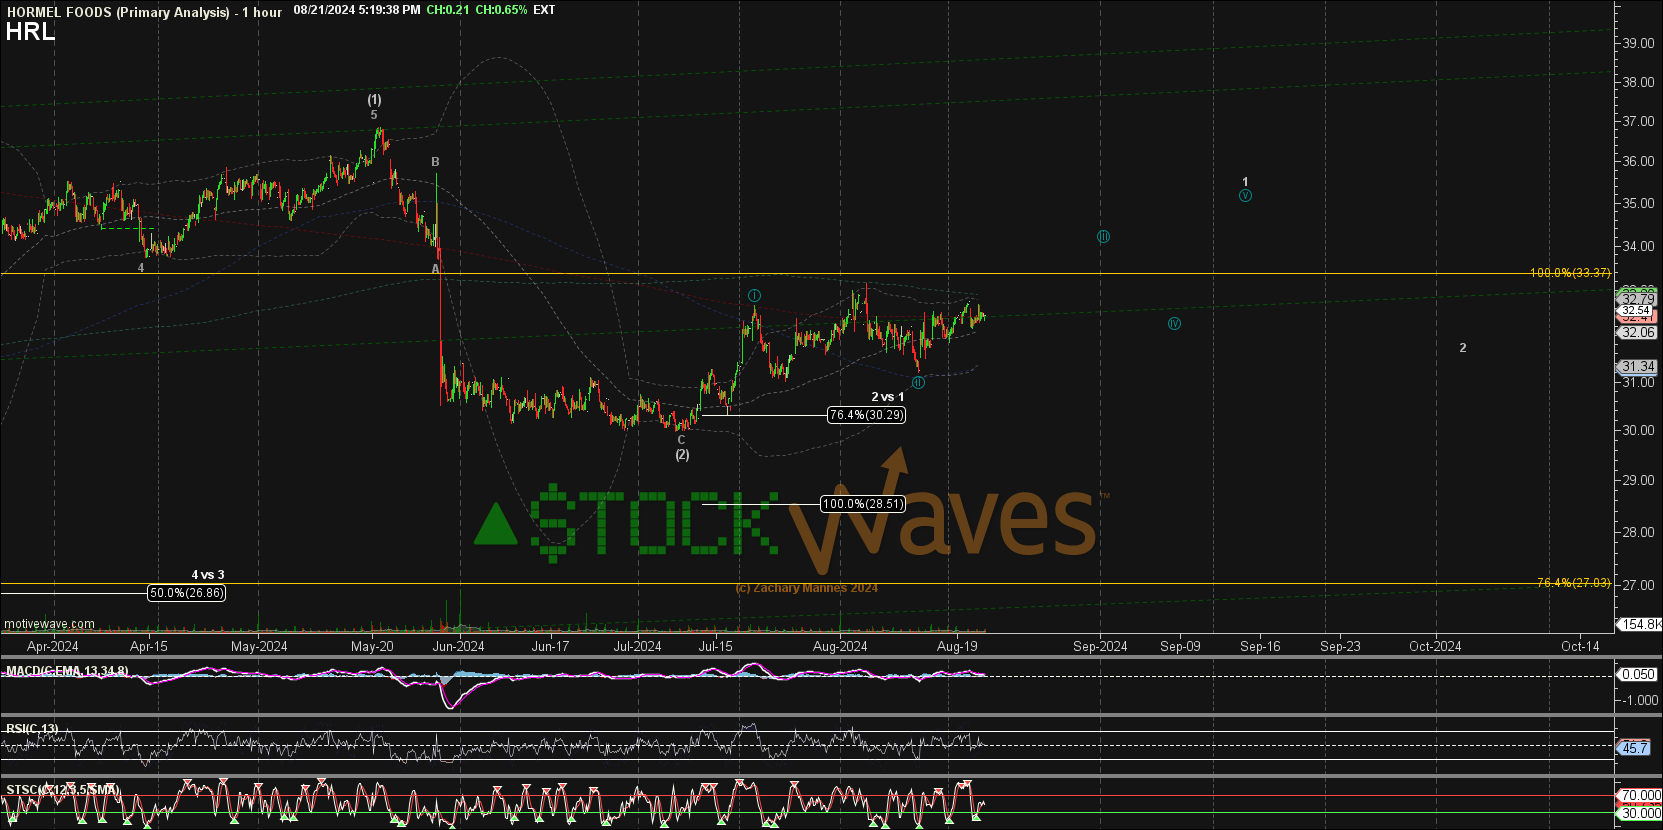
HRL: Notice the larger degree [1]-[2] that has already formed. Now we are tracking the next lesser degree 1-2 underway. Inside that wave 1 of [3], price should also form 5 waves. So, for as long as price remains above the low struck during the middle of August, we can anticipate higher in wave ‘iii’ of 1.
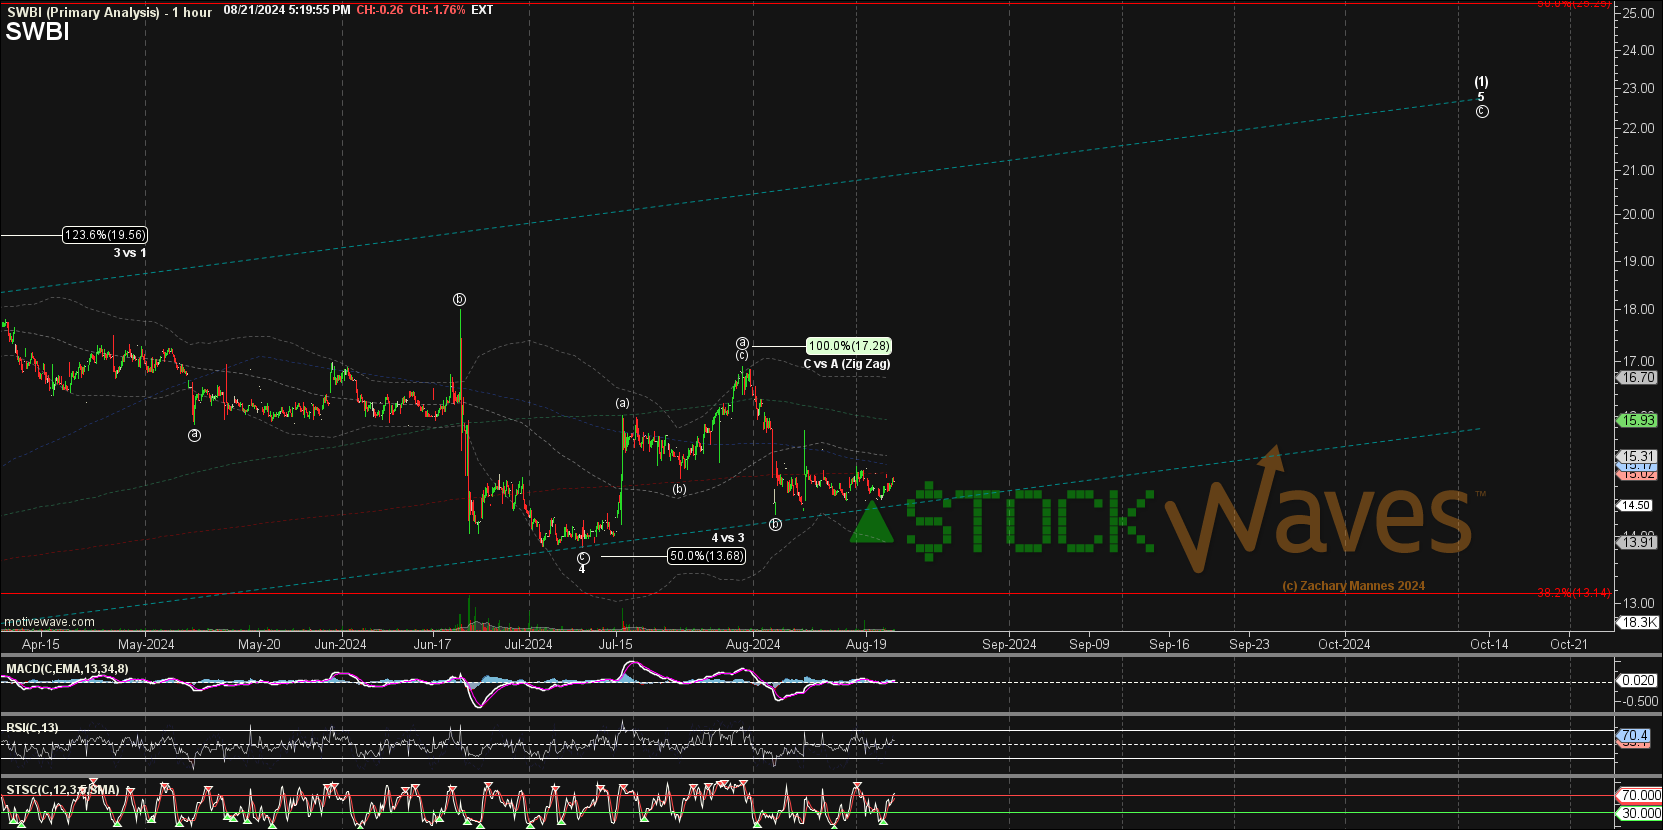
SWBI: This one appears to have a decent amount of upside potential with the recent low near 13.50 as the key level to hold in the near term. You can see the projected target overhead at the upper right corner of the chart.
BUD: And yet another that has already formed a bullish wave [i] and wave [ii] with the next lesser degree bullish structure unfolding. Risk could be defined by the July low.
All three of these charts have bullish setups with targets projected overhead and specific risk levels just below current prices. This is how we correctly apply Elliott Wave Theory with the overlay of Fibonacci Pinball.
The What And Why Of Fibonacci Pinball
Please allow me to share an excerpt from Avi Gilburt's article regarding Fibonacci Pinball and its creation:
"While I was learning Elliott Wave on my own, I was trying to obtain a more 'track-able' and 'tradable' understanding of the fractal nature of the markets. This is probably what many struggle with the most. Specifically, it is when we say that within a 5 wave move, each impulsive wave breaks down further into 5 waves each, with some waves becoming extended.
Well, after much analysis and observation, I identified a standardized method to trade waves 3-5, once waves 1 and 2 were in place. Now, remember that this is a standardized method that is a most common phenomenon in the market, but markets can and do vary from this standardized presentation.
This is something that I observed within the Elliott Wave structure, and have adapted it to a trading methodology, which I lovingly call Fibonacci Pinball.
Since 3rd waves in the Elliott Wave structure are the strongest and most powerful of all the waves, it is the ideal wave to trade. Furthermore, since 3rd waves themselves have to be composed of 5 sub-waves, it helps us determine how we trade this structure in a relatively low risk manner.”
How Can This Help You?
One of the issues with any analysis method is the danger of subjectivity creeping onto the chart. However, with Elliott Wave Theory being correctly applied and then governed by Fibonacci Pinball, it helps remove much of that possible subjective nature. It also tends to turn down the noise that can be ever prevalent in the markets.
Here we find ourselves with specific setups and price targets projected onto the accompanying charts. Also, we have invalidation levels that tell us when to shift our stance.
There are many ways to analyze and track stocks and the market they form. Some are more consistent than others. For us, this method has proved the most reliable and keeps us on the right side of the trade much more often than not. Nothing is perfect in this world, but for those looking to open their eyes to a new universe of trading and investing, why not consider studying this further? It may just be one of the most illuminating projects you undertake.

