Tracking a Crash-Like Setup
 By
By
A “crash-like” setup in the S&P 500 has been in “watch” mode since mid-November of 2023. It was very close to moving into “warning” mode today should the market not do a quick turnabout. So far, it appears to have done so. Yet, even that continues to parallel the 2020 market near the end of February. Let me elaborate.
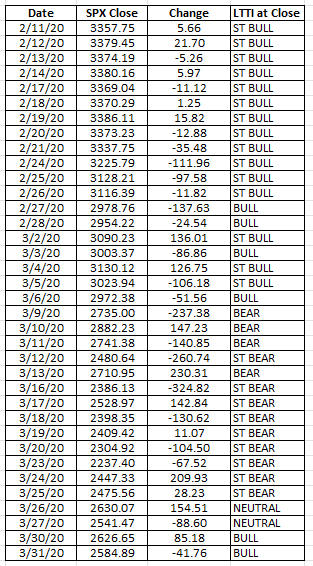
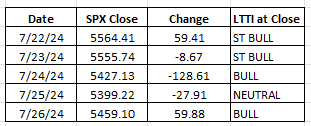
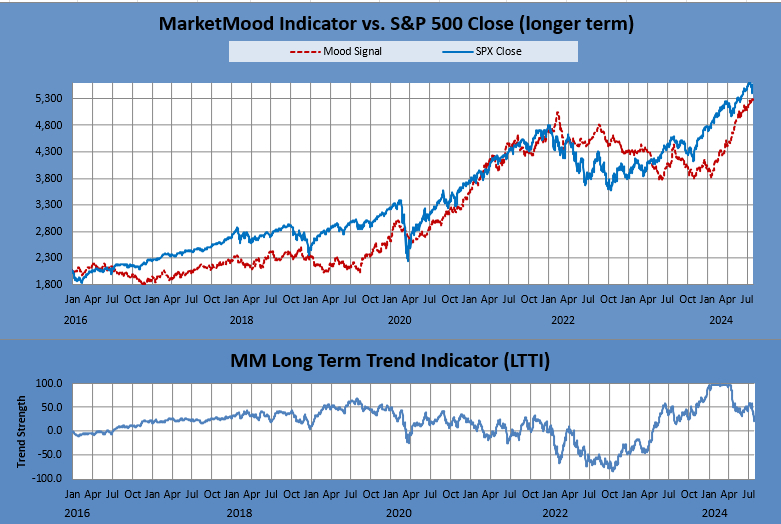
The Long Term Trend Indicator (LTTI) is a derivative of the MarketMood Indicator (MMI) that tracks trend strength based on the divergence between where the S&P 500 closes and where sentiment (MMI) would consider that price “should” be at. The top chart below shows the MMI vs. S&P 500 since 2016. The chart underneath is the LTTI. You can see in the LTTI chart that it rarely reads over 50 or under -50. Going outside of that range is beyond extreme and signals a crash or mega-rally approaching (such as the mega-rally we are currently experiencing). The LTTI reading briefly spiked above 50 in June of last year, and then in mid-November, it topped 50 and kept on going. I found this concerning and issued the “crash-like setup watch.” Since then, it has maxed out at 100 from January through April of this year, finally coming down on July 24, 2024 to the reading of February 27, 2020 and bringing the LTTI from Strong Bullish trend to Bullish. If the parallel holds, there should be at least one more good rally that brings the reading back up to “Strong Bullish.” Should it get back below neutral to “Bearish” that is when I would put this crash alert into warning mode. For today, that level would have been a close below 5365 (SPX cash index).
The tables below are for those who want to look at this a bit more closely. The first shows the readings from 2020 and the other the last few days' LTTI.