US Steel: An Emotional Moment In Time
 By
Levi
By
Levi
By Levi at Elliott Wave Trader; Produced with Avi Gilburt
Emotions. We all possess them, of course. But to what extent do they control the decisions in trading and investing? Likely, more than we would expect or even admit. Being purely analytical is rarely plausible for a human. However, if we can learn to harness the power of emotions and the sentiment that they paint onto the charts, well then, we have been accredited an enormous advantage and potential edge.
Why is this the case? Simply put, because sentiment is all around us and particularly so in the markets. An individual in a vacuum, as it were, would make much different decisions than someone in a crowd. And, like it or not, the market is a crowd. It is this crowd sentiment that exerts influence. Now, we find it especially interesting when our lead fundamental analyst, Lyn Alden makes a comment like the following regarding a company like US Steel (X):
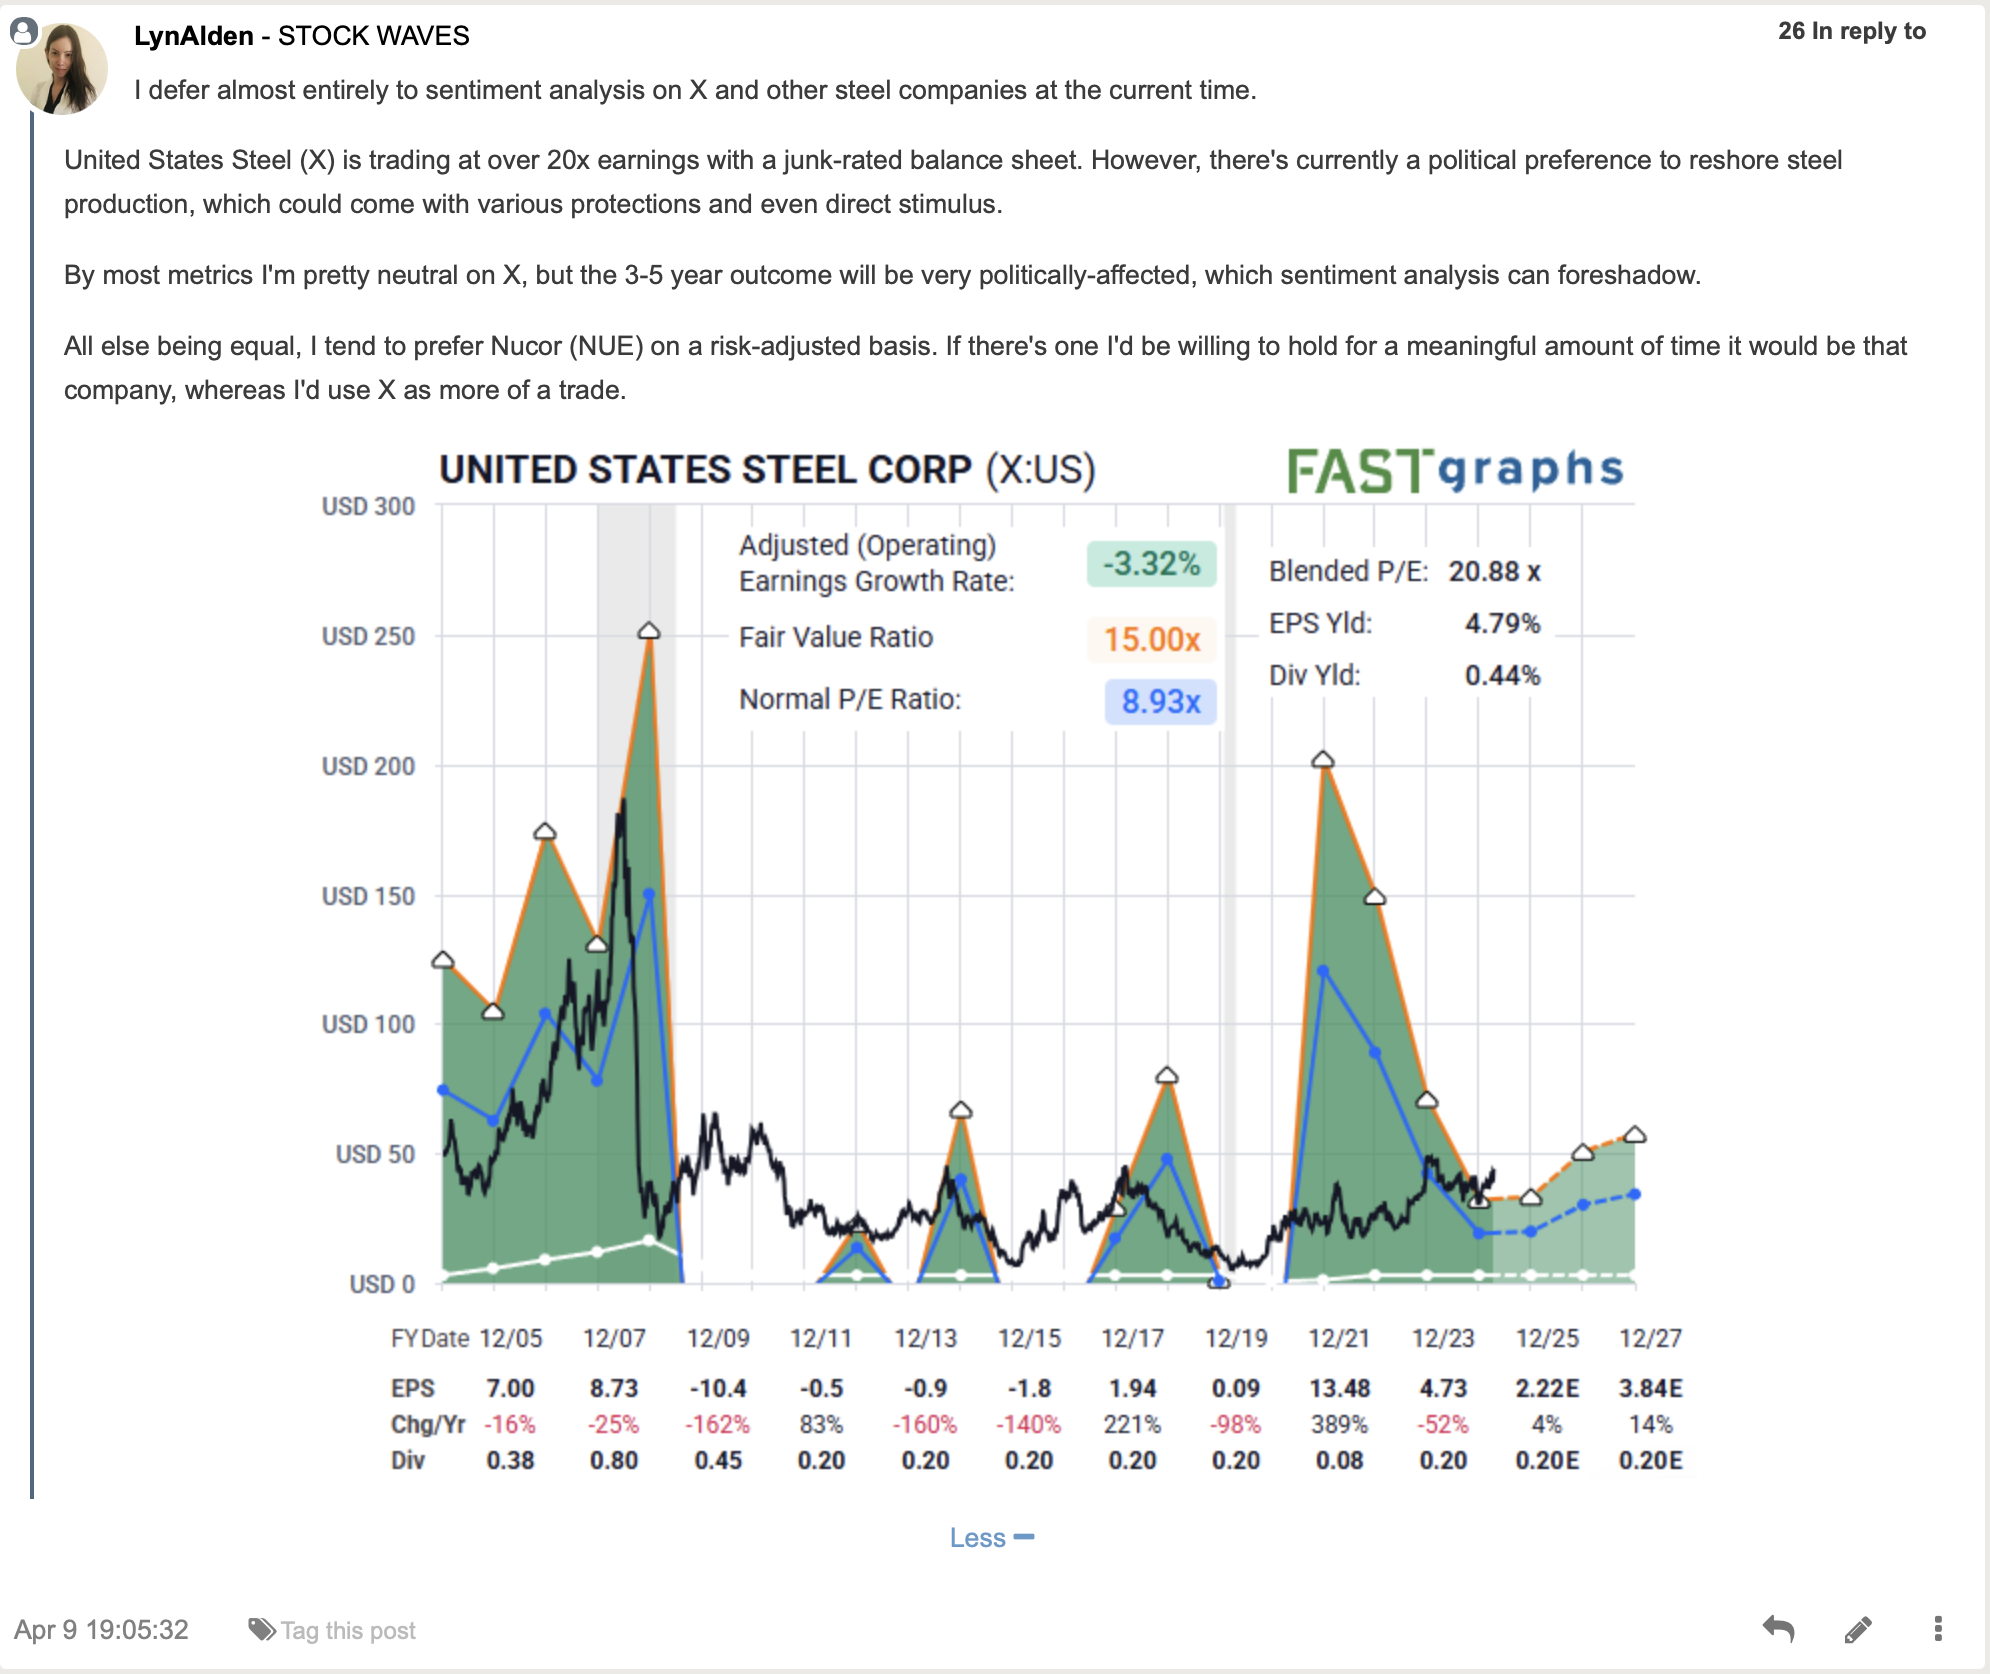
Consequently, we are leaning into the study of sentiment to “foreshadow”, as Lyn so aptly puts it, what is most likely next on the (X) chart. Let’s dive into the findings via the work of Zac Mannes. But, to better get the sense of what he will share with us, a question first.
What Does The Structure Of Price Tell Us?
What truly drives financial markets? They are driven by supply and demand, of course. But, ask yourself, what spurs on demand? It's crowd behavior at work before our very eyes. Sentiment, as we denominate it. So, how do you measure and then project where emotions might take the markets?
Avi Gilburt has written in-depth articles where he shares multiple studies and data points collected over years of research. These have been synthesized into understandable and actionable information for our readers. Here's an excerpt from one of those pieces:
"If you are interested in a methodology which will open your minds and eyes as to how markets really work, then let's move right into the overview.
Back in the 1930's, an accountant named Ralph Nelson Elliott identified behavioral patterns within the stock market which represented the larger collective behavioral patterns of society en masse. And, in 1940, Elliott publicly tied the movements of human behavior to the natural law represented through Fibonacci mathematics.
Elliott understood that financial markets provide us with a representation of the overall mood or psychology of the masses. And, he also understood that markets are fractal in nature. That means they are variably self-similar at different degrees of trend." - Avi Gilburt
The Structure Of Price Speaks Volumes For US Steel
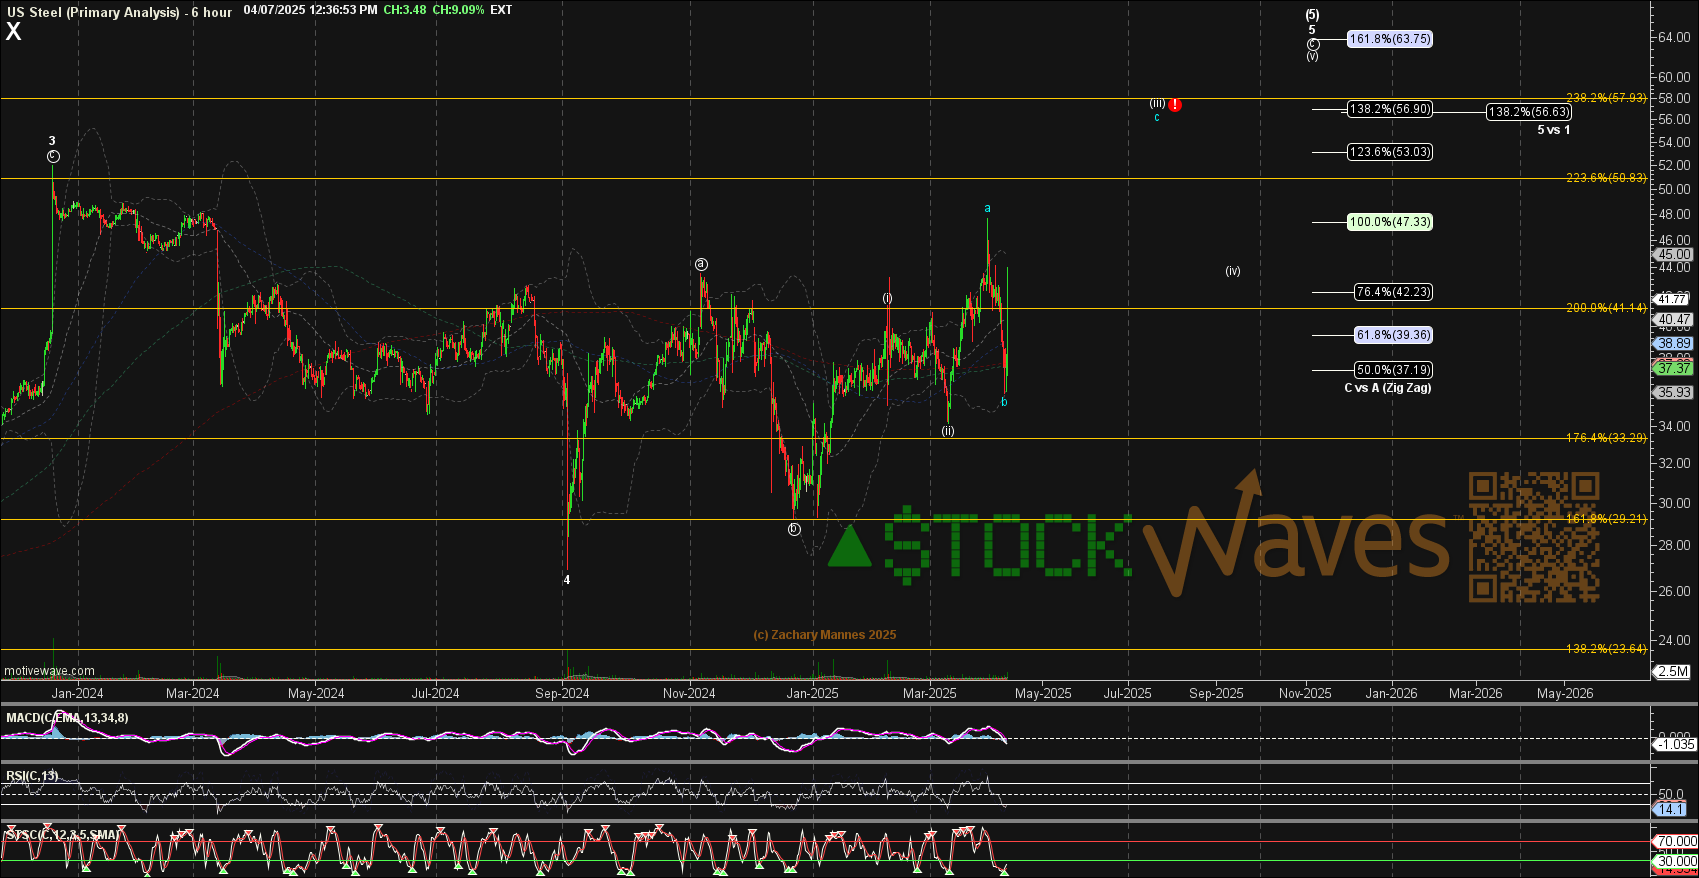
Note that Zac is illustrating what he has identified as the most likely scenario over the next several months. The basic takeaway from this study is that price should seek the $57 level in the proceeding rally. From there, if/when it is struck, there would be a pullback in the wave (iv) shown. It could even pull back down to near this current region. So, as Lyn mentioned before, this stock may be best as a near term trading vehicle.
The context of the chart is suggesting the same. What do we mean by this? Remember that markets and the stocks that compose them are fractal in nature. This is to say that they display self-similarity at all degrees of their structure. It is the repeating nature of these structures from smaller to larger that gives us this climate prognostication.
It is very similar to knowing what season you are in. Yes, it can be stormy and rainy in the desert during summer time. But, what is more likely? Hot and dry conditions typically dominate. Such is the case once we know the context of the structure we are studying at any moment in time. So, in the case of the (X) chart, it is likely that we see $57 next because that is the typical target in a structure like this one.
Below $34 would make this less likely and we would reassess the chart if that should take place.
It's A Setup, Not A Certainty
We view the markets through a probabilistic lens. This means that given the structure of price on the chart, we then display and project what is most probable. However, we also keep in mind that the markets are not linear in nature, rather dynamic and fluid. As such, our view must also update as the price fills in each respective chart.
Please also recognize that this in no way is to say that we do not have strong opinions about the direction we see a chart like US Steel is headed. It simply is to acknowledge the changing tides of sentiment. What we really need is a methodology that will rapidly speak to us about the best way to adapt to something that is beyond our control.
Do We Control The Tides?
That's easy, of course not. But through science and observation, we have learned how to predict the ebbs and flows of the tides nearly down to the minute. Then, we adapt to what nature is giving us. Our methodology is no different from adapting to what the markets show us. And, it is through science (biology) and observation that we have learned the true nature of how human behavior plays out before our very eyes via price action of stocks and indices.
Do You Have A System In Place?
Those who have experience forged by time in the markets will tell you that it's imperative to have a system of sorts in place. You need to be able to define how much you are willing to risk versus how much gain is likely. Those who survive across the decades in the greatest game on earth will also inform you that the preservation of capital is paramount.
While there are multiple manners of doing this, we have found Fibonacci Pinball to be a tool of immense utility for traders and investors alike. For much more information on how this system can work for you, please consult our “Help” section for many educational articles and videos at your disposal.
I might also suggest giving this methodology a fair shake. Why? If you have heard of Elliott Wave Theory, what was the source? Surely, you would want to consult someone who has performed an in-depth study of the how's and why's of the method. As well, this comprehensive investigation would be backed up with published studies on the matter and a body of work that shows the utility of said methodology in real-time.
Conclusion
There are many ways to analyze and track stocks and the market they form. Some are more consistent than others. For us, this method has proved the most reliable and keeps us on the right side of the trade much more often than not. Nothing is perfect in this world, but for those looking to open their eyes to a new universe of trading and investing, why not consider studying this further? It may just be one of the most illuminating projects you undertake.
(Disclosure: I/we may initiate long positions over the next 72 hours in US Steel (X) stock according to the parameters set forth in this article.)
