Using Fibonacci Setups for Trades: IWM Chart Example
The beauty of using Fibonacci setups for trades is the fact that you have a clear definition of risk. Let's look at a recent example in IWM.
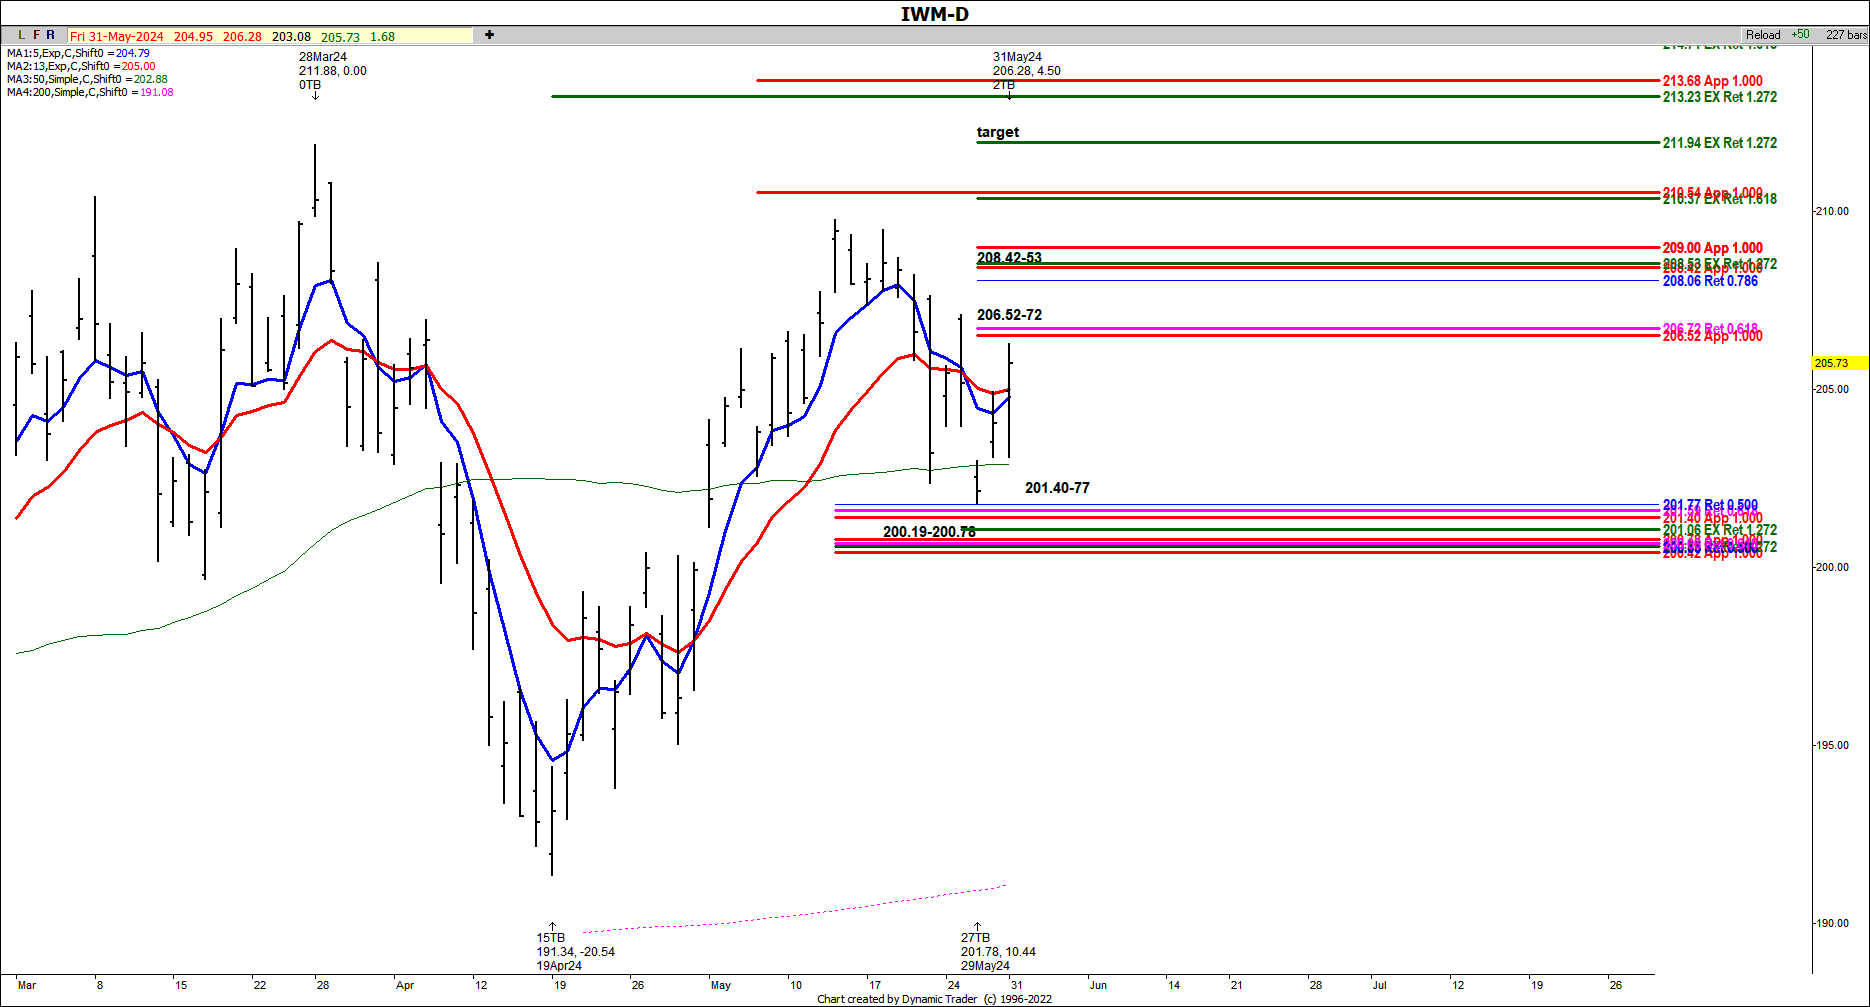
Recently, we had a couple of price clusters to watch in IWM. The higher zone came in at the 201.40-.77 area. It included a 50% retracement and a .618 retracement along with a 100% price projection of a prior declining swing.
After the zone was tested and held with a low made at 201.78, this was followed by intraday buy triggers and a swing trade trigger.
So far we've seen a rally of $4.50 off this low. Note that if we can clear the next hurdles on the chart, our potential bigger picture target one come in at 211.94. As usual we will trail up a stop as we go just in case we don't meet the ideal target. Note that if the zone was violated after entry, you would have been stopped out of the trade.


