Using Fibonacci Support Clusters To Catch AMZN Rally
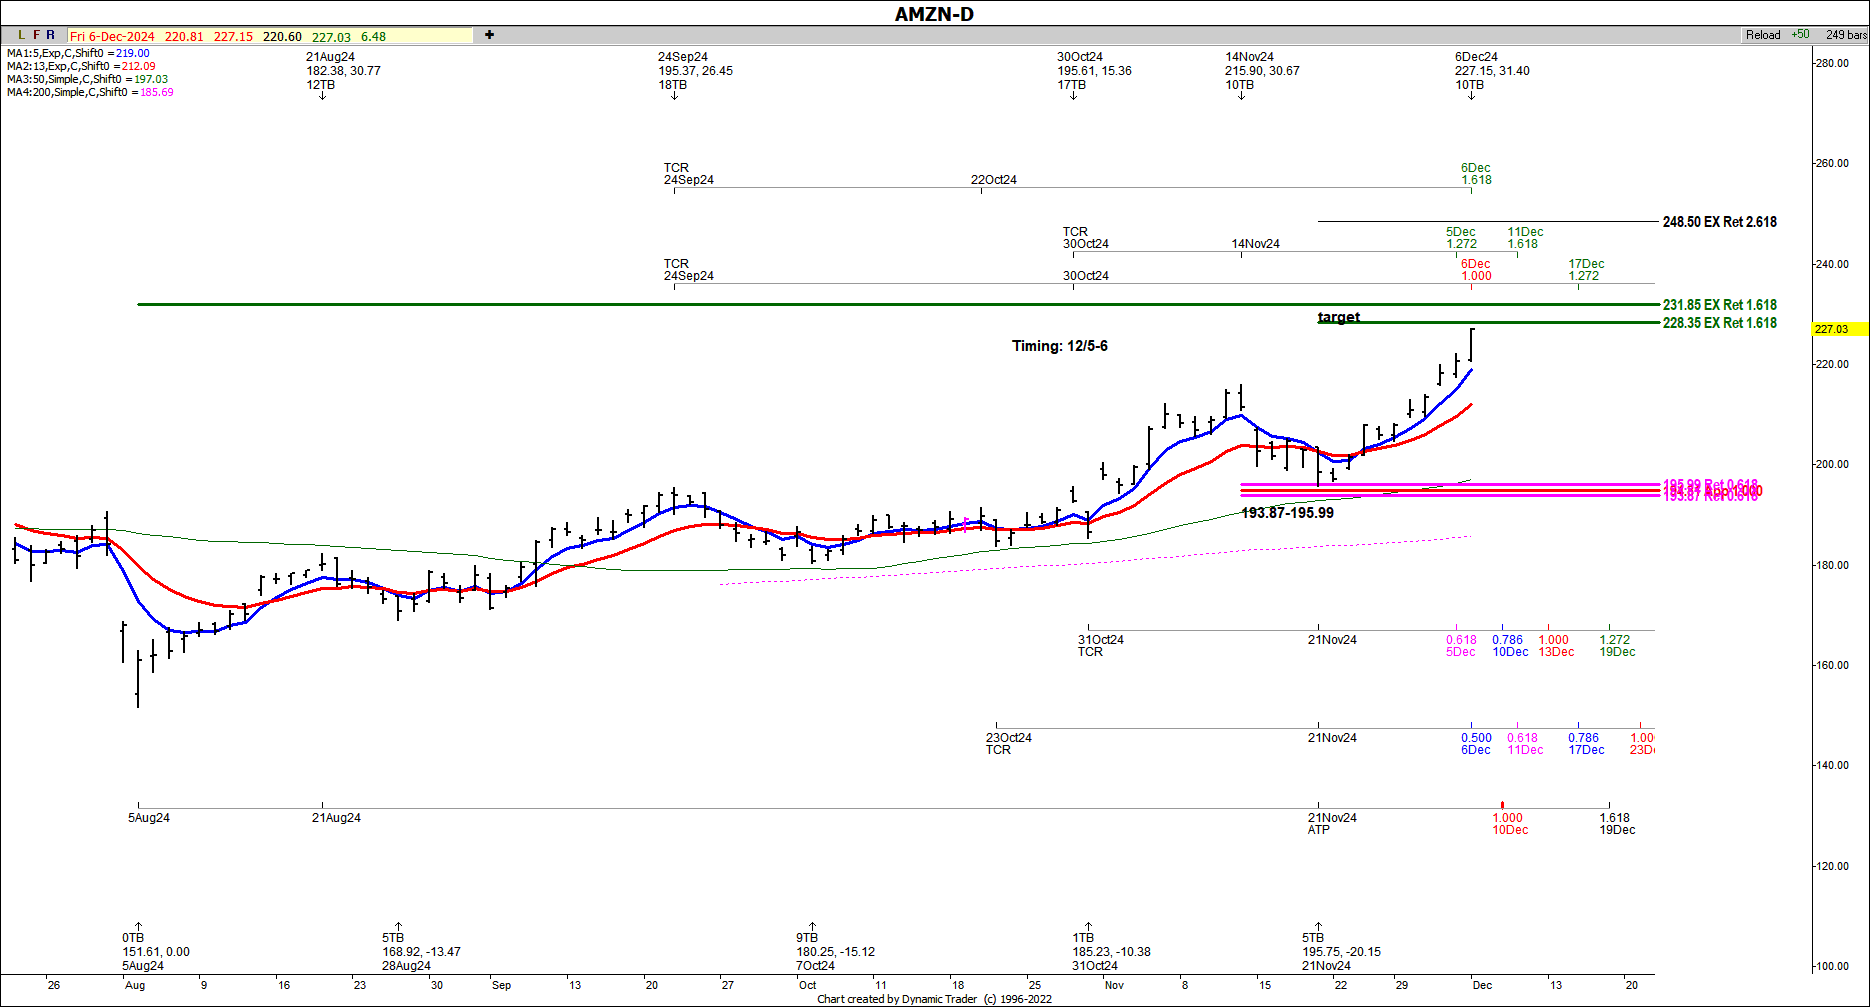
On 11/21 we made a low at 195.75 in AMZN, directly within a key daily support cluster at the 193.87-195.99 area.
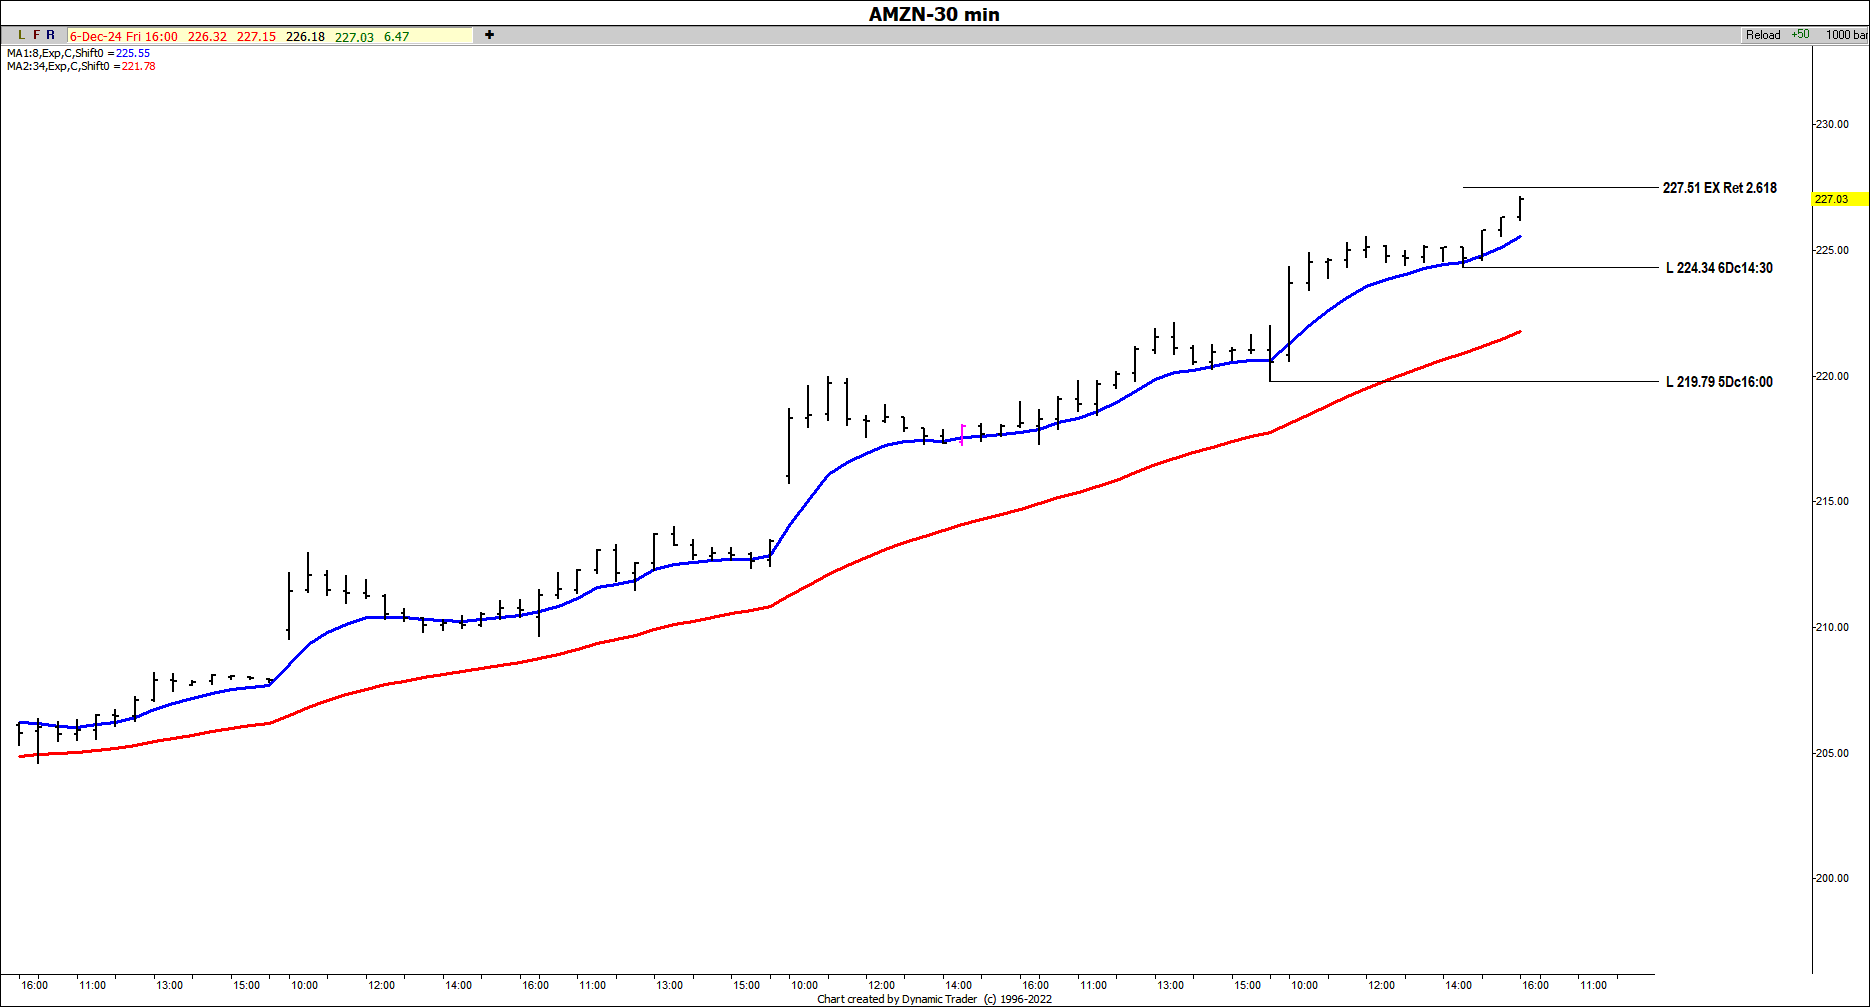
Our first triggers for a swing trade entry came in on the 15 and 30 minute charts. The 30-minute chart gave an entry around the $200 area.
So far we've met the first upside target at the 1.272 extension of the prior swing and are now close to target 2 at the 1.618 extension at the 228.35 area. At this point we are trailing up stops on longs since many moves tend to terminate at extensionns of prior swings.
We also have timing for a possible high first around the 12/5-6 dates or 12/10-11. I like to use swing lows for stops in this case.. Via the 30-minute chart you could either have a stop just below the 224.34 swing low or the 219.79 swing low. So far we've seen a rally from this cluster of $31.40. I hope some of you took it!


