WalMart: Ready For A Rollback
 By
Levi
By
Levi
By Levi at Elliott Wave Trader; Produced with Avi Gilburt
Rollback. Pullback. These are two birds of a feather. What does it mean for the company that made ‘rollbacks’ a household term? We’re going to get Lyn Alden’s take on the current fundamental snapshot. Then we’ll see what the study of sentiment via charts by Zac Mannes and Garrett Patten are telling us. I’ll give you the end before the beginning - (WMT) should be ready for a correction here and quite soon. Let’s see the composite of reasons why.
The Fundamental Snapshot
Lyn Alden consistently shares salient data points and conclusions from her in-depth research efforts. We have been discussing many of the 22 names that Zac and Garrett have recently posted to our membership. You may remember that our lead analysts have culled the hundreds of charts that they track and follow to produce a list of likely candidates for a rally in the months to come. We also have looked at bearish setups. (WMT) is one of those. Here is Lyn’s most recent comment and F.A.S.T. graph:
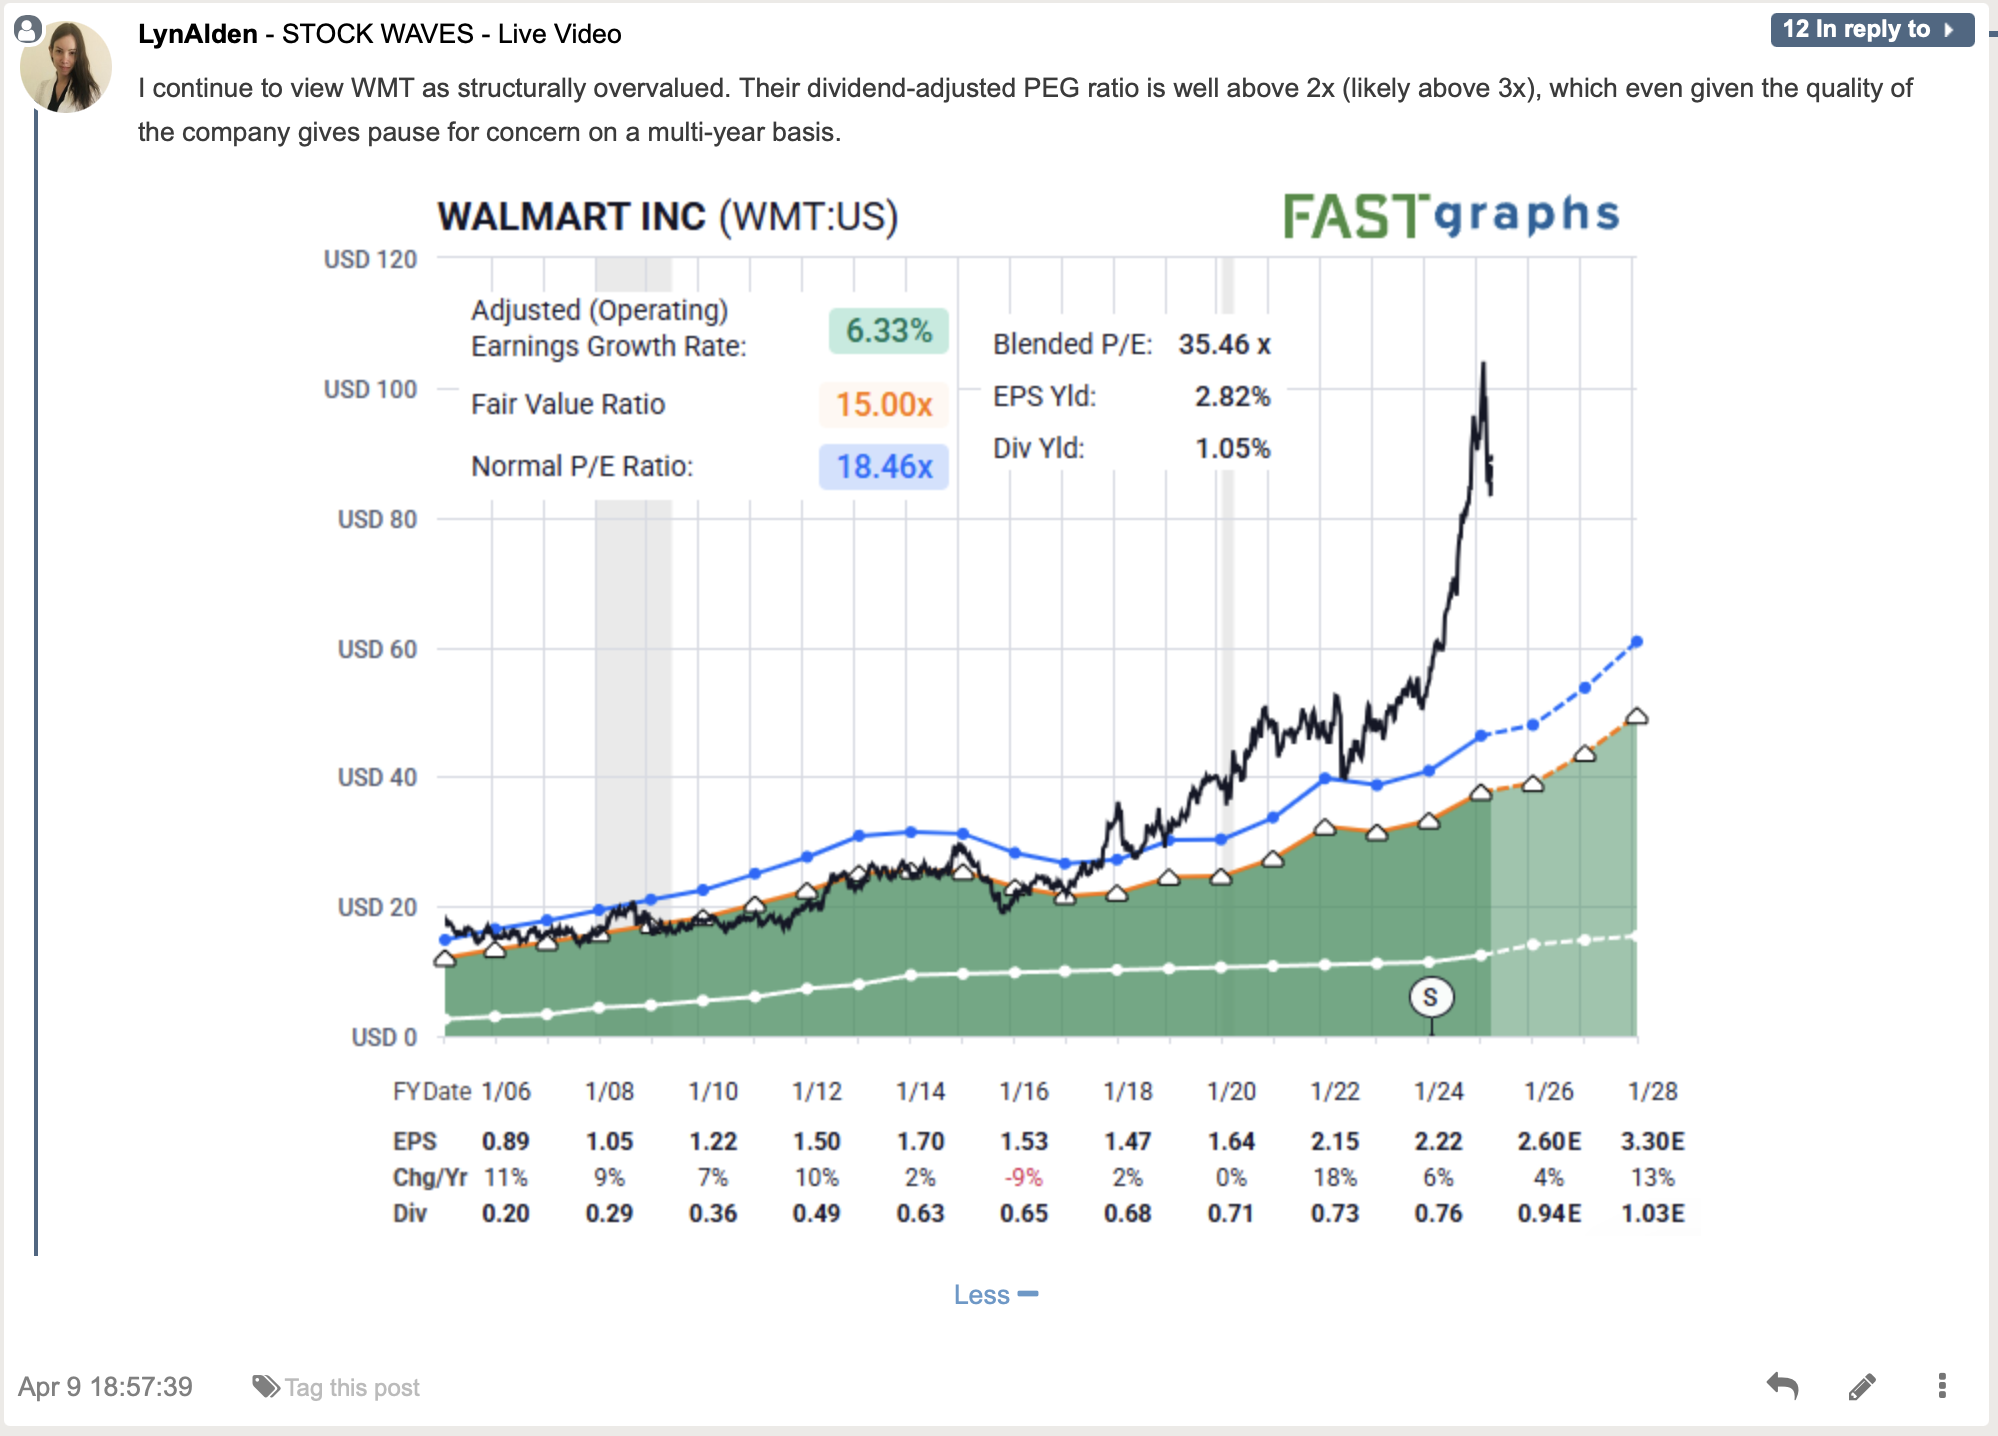
Overvalued by various metrics, as you can see. However, does this mean that it could not become even more stretched in valuation? Well, that is possible, of course. But when we take the fundamentals into account and then search for the synergy with the study of sentiment via the structure of price, it provides us with a probable path. Let’s next look at what we are talking about with sentiment. Then, we’ll illustrate this on the charts and provide the parameters for the bearish inclination we currently maintain.
What Is Sentiment?
There are several ways we can explain the same word. Mood, feeling, disposition. But it basically boils down to fear and greed. There is actually a biological basis for this. Fundamentally, it is a decision made via the limbic system in our brain. Those two 'feelings' dominate how the price action unfolds before our very eyes on the charts that we study.
Avi Gilburt shares his own findings on the subject to the readership here on a regular basis. These are from over years of investigation, trial, refinement, observation and then continual proof manifested in chart after chart.
Here is a brief excerpt from the 6-part series that Avi published to explain our methodology more fully (you can read the entire series here).
"A move in the direction of the trend is considered a 'motive' move (or, as I often refer to it as an 'impulsive move') and will constitute 5 waves in the primary trend direction. A counter-trend move is considered a 'corrective' move and constitutes 3 waves, which are counter to the primary trend direction.
Within the impulsive 5-wave move, waves 1, 3, and 5 move in the direction of the primary trend, and waves 2 and 4 will be counter-trends in the opposite direction.
Since the market is 'fractal' in nature, it means that these movements are variably self-similar at different degrees of trend. In other words, these impulsive and corrective movements of the market are occurring at all degrees and in all time frames.
While this may have begun to sound more complex, I do want to note that the main rules of Elliott Wave analysis are really quite simple. First, wave 2 can never retrace beyond the start of wave 1. Second, wave 3 cannot be the shortest wave. In its simplest form, these are the main rules which you cannot break for a valid Elliott Wave structure.” - Avi Gilburt
So, how would we apply this theory to the (WMT) chart? We’re happy to share the following.
Theory Applied In Real Life
We want to take theory and make practical application of it. Theory makes for lovely discussion and fascinating banter. But it is only when it is put into practice that it becomes a utility. Following what Avi has described above, let’s look at the results of what Zac and Garrett are seeing in the (WMT) charts.
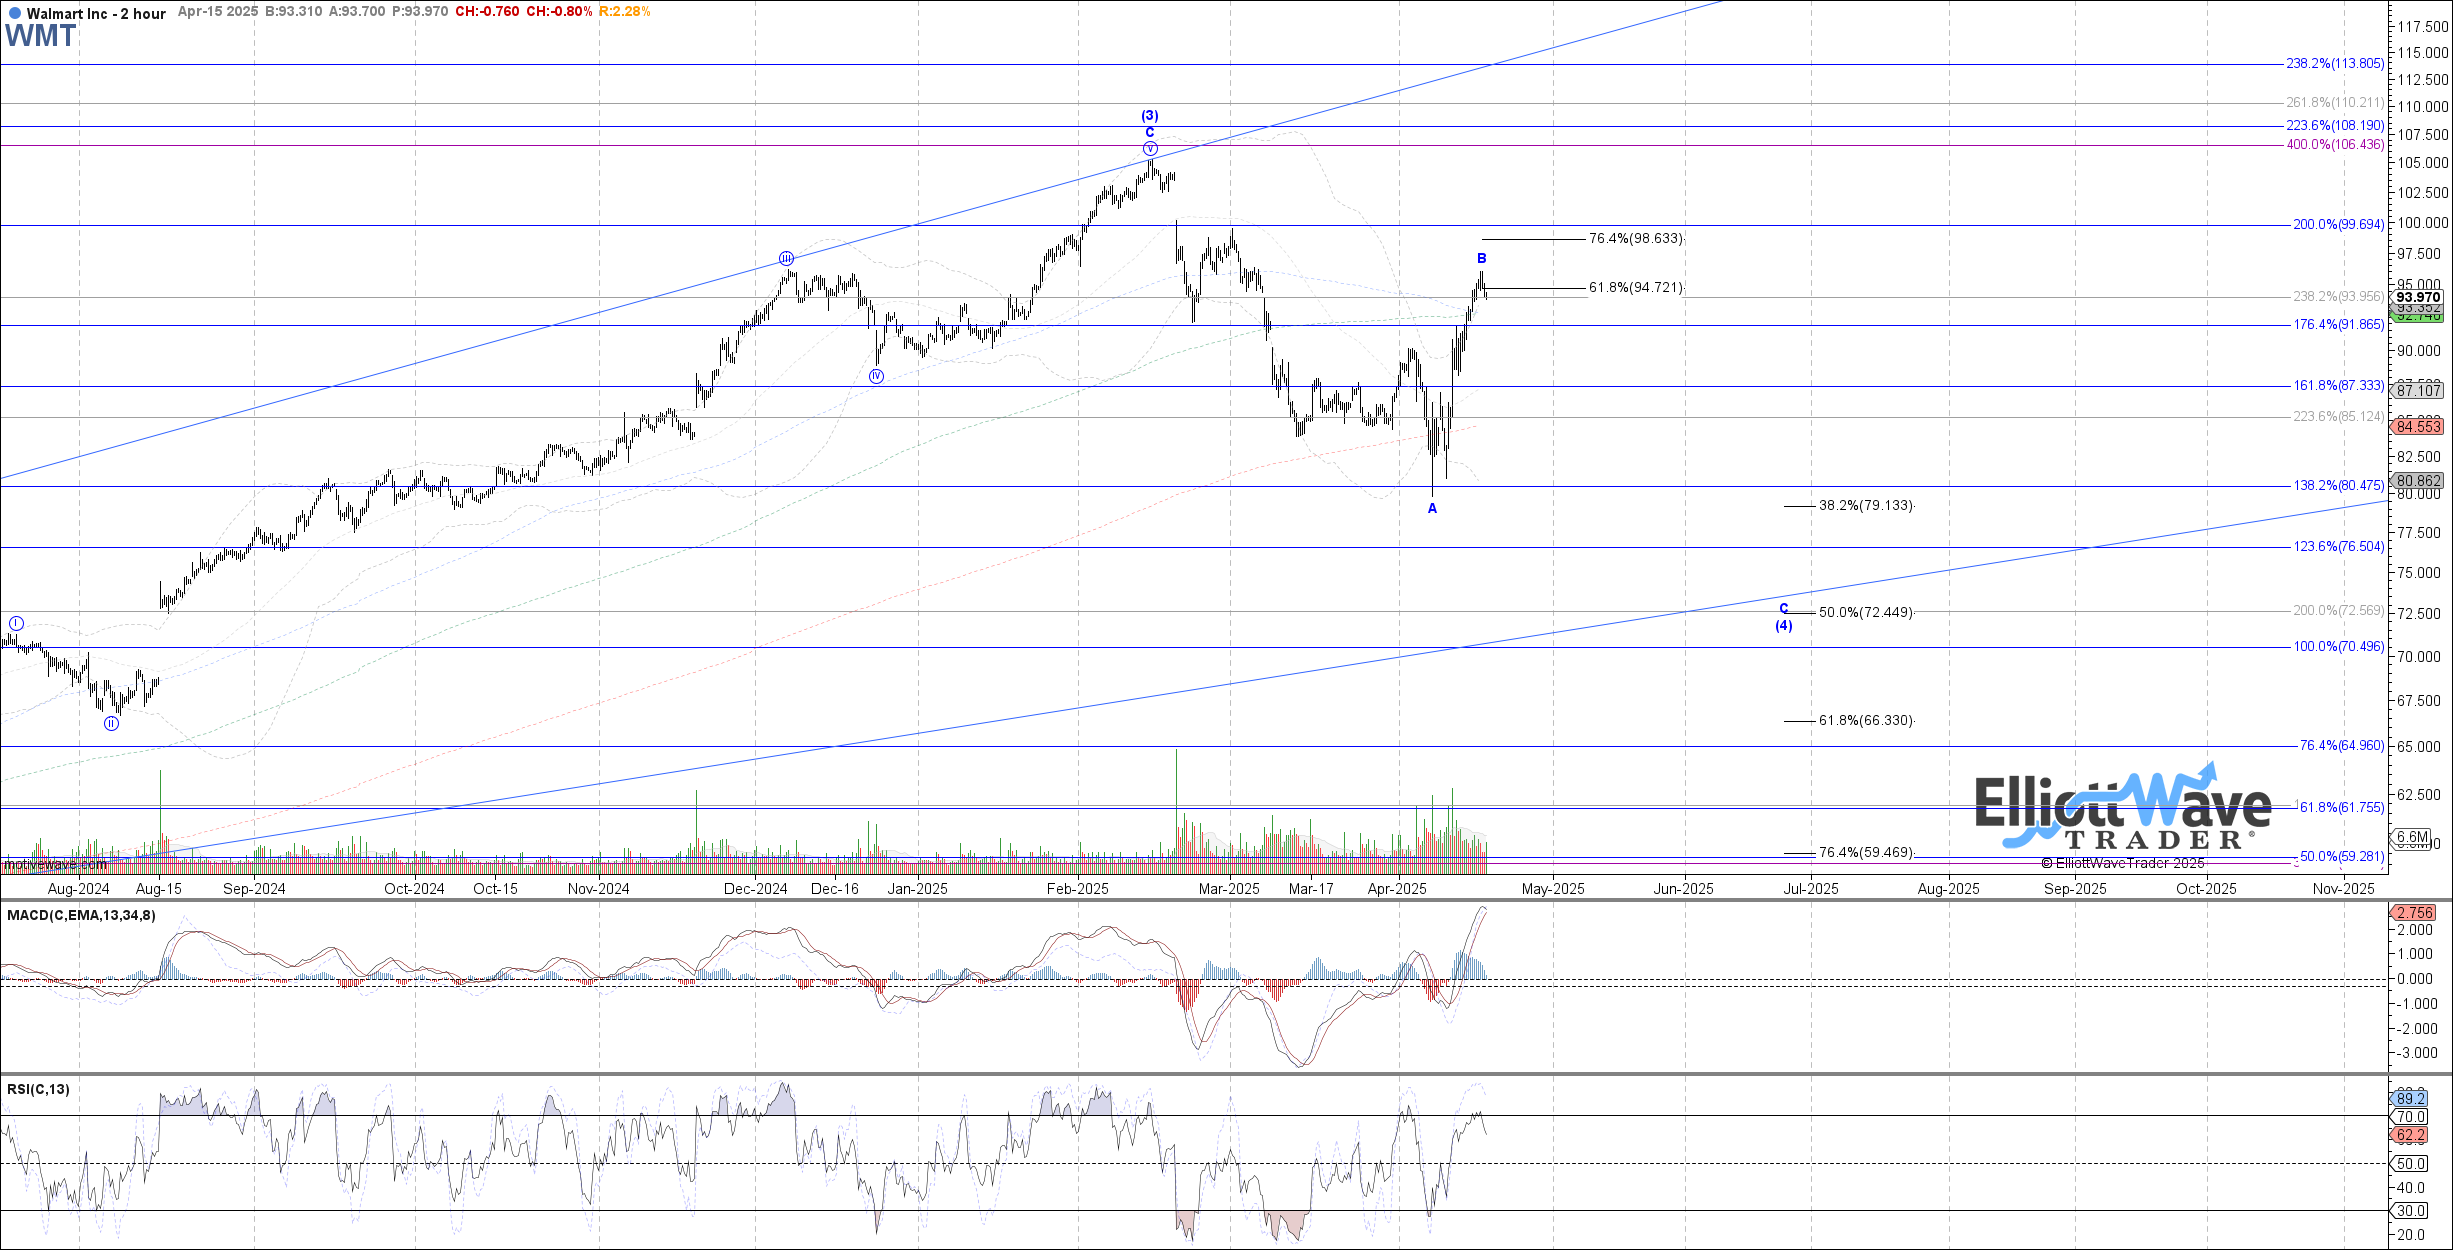
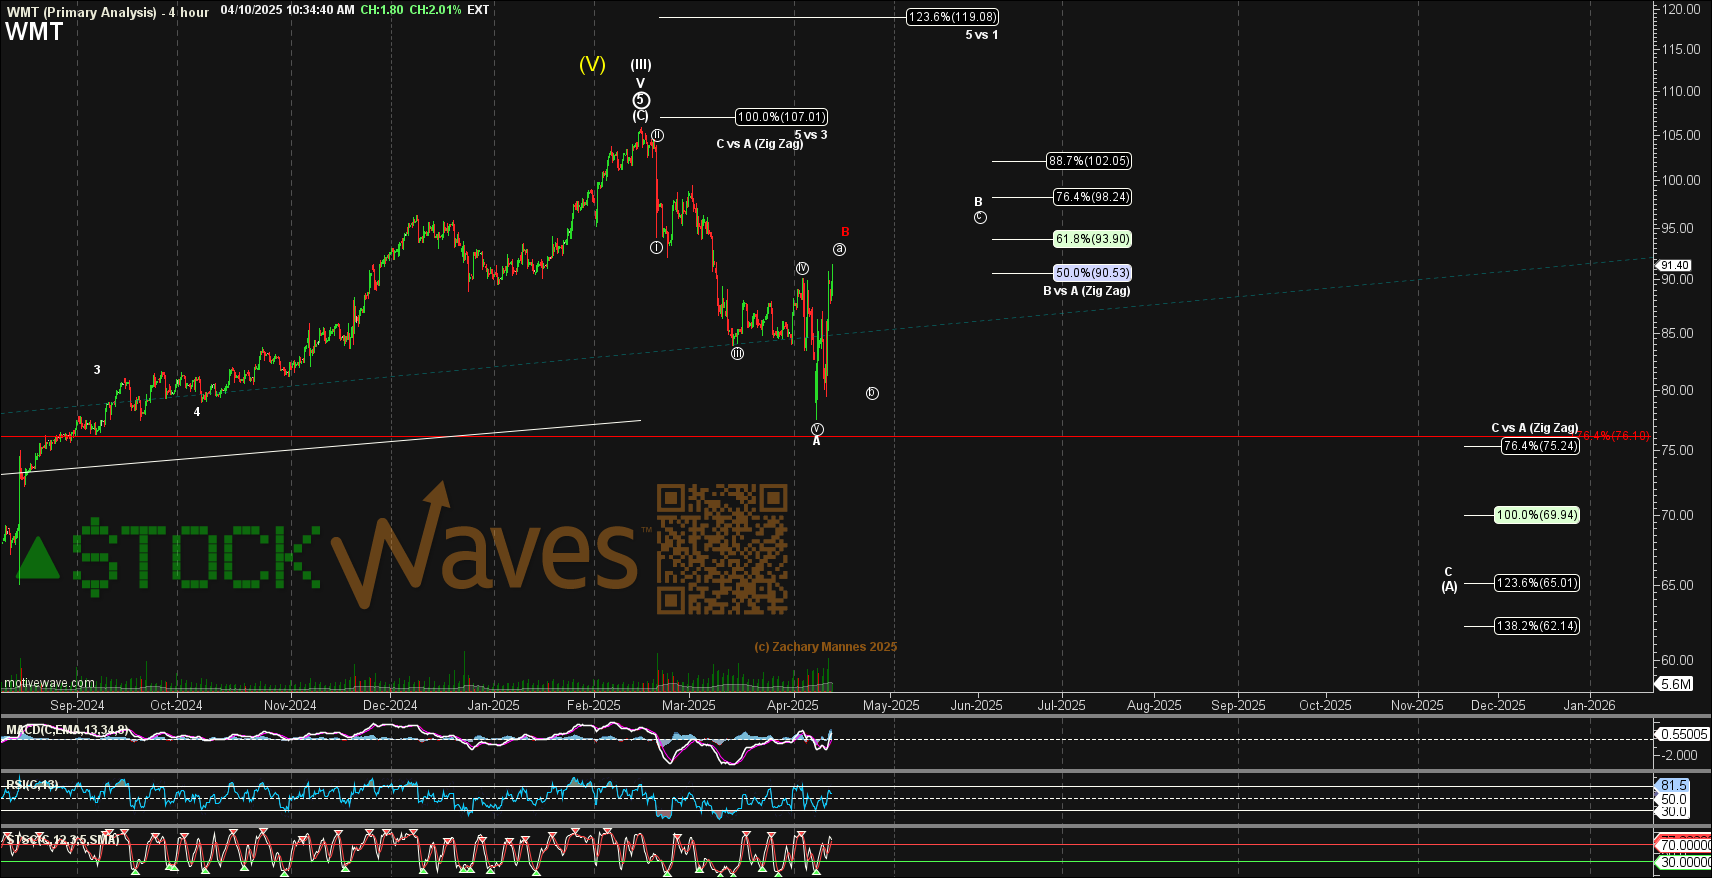
You can readily note that both analysts have a bearish slant. As well, there is a good possibility that (WMT) has already struck what may amount to a multi-month, if not multi-year, high. At this moment in time we can identify a bearish setup for the near term. In fact, in our Wave Setups feature, (WMT) has recently been shared as a downside setup with specific parameters.
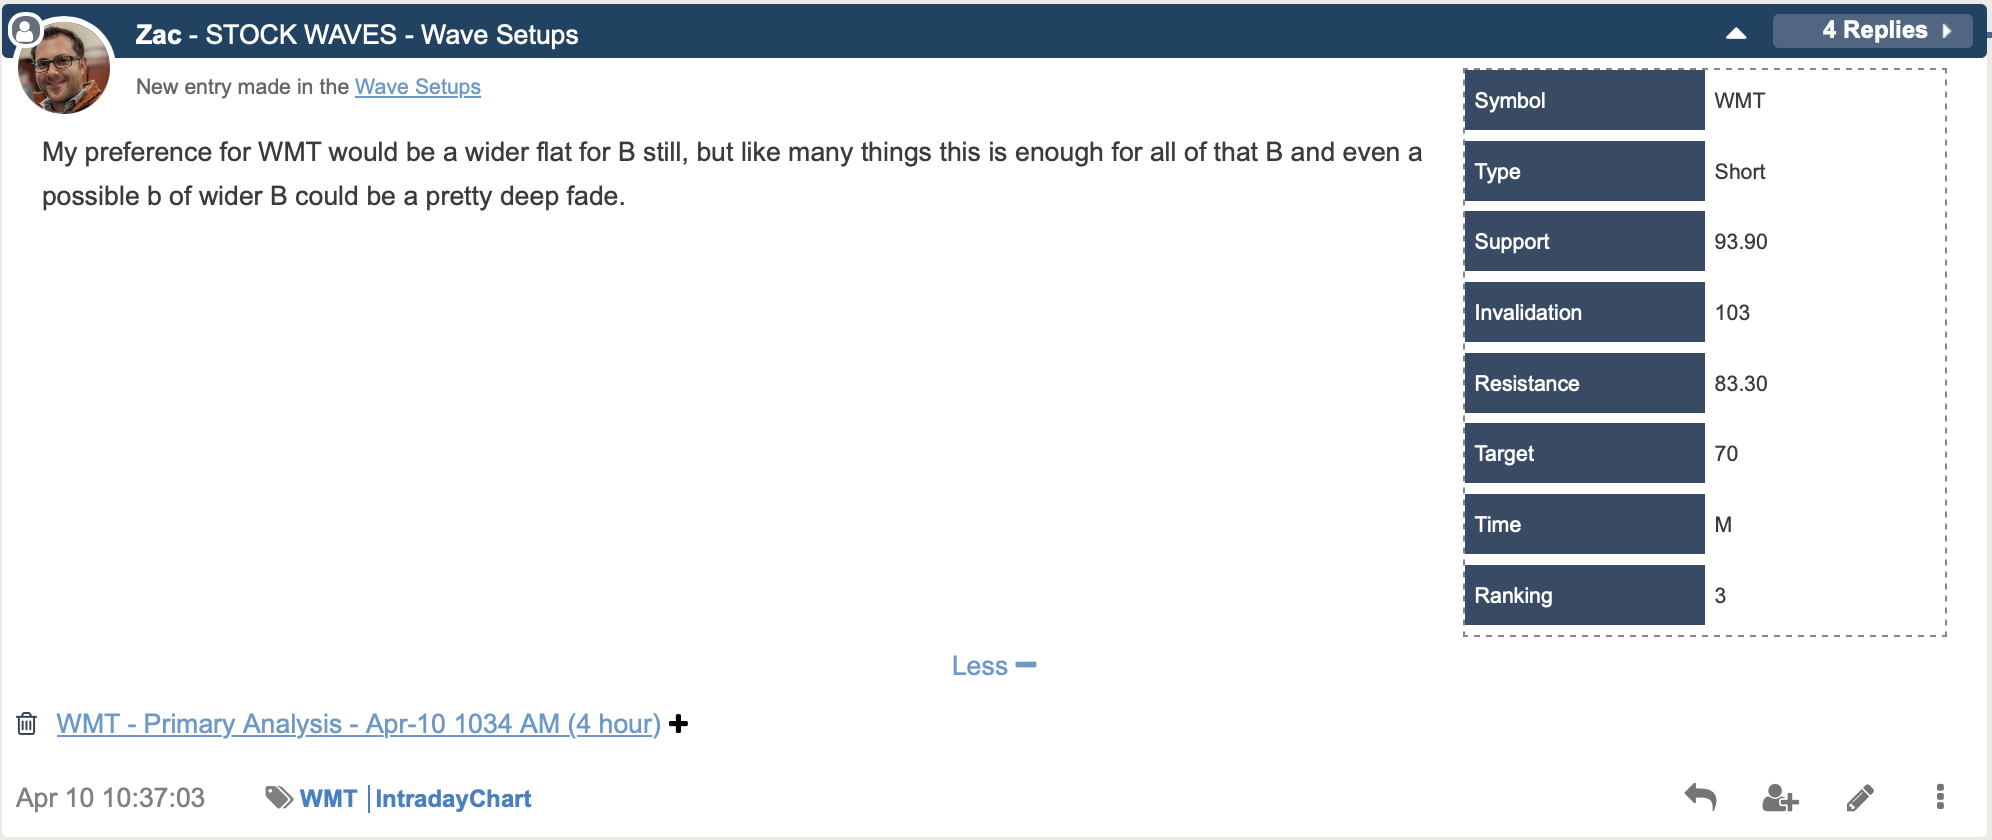
This feature available to our members provides guidance for both bullish and bearish setups. It is a sample of how Elliott Wave theory can be applied to real-life examples. As well, it showcases the dynamic utility of the theory.
Keep in mind that (WMT) could yet muster just a bit more strength in the near term with a higher ‘B’ wave as Zac shows. But, should price form 5 waves down from this area and then a corrective 3 wave bounce, it would further convince us of the downside setup showing up at this time.
Conclusion
Please keep in mind that we provide our perspective by ranking probabilistic market movements based on the structure of the market price action. If we maintain a certain primary perspective as to how the market will move next, and the market breaks that pattern, it clearly tells us that we were wrong in our initial assessment. But here's the most important part of the analysis: We also provide you with an alternative perspective at the same time we provide you with our primary expectation, and let you know when to adopt that alternative perspective before it happens.
There are many ways to analyze and track stocks and the market they form. Some are more consistent than others. For us, this method has proved the most reliable and keeps us on the right side of the trade much more often than not. Nothing is perfect in this world, but for those looking to open their eyes to a new universe of trading and investing, why not consider studying this further? It may just be one of the most illuminating projects you undertake.
(Disclosure: I/we may initiate short positions over the next 72 hours in WMT stock according to the parameters set forth in this article.)
