Where Bitcoin & Ethereum Should Bottom
In the last week, Bitcoin and Ethereum prices met resistance and failed.
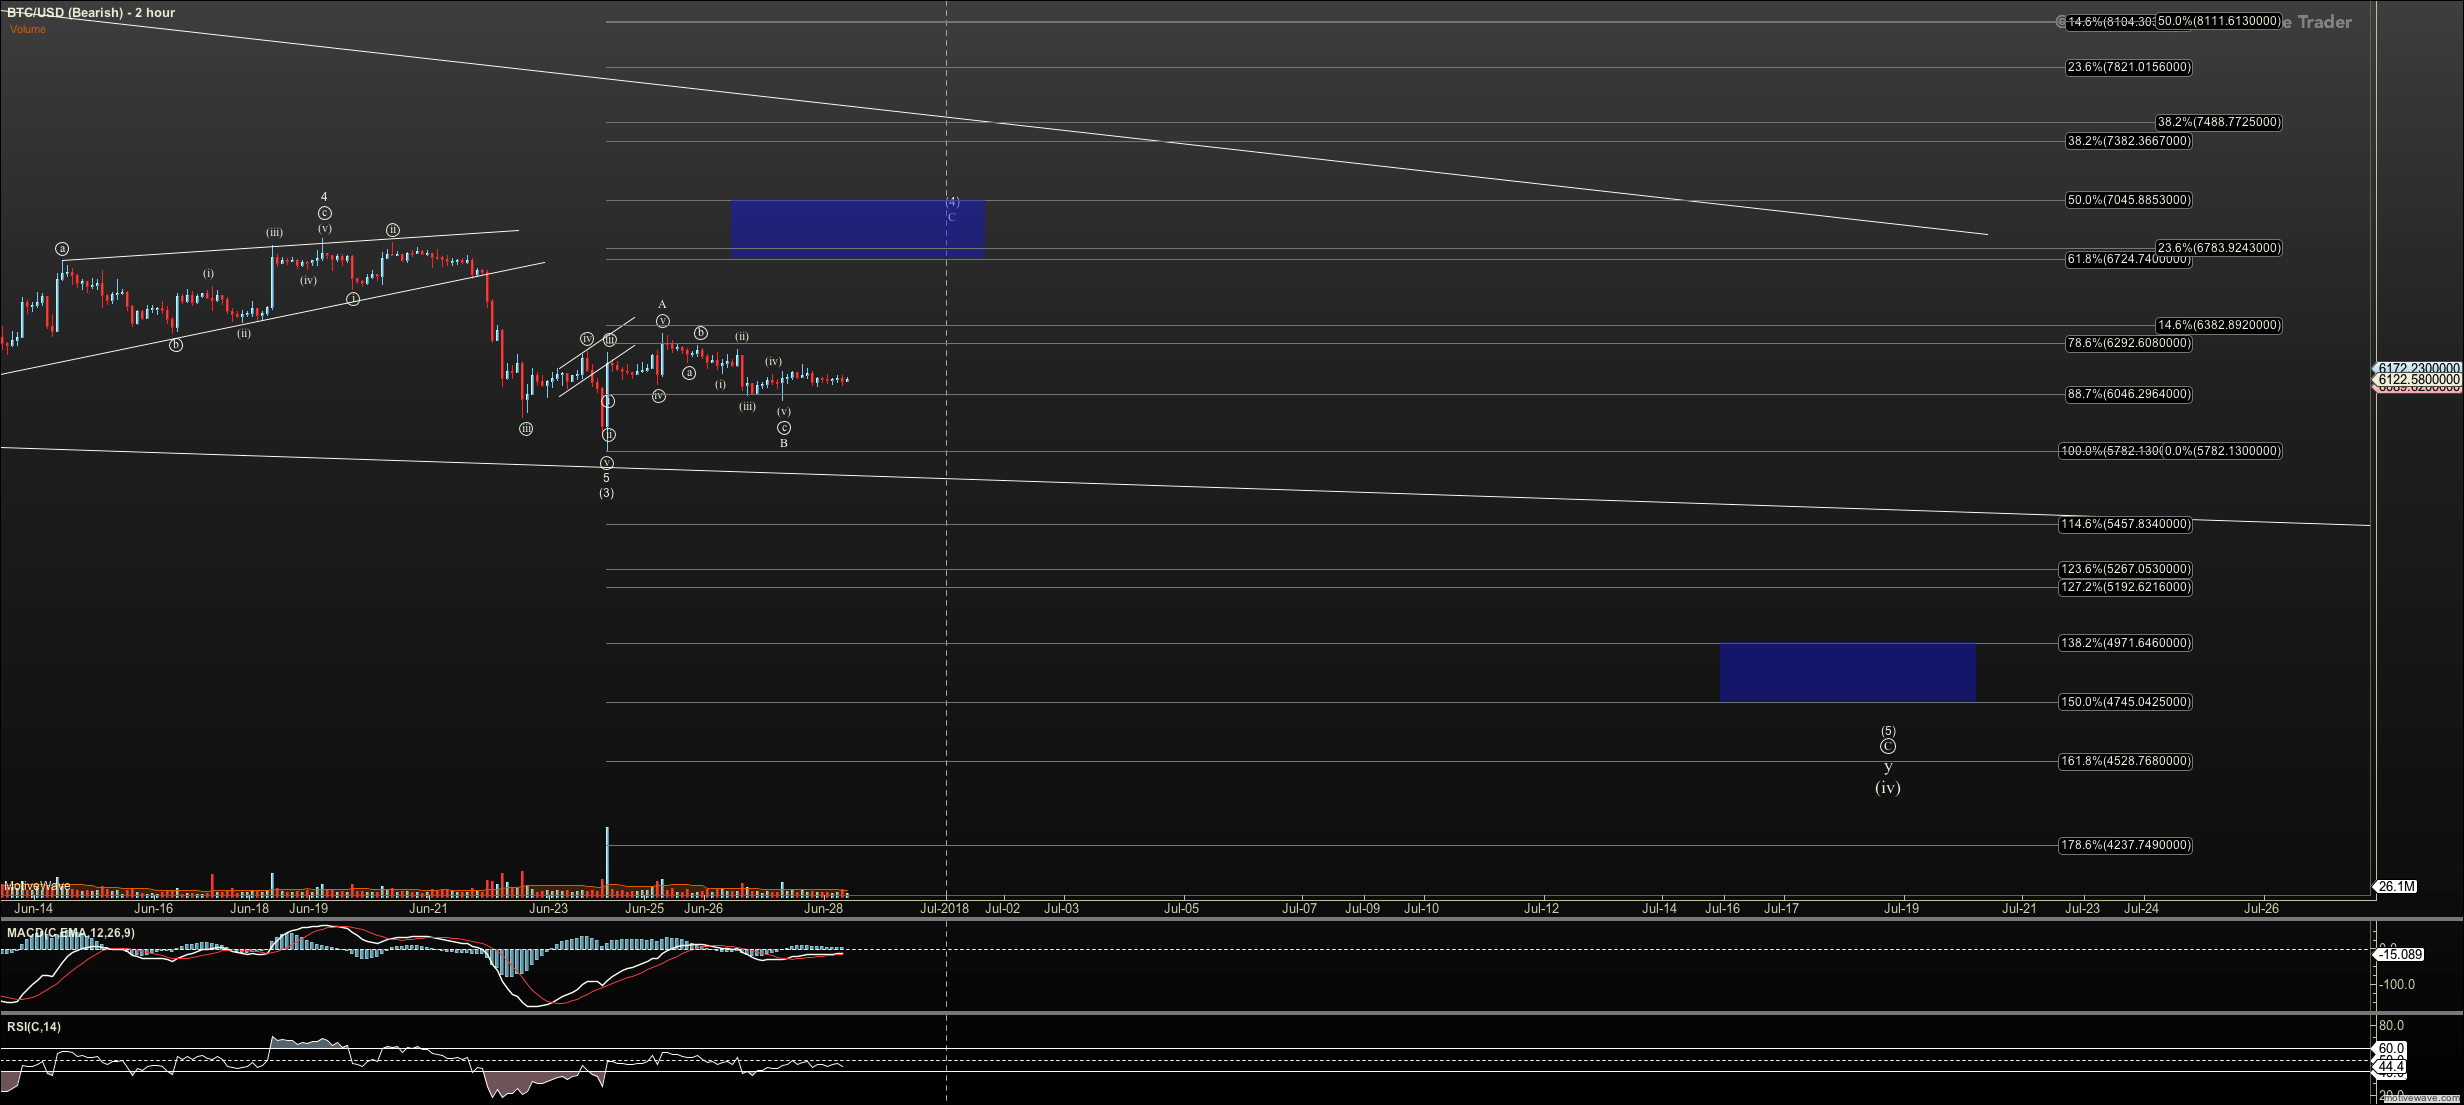
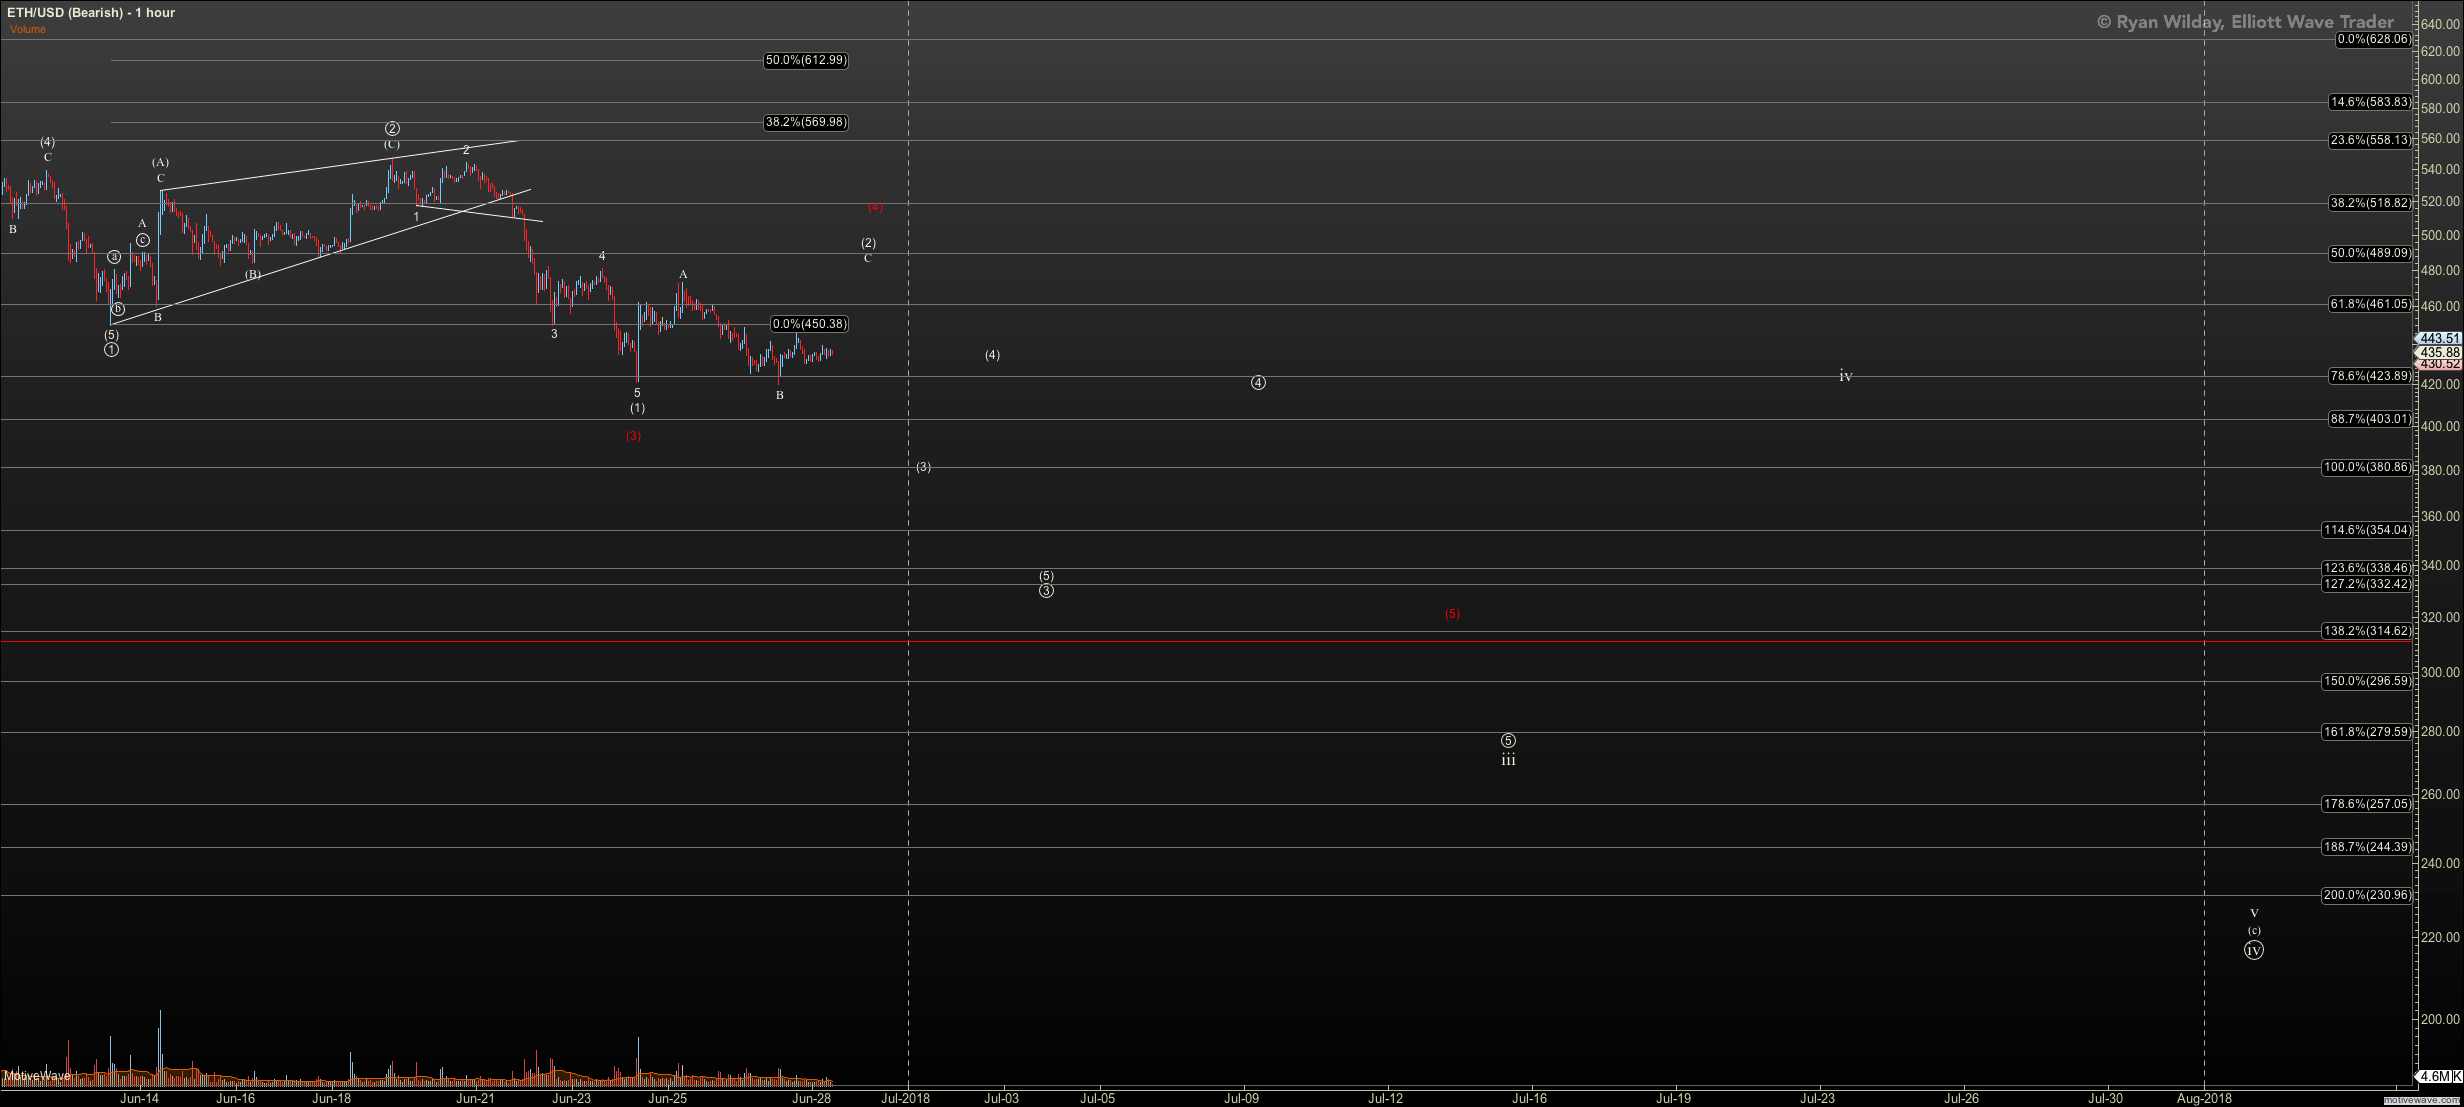
There is the potential for the coins to climb back into a resistance zone running as high as $7045 in Bitcoin and $485 in Ethereum. However, more likely they'll put in a high C wave rally that fails at $6900 in Bitcoin and $419 in Ethereum before turning lower.
On the downside, my primary count considers $4700 the ideal bottom for Bitcoin, with a potential extension to $3000.
Interestingly, with each decline in Bitcoin we've seen a smaller percentage drop in Ethereum even though the latter has classically been a higher-beta coin.
So, given Ethereum's relative outperformance, I don't see it dropping into the $200's, and instead have added the red count which halts in the $300’s. The count is based on an "ending diagonal" pattern rather than a standard impulsive pattern for the C wave.
For short term traders, a C wave into the resistance zone above can be a good short if entered close to resistance at $7045 BTC and $485 ETH. A strong move through those levels would be a good stop in my view.
Long-term traders should wait for lower levels before adding to their portfolio. With the positive divergence we have on charts into the 4-hour timeframes, these levels provide a nice long term entry.
If instead we move over the noted resistance levels, I will looking up and discussing potential paths for a rally.


