Where Fundamentals Meet Technicals: COST, META
This issue of Where Fundamentals Meet Technicals looks at two bearish charts on popular stocks that Zac has presented, to see to what extent the fundamentals agree with the bearishness.
Costco
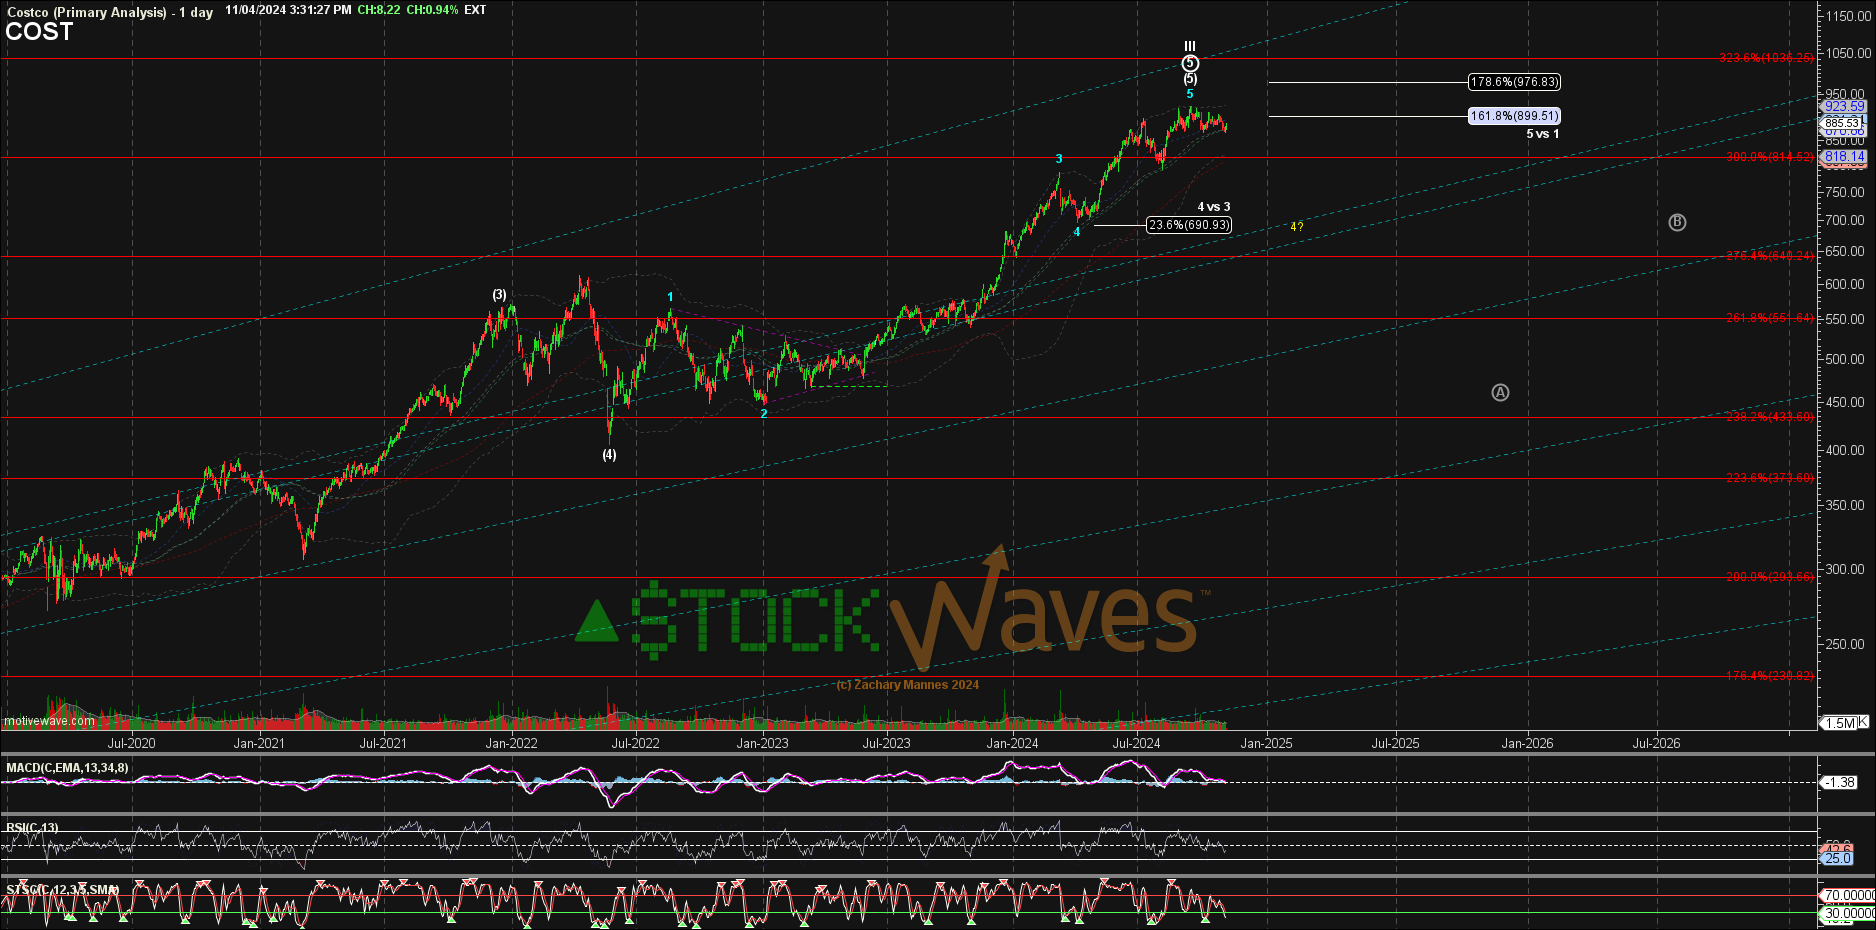
Zac has a rather bearish daily chart for Costco (COST):
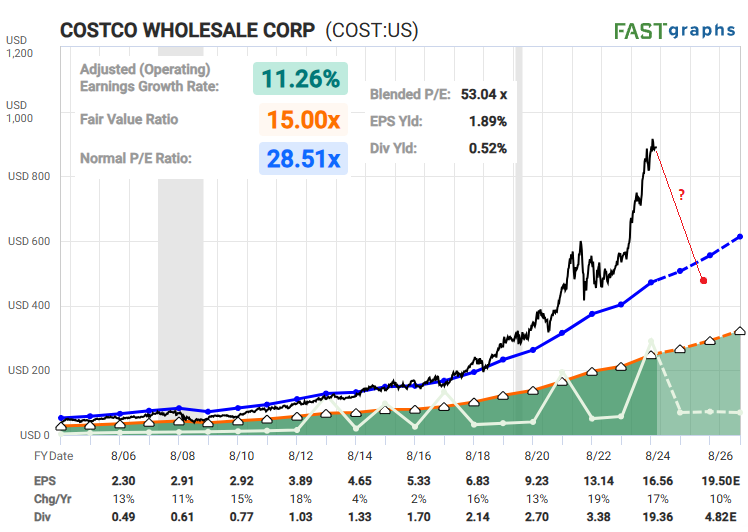
Costco is an amazing company, and one of the rare ones that shareholders, employees, and customers tend to like. But I’ve been using Costco as an example of overvaluation for a while. It trades for about 53x earnings, which is rather hard to justify. Other blue-chip companies like Coca Cola (KO) and Walmart (WMT) that reached 50x earnings back in the late 1990s had dead decades afterward, where their fundamentals kept increasing but their earnings multiples gradually dropped back into the 20s.
If I look at Zac’s “A” wave, it would bring the price back down a bit below the blue line on the FAST Graph, and thus would basically be mean revision in terms of valuation:
I’m perhaps not quite that bearish. I don’t really see a catalyst to drop it that quickly, but rather tend to think it’ll fall a bit and chop around for a while. Valuation can’t tell us anything about timing, but usually non-tech blue chips that get this overpriced tend to take a while to deflate. So I agree directionally (bearish), but I don’t really know how the magnitude or timing will play out.
Meta
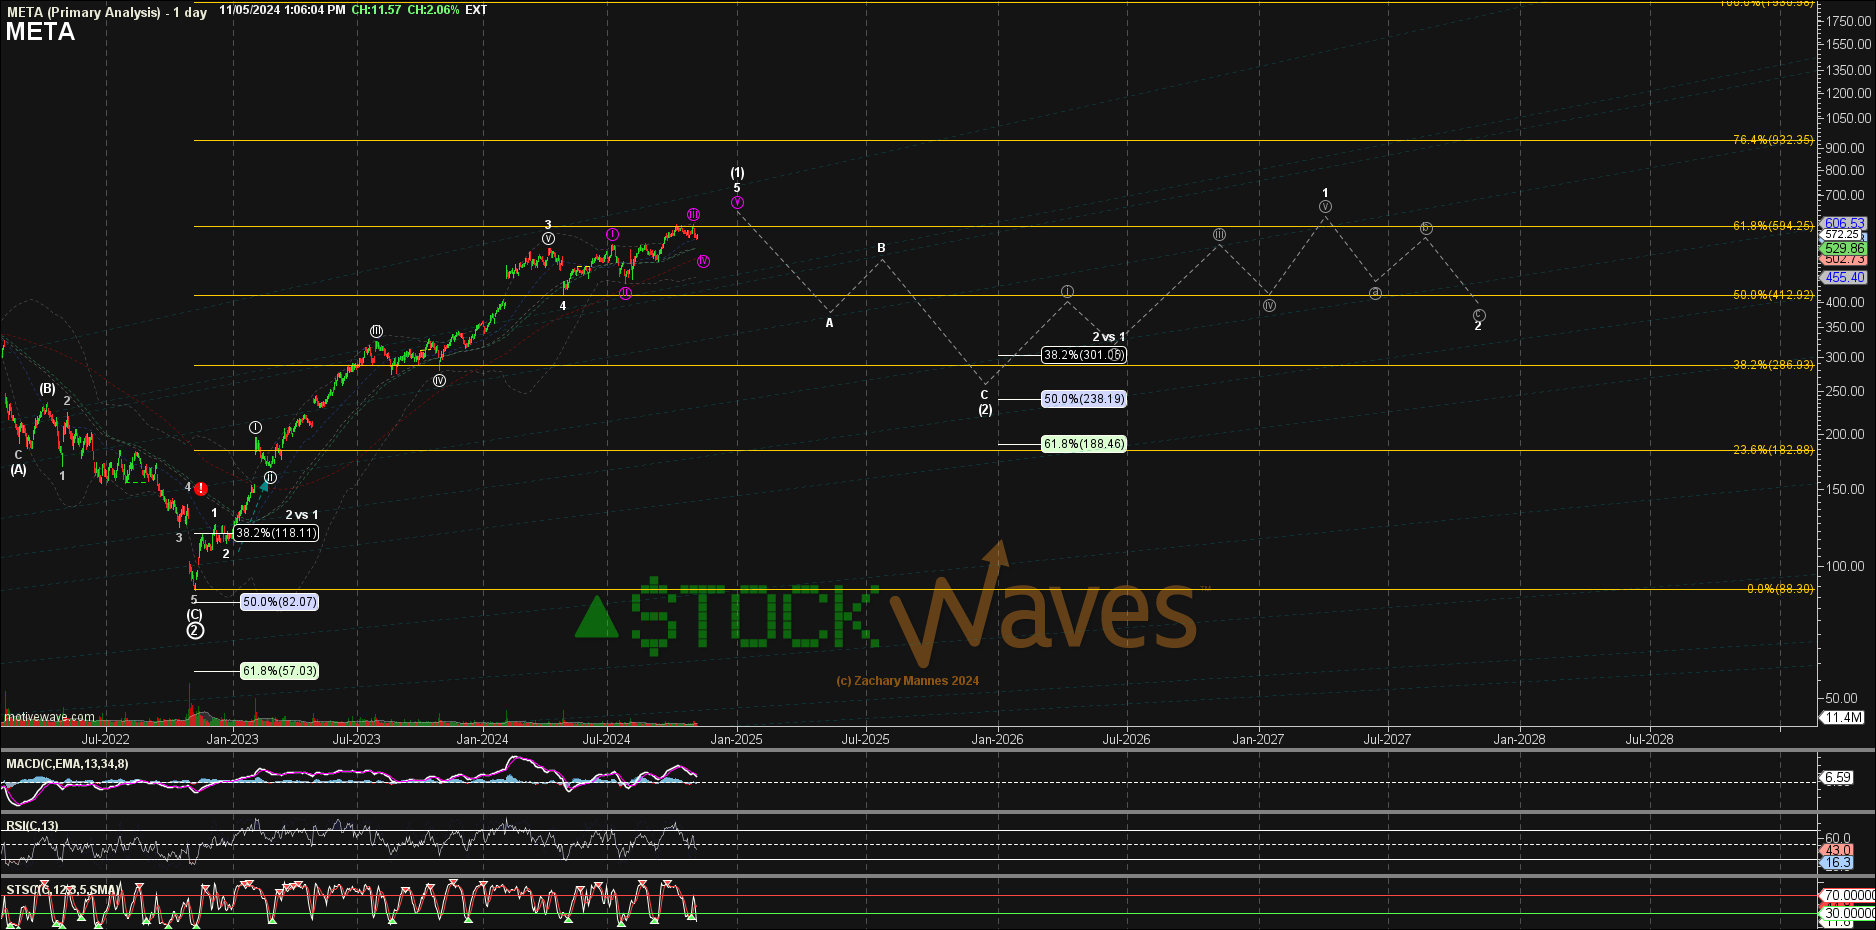
Although Zac has a ultra-long term bullish weekly chart for Meta (META), he does have a rather bearish daily chart for it:
It’s not super bearish, but it’s basically three years of weak choppiness, if it plays out anything like that.
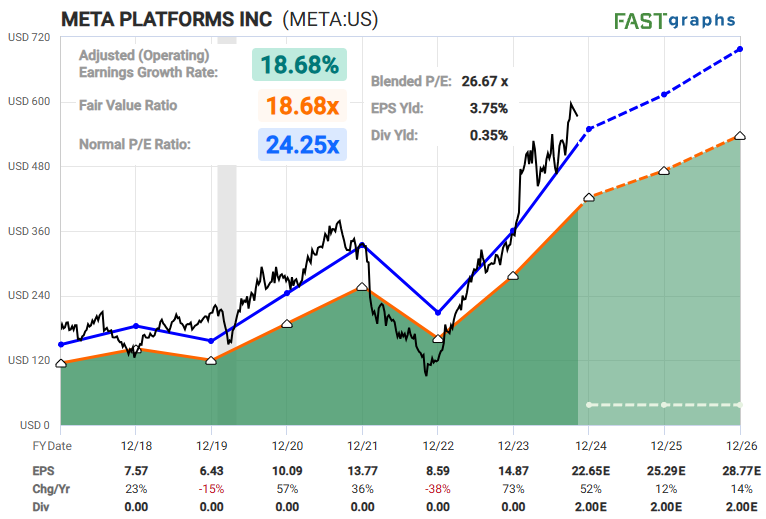
When I compare it to valuations, I’m a bit more bullish, but not by much:
I kind of expect “upward chop” rather than “downward chop” out of Meta, but there are two main groups of fundamental reasons for how it could underperform and look more like Zac’s chart:
-Right now, the company trades for about 26x earnings, which is pretty reasonable, but it could drop down to the lower 20s in a broad market correction or if the company’s growth slows down, or just for no reason other than sentiment.
-Additionally, consensus analysts could be wrong. They currently expect 13% annualized earnings growth over the next two years, but for a variety of reasons that could come in light. Maybe the company will overdo capex on GPUs and slow its earnings growth that way. Or maybe its ad revenue will be soft on the top line, which could weigh down earnings.
Overall, I’m pretty neutral on Meta, which is reasonably similar to how Zac’s chart sees it.


