Where Fundamentals Meet Technicals: SLB and COST
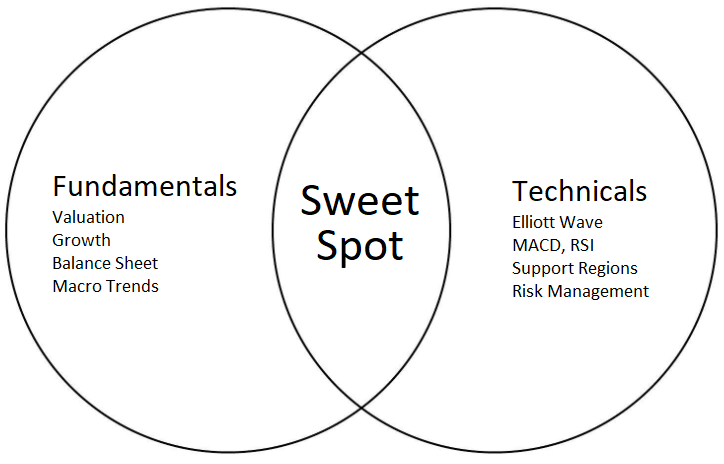
For Stock Waves, I scan for opportunities for where a stock’s fundamentals match its technicals, either bullish or bearish.
This article takes a look at two stocks with potentially divergent outcomes.
SLB
Schlumberger, or SLB (SLB), is an oilfield services company with a global footprint. They are a technology and services provider that helps oil and gas producers extract their product. Additionally, SLB’s portfolio extends into other forms of energy as well.
The 2015-2020 period was brutal for oil and gas companies across the spectrum due to the shale glut. Producers, oilfield services companies, and even many midstream companies ran into hardship. The speed of shale oil growth was a bubble in certain aspects, since it largely consisted of unprofitable drilling and a lot of outside investment.
After several years of being washed out, I believe the industry is on much better footing now. Producers are self-financing a lot of their production out of their cash flows and are focusing on a blend of growth and capital returns rather than just growth at all costs. And shale oil is now part of the global supply/demand balance.
SLB is well-positioned for both onshore and offshore oil production activity, and its acquisition of ChampionX further diversifies its revenue streams.
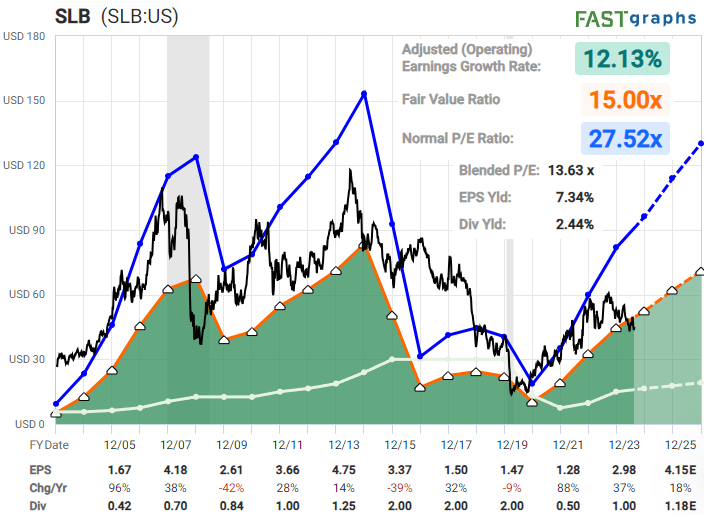
SLB isn’t cheap relative to its industry, since it’s one of the blue chips for the industry, but it’s cheap in absolute terms. The balance sheet is rated A by S&P, and they have large economies of scale and more geographic diversification than many of their peers.
F.A.S.T. Graphs 101:
- black line: the current and historical stock price
- blue line: what the stock price would be if were at its historically average price/earnings ratio
- orange line: a conservative measure of valuation (a 15x price/earnings in this case)
- white line: dividends paid that year (and the payout ratio is relative to the orange line)
- dark/light green: the transition between historical earnings numbers and consensus analysts’ forecast earnings numbers
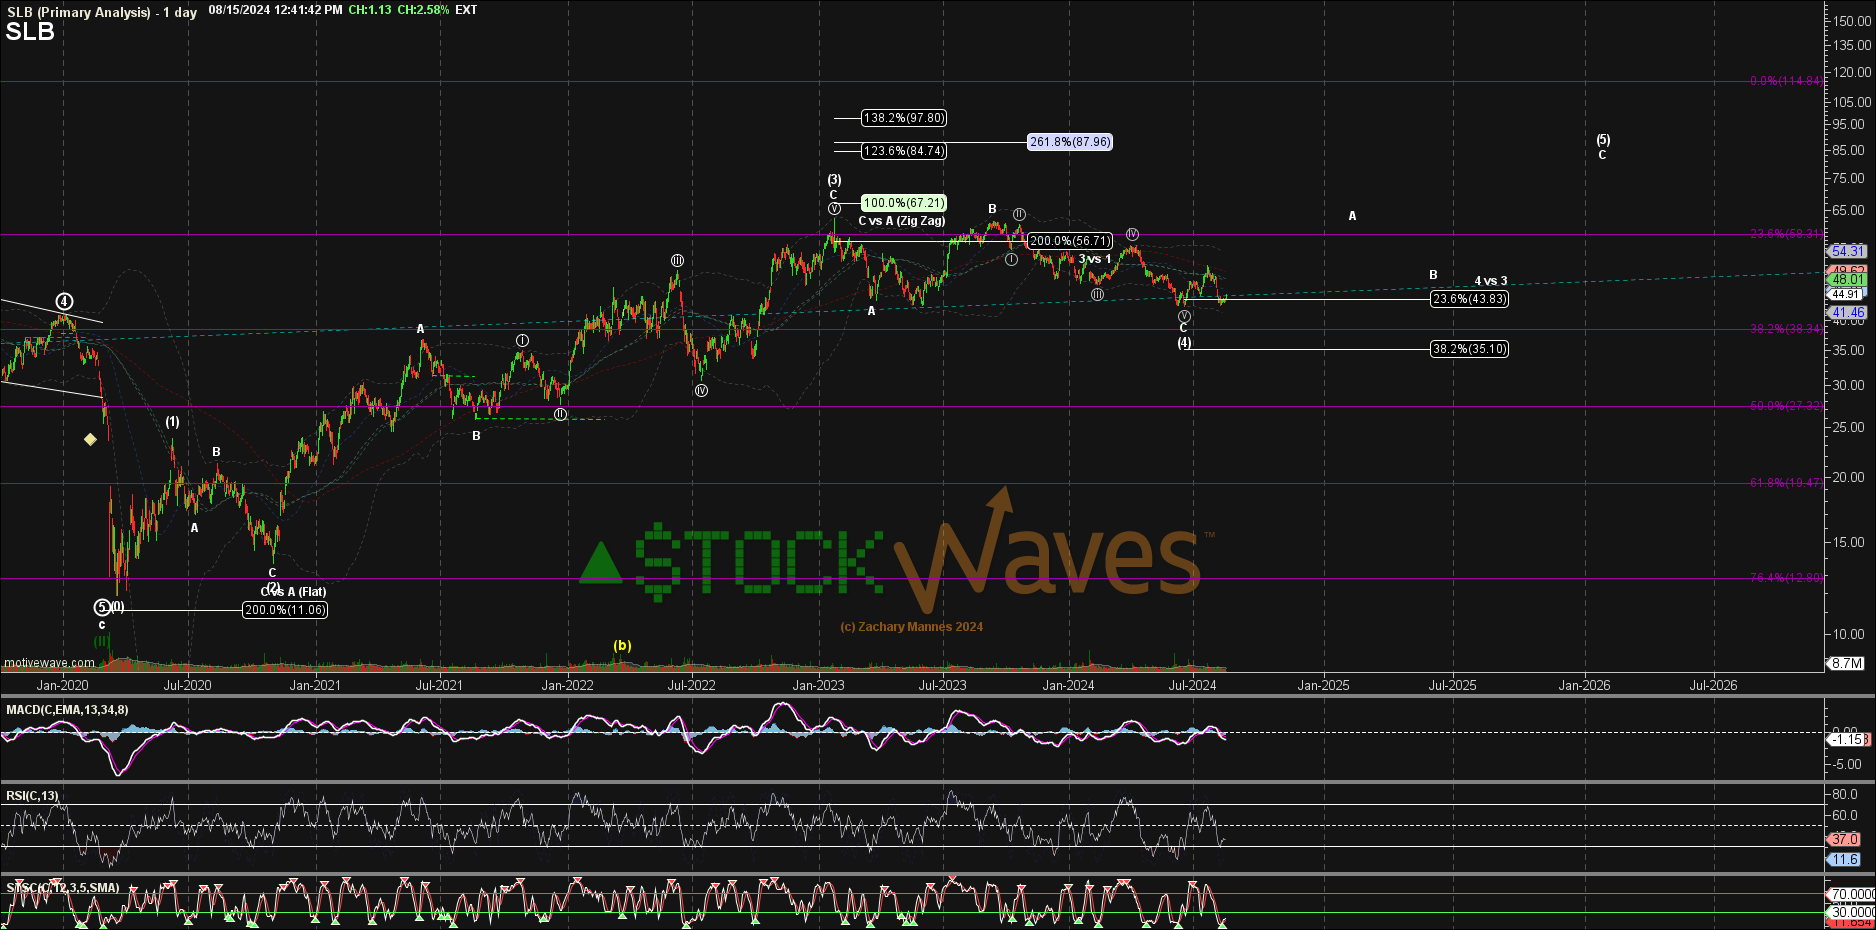
Zac Mannes’ technical analysis suggests that the recent low could be a powerful floor for a while. And if that ends up not being the case, then a trader could use that low as a stop-loss point and then re-enter when the stock finds its footing again.
Costco
Costco (COST) has been one of the best-performing and best-managed companies in the United States for decades. It’s one of the few large companies that seems to make shareholders, employees, and customers happy. Who doesn’t like Costco?
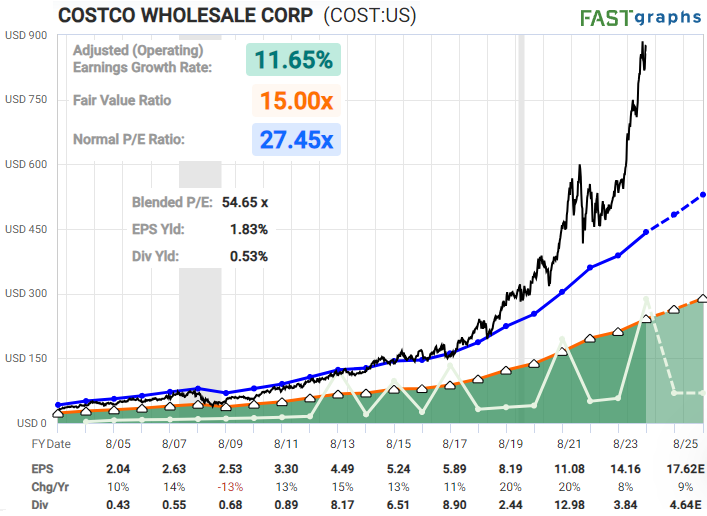
Value investors are probably the only ones that don’t like it at the moment, since it trades for nearly 55x earnings. The fundamentals have been great, but the stock price has soared beyond those fundamentals:
Notably, Costco is trading at more than twice the price/earnings ratio of Alphabet (GOOGL). And at a higher price/earnings ratio than other big tech stocks including Amazon (AMZN), Meta (META), Microsoft (MSFT) and Apple (AAPL). This is despite the fact that Costco’s earnings growth rate, as good as it has been, is comparable to or somewhat less than most of those.
Perhaps it’s the hotdogs.
For context, a similar phenomenon happened back in the late 1990s. Most investors think of that time as the tech bubble, but a bunch of growth-oriented consumer staples and retailers also traded for extremely lofty valuations as well.
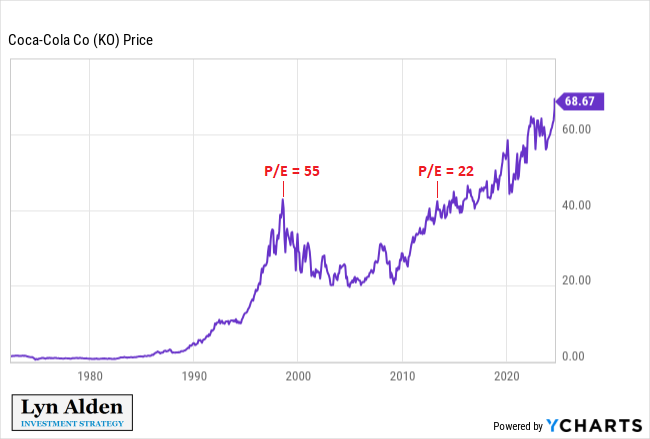
Coca Cola (KO) for example traded at 55x earnings in the late 1990s, which is coincidentally about the same valuation as Costco trades at today. And although Coca Cola’s earnings kept growing from there, it ended up taking their stock price about a decade and a half to recoup those late-90s highs. By the time it did, it was trading at a more reasonable 22x earnings.
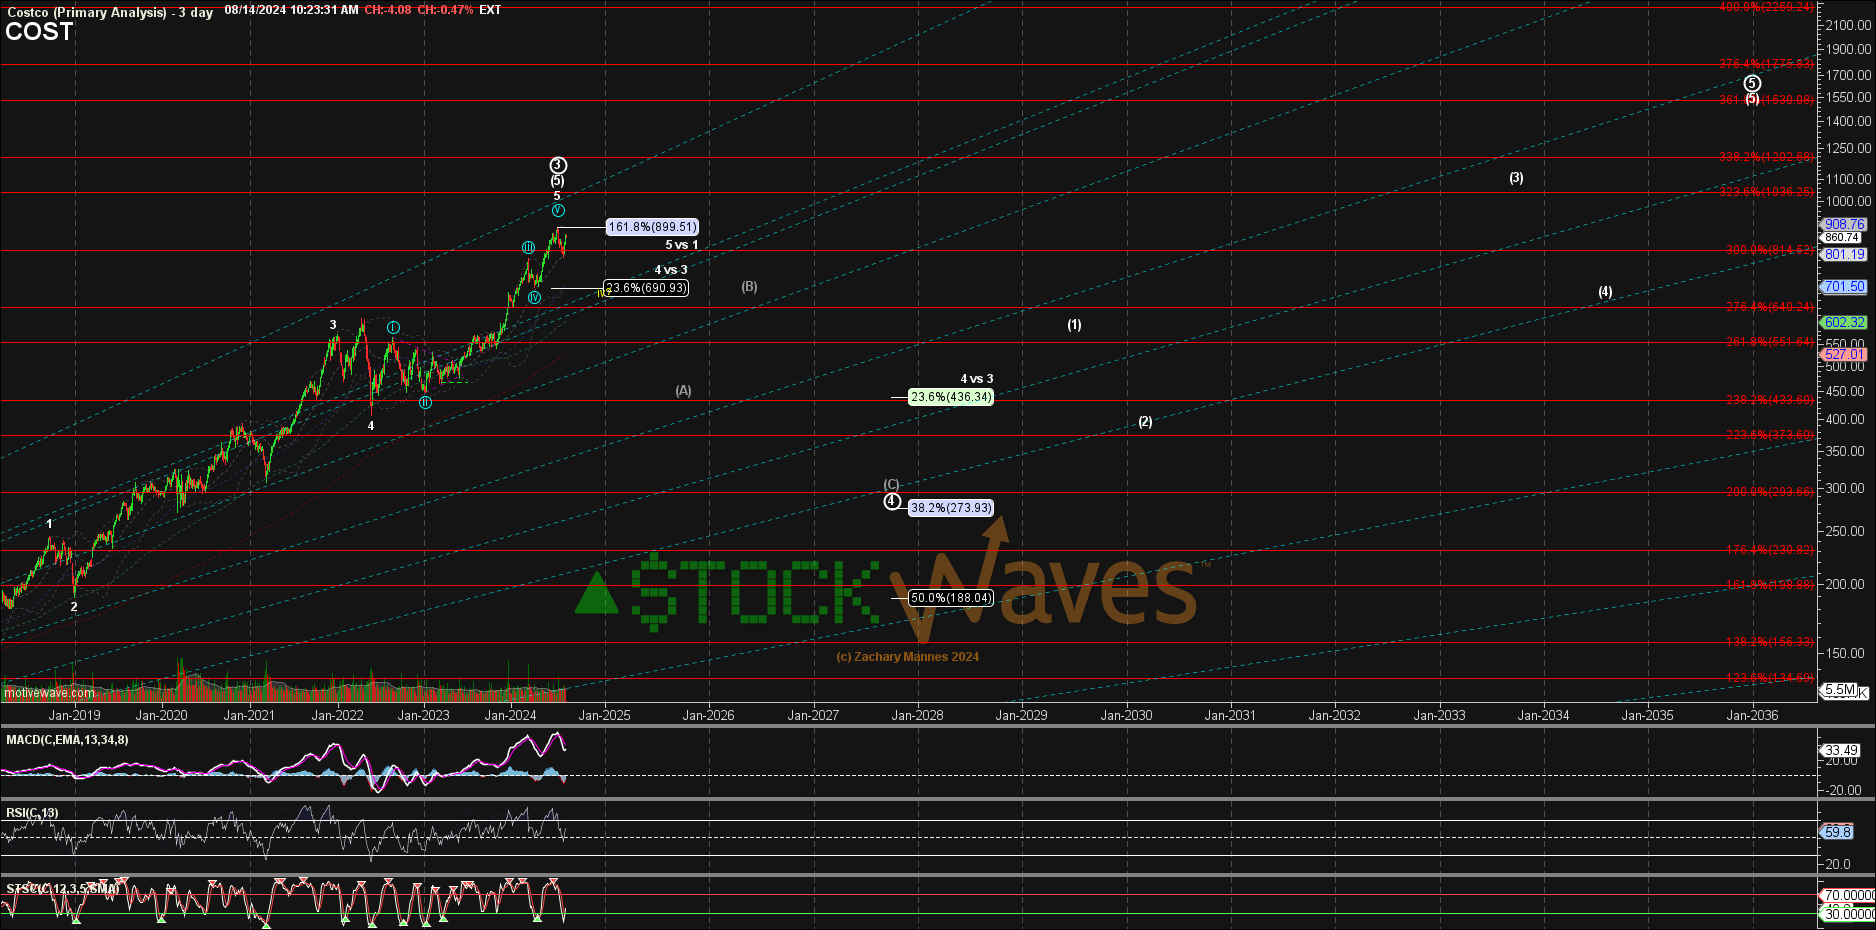
I have concerns that Costco might face a similar outcome, where its fundamentals keep doing well, but its valuation trends back down to a more normal level, resulting in a period of weak forward returns.
Zac’s technicals suggest that Costco could have a forward chart that looks a lot like Coca Cola’s once did:
Will that happen? I have no idea. It could power higher for a while and then correct. It could stagnate sideways for years as earnings catch up. Or it could correct down quite a bit.
But what I do know, is that I don’t like the risk/reward at 55x earnings. There’s not much of a margin of safety, and it’s very crowded.
A Bubble… in Risk Aversion
In my view, part of what’s driving so much interest in low-volatility growth stocks is the sluggishness of the U.S. and global economy, and general risk-off behavior.
There’s little investor interest in cyclicals, or small caps, or emerging markets. Instead, investors are seeking safety in high-quality stocks, but they’re paying a very expensive price to do so. A good company at too rich of a price can be dangerous.
So ironically, I find there to be more long-term safety in the best-of-breed cyclicals and emerging market stocks, which are very uncrowded and inexpensive. In exchange for taking on more volatility and uncertainty in the near term, the chance of a lost decade in these areas seems lower, especially when diversified across a large number of them.
I consider T-bills and gold to be attractive for defensive parts of a portfolio at this time for investors worried about a recession, in lieu of some of the most expensive growth stocks.

