Wild Week For The U.S. Dollar But Still No Resolution
 By
By
We saw the DXY push sharply higher in the early part of the week only to be rejected and move lower into the end of the week. We still are trading below the high that was struck on January 12th and low that was struck on January 27th. So with that, we still do not have confirmation that we have indeed put in a top nor that we will see another higher high just yet. As I noted previously, from a structural perspective the DXY still would look better with another higher high to complete a five-wave move of the October lows thus giving us a full topping pattern. Should we continue to move lower in the weeks ahead we will finally have a signal that a larger top may indeed be in place but as long as we are above to hold over the low struck on January 27th I am still going to give the benefit of the doubt for this to still see higher levels before that top is indeed in place.
Shorter Timeframes
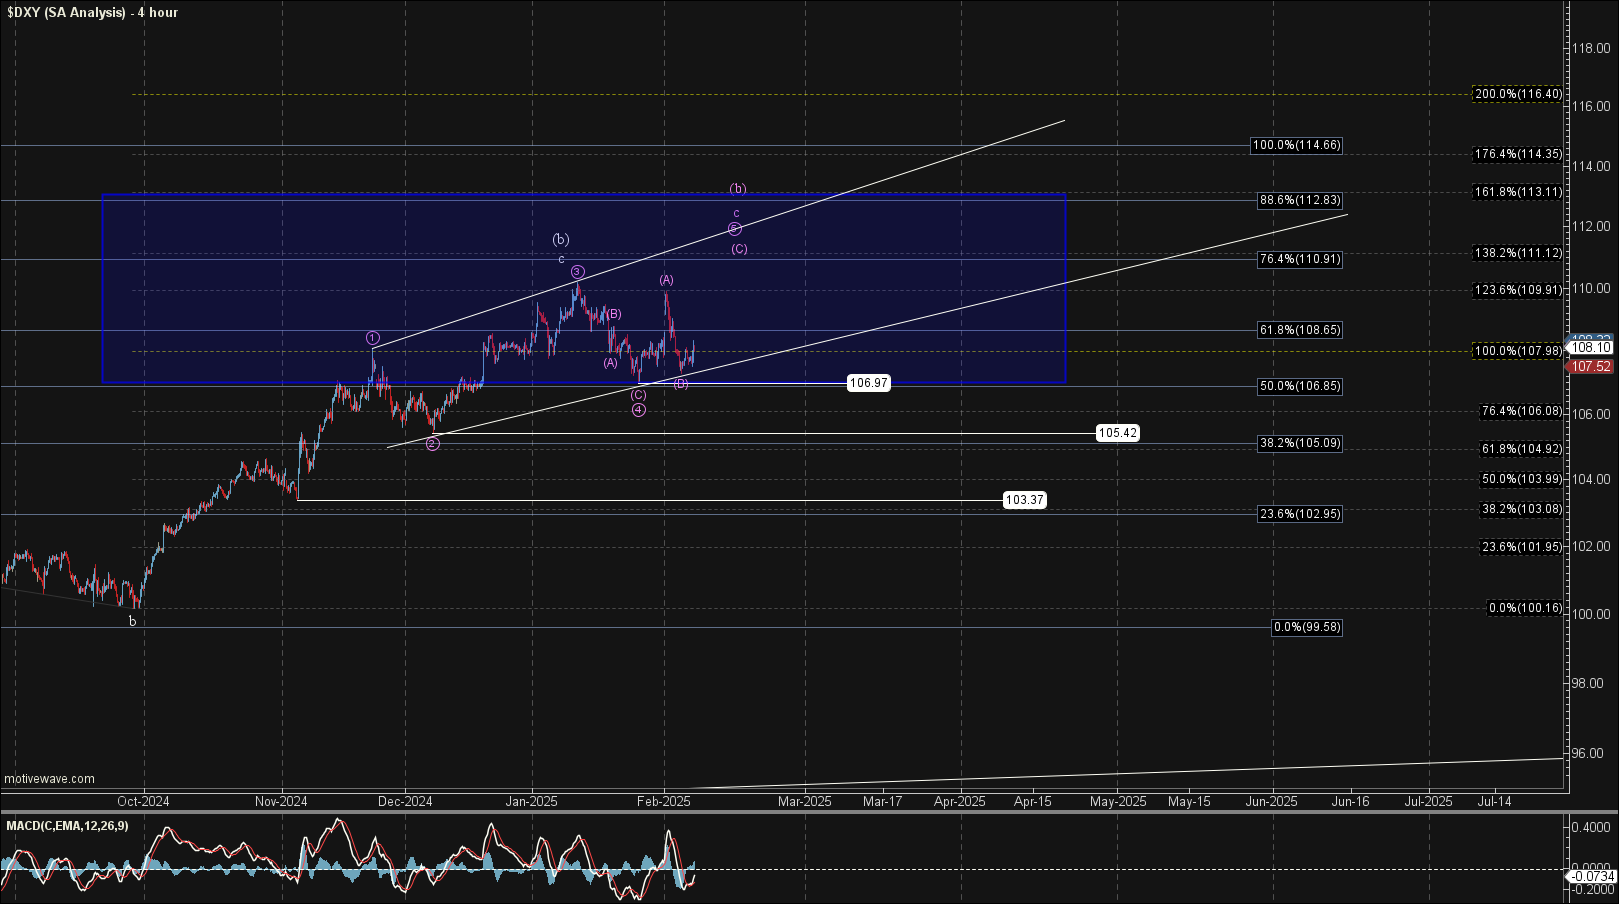
As noted above the pattern still looks incomplete to the upside and would look better with another higher high. If we do see that high however it is likely to come in the form of an ending diagonal to finish off the wave c of the larger wave (b). In order to hold that pattern we would need to see this hold over the January 27th low at the 106.97 level and then continue to push higher over the 110 level to fill out the pattern to the upside. I am counting the move up this week as a potential wave (A) of that final wave ((5)) of c of (b) as shown in purple on the 4-hour chart.
Should we see a break under the 106.97 level followed by a break under 105.42 level then we will have initial confirmation that a top in that wave (b) may indeed be in place. Further confirmation would come with a break under the 103.37 level with final confirmation coming with a break under the October lows at the 100.16 level.
We should also see that the structure of the initial move-down takes the form of five waves. So far the move down off of the highs counts better as three rather than five which is not overly supportive of a top being in place just yet. Should we develop a five-wave move then we should be on our way to our targets down below near the mid to low 90s. At that point, we will have another larger degree test to deal with as laid out in the bigger picture section below.
Bigger Picture
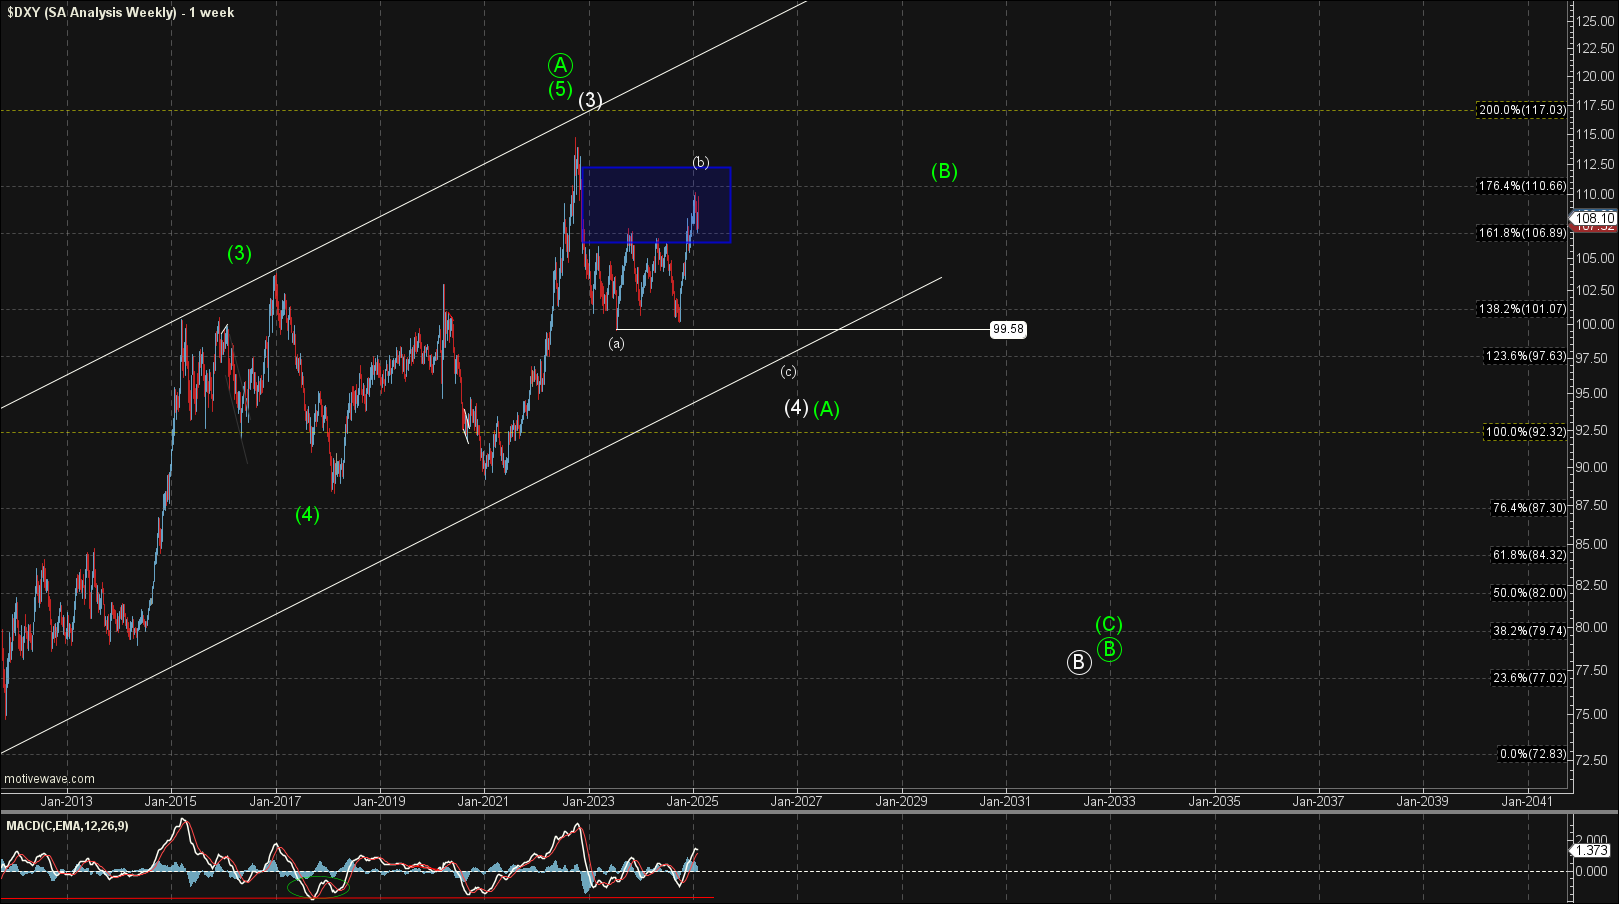
There is still no significant change in the bigger picture count, and as I have noted previously, I am counting the top in October as either the white wave (3) or the green wave (5) of ((A)).
The white count should head down towards the lower trend line to fill out that wave (4) before pushing higher once again to finish off the larger degree wave (5) of ((A)). The exact bottoming level for this potential wave (4) has become a bit more clear as noted above as we have likely topped in the wave (b) of that (4). Ideally, I would be looking for that to come in at the 93.11-90.20 region as this is the target zone for the wave (c).
The green count is suggestive that we have topped in all of the larger degree wave ((A)) and we are already in the wave ((B)) down. Both the white and the green counts are going to look very similar in the early stages of this move as they both are corrective in nature. The green count of course would give us a much deeper retrace for that larger wave ((B)) before turning higher.