World Markets: Asia/Pacific
 By
By
ASIA/PACIFIC
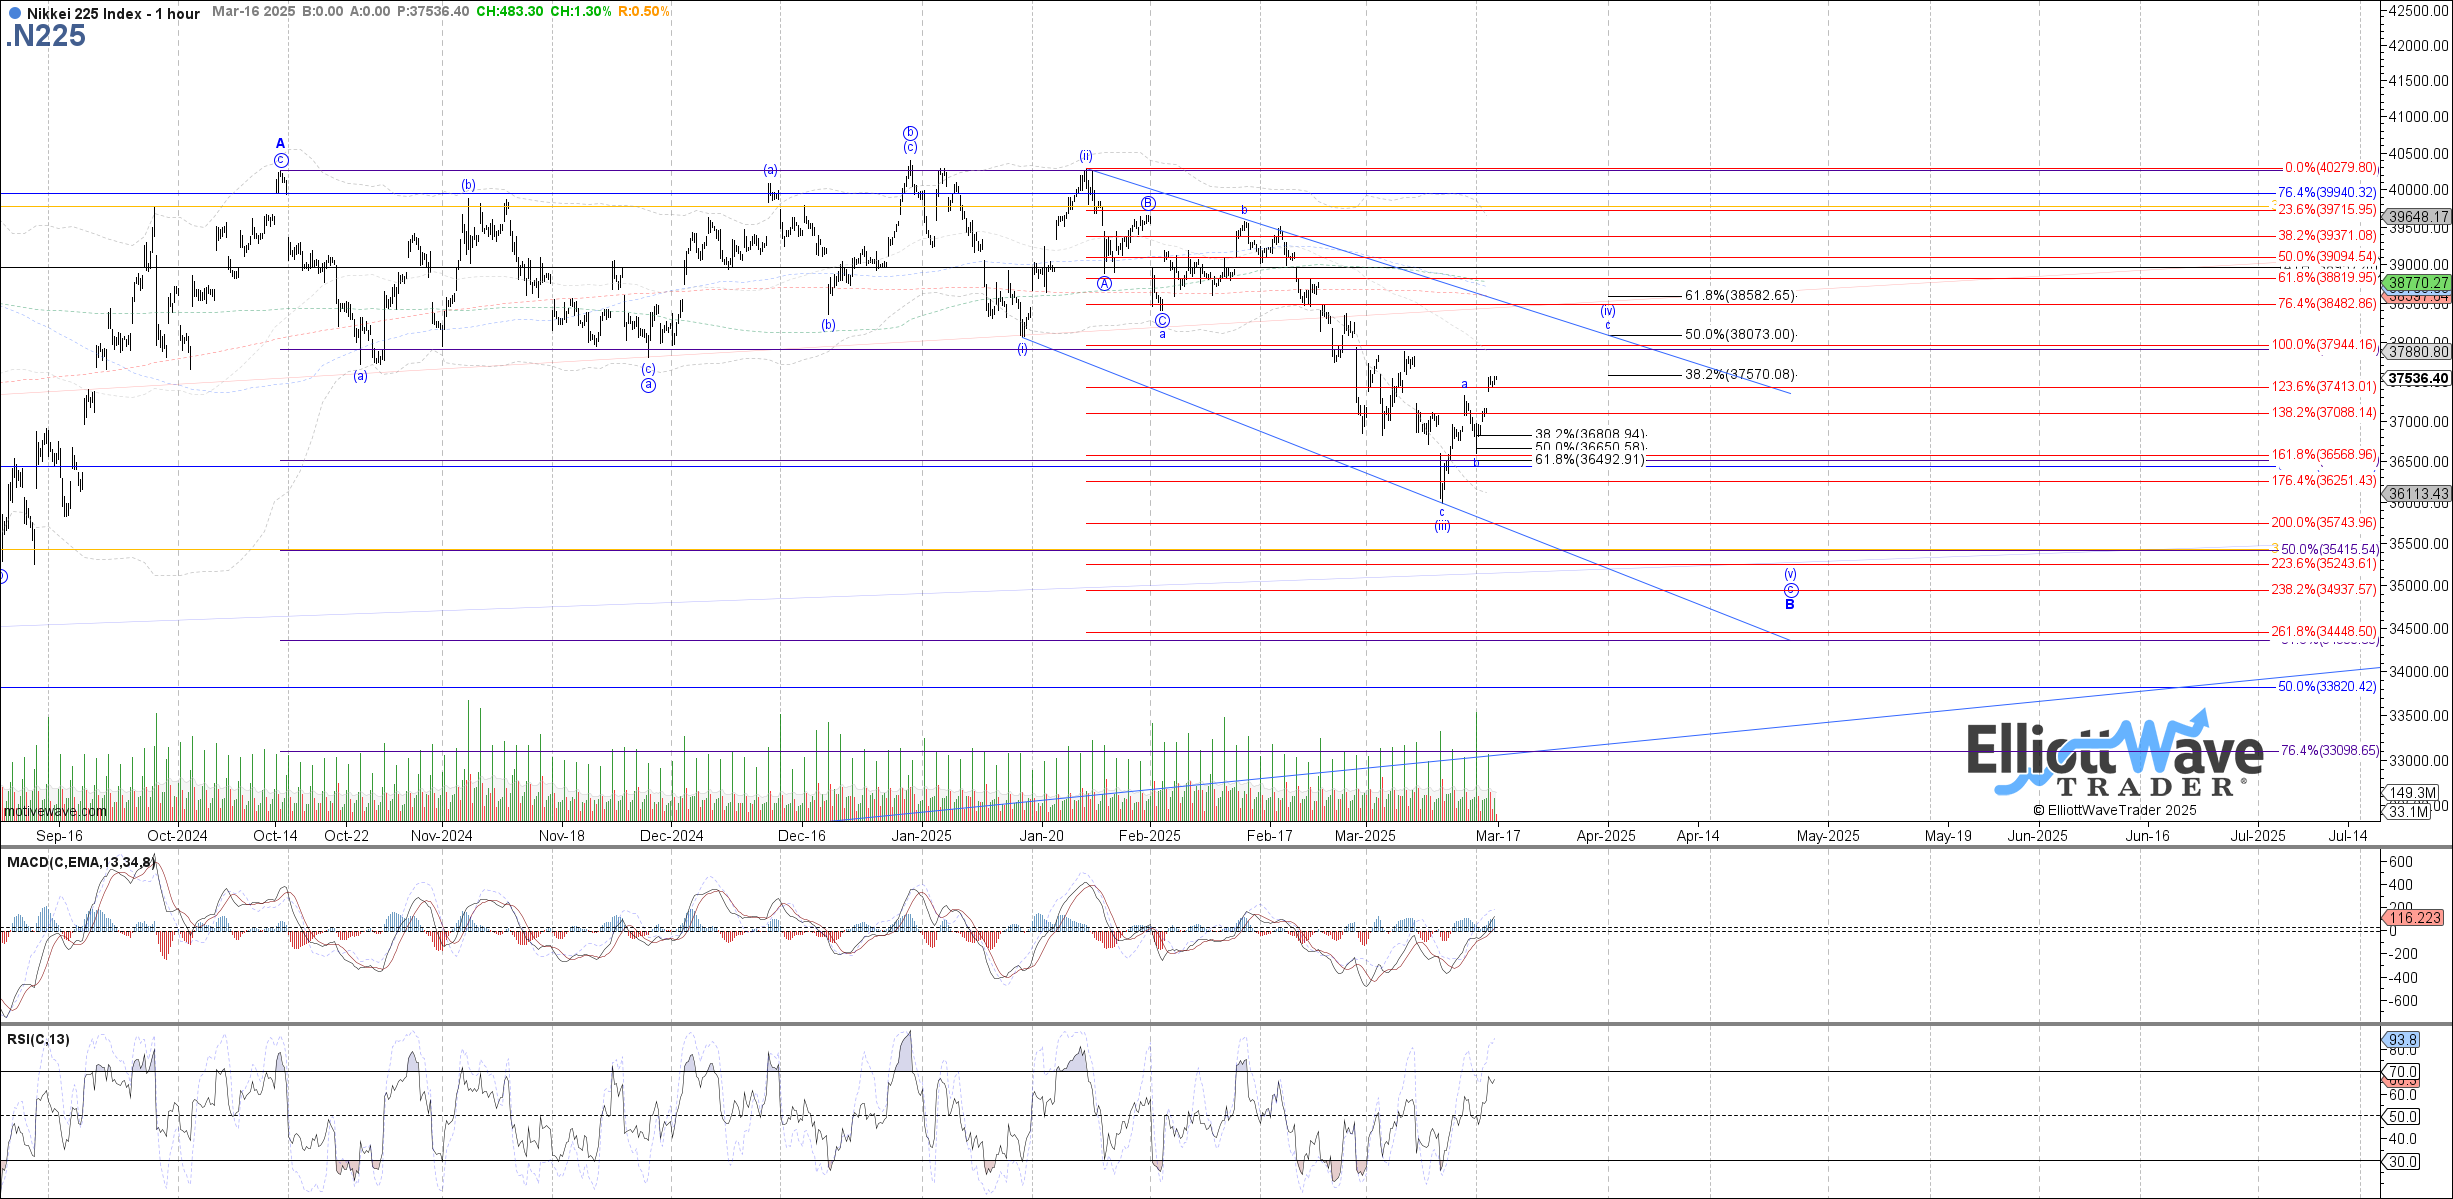
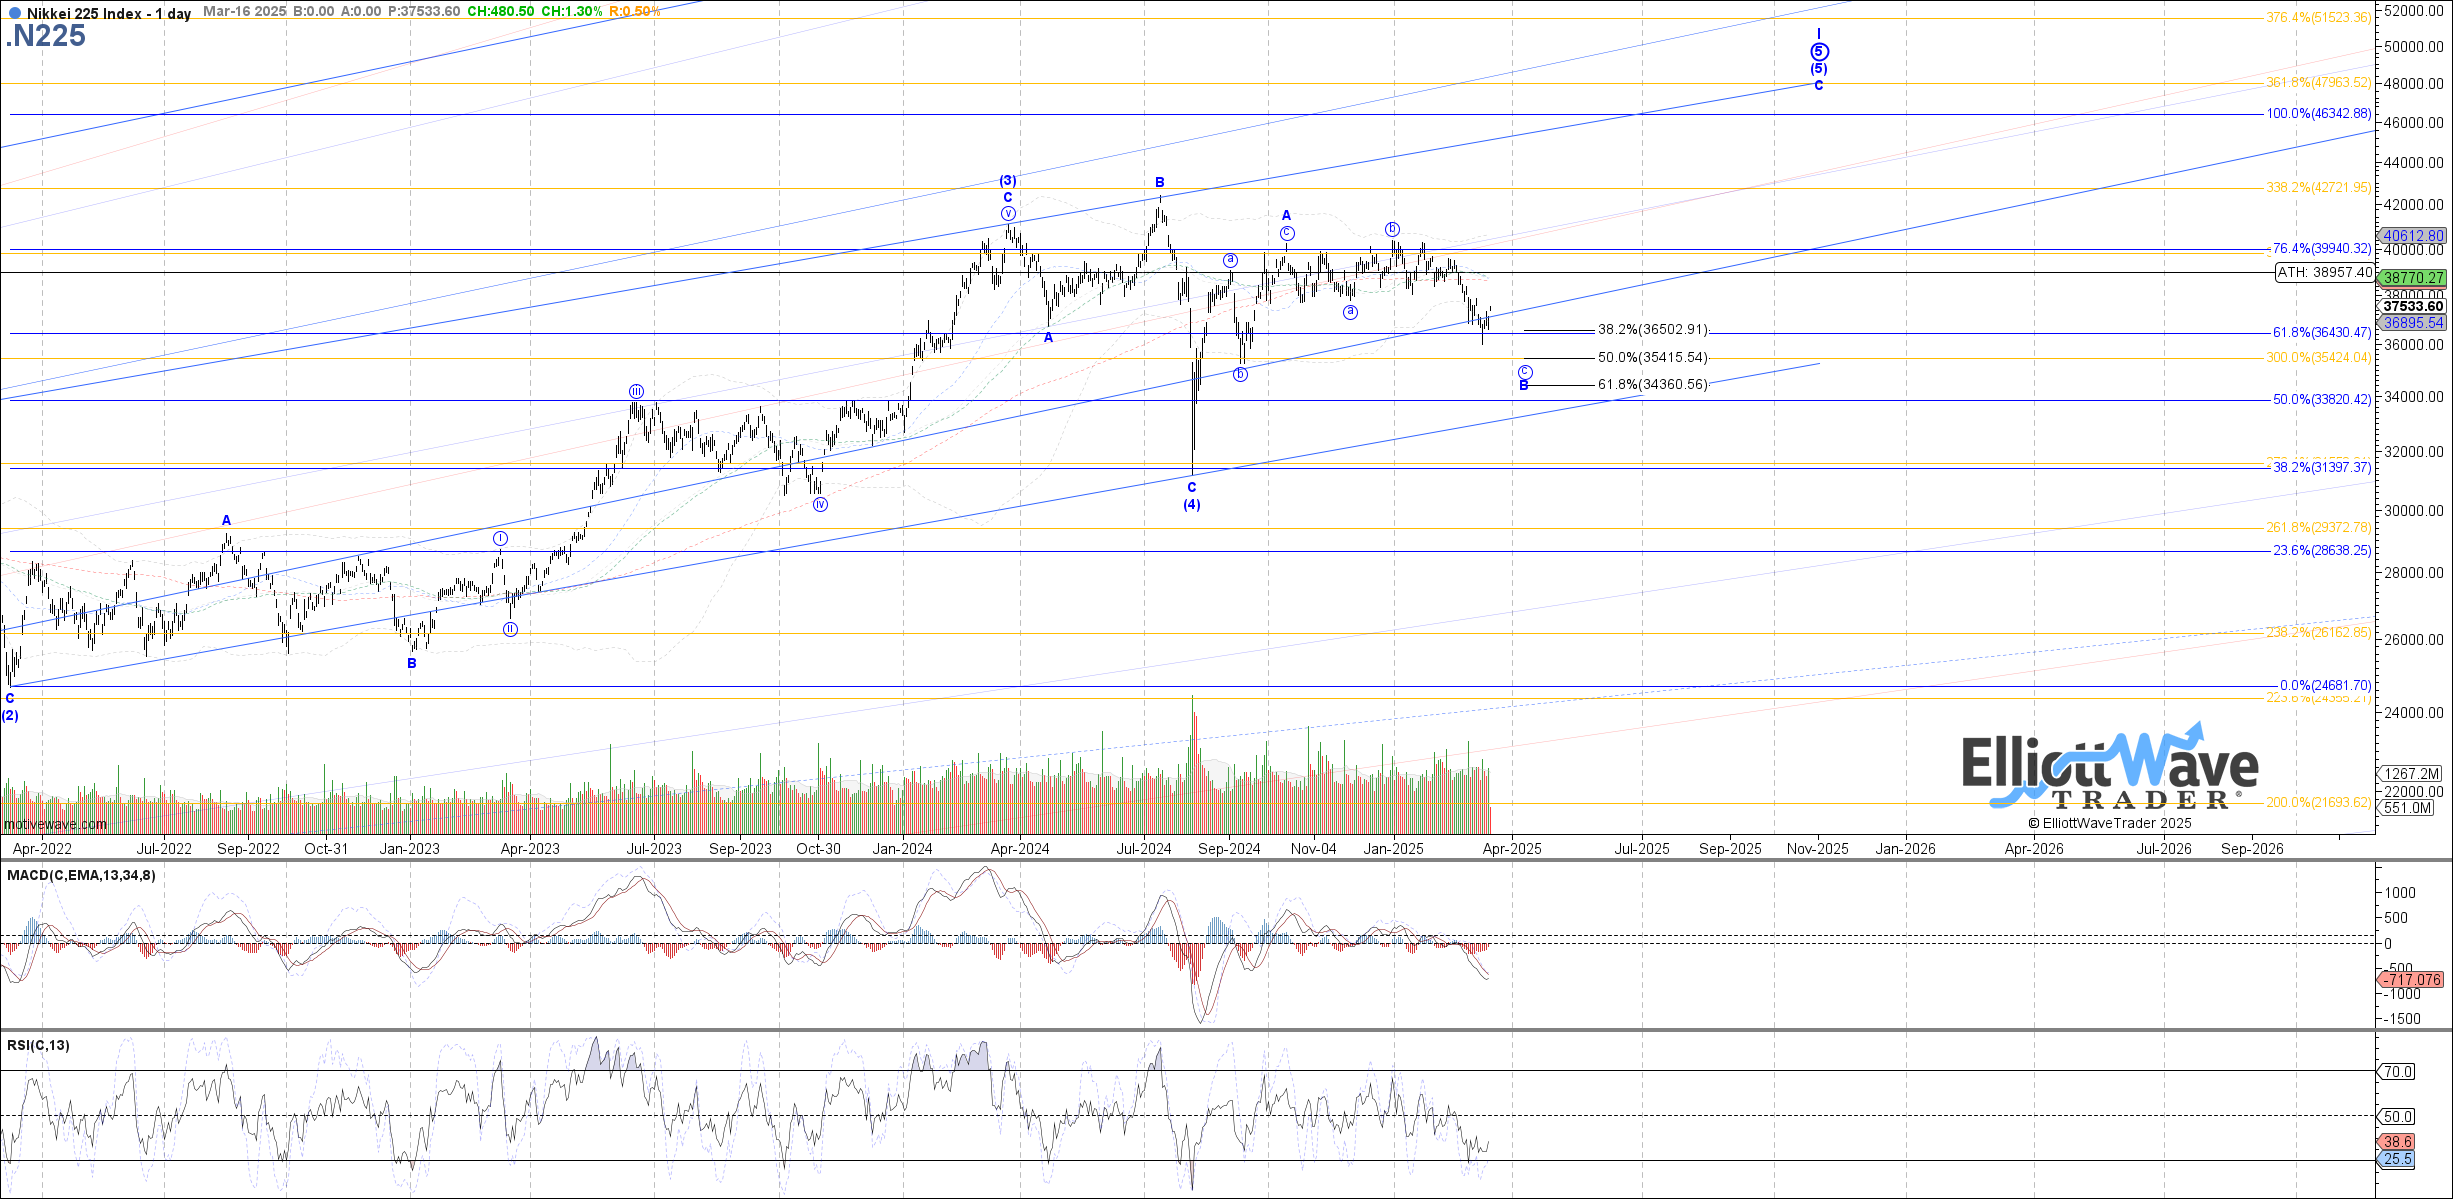
N225: The Nikkei started off initially lower last week, extending further in wave (iii) of c before turning back up during the second half of the week and clearing initial resistance to suggest price is working on the wave (iv) of c bounce now. Based on that expectation, 37570 – 38580 remains the overall target range expected to be reached before wave (iv) of c completes. Unless 38580 is cleared, another low as wave (v) of c is expected to follow.
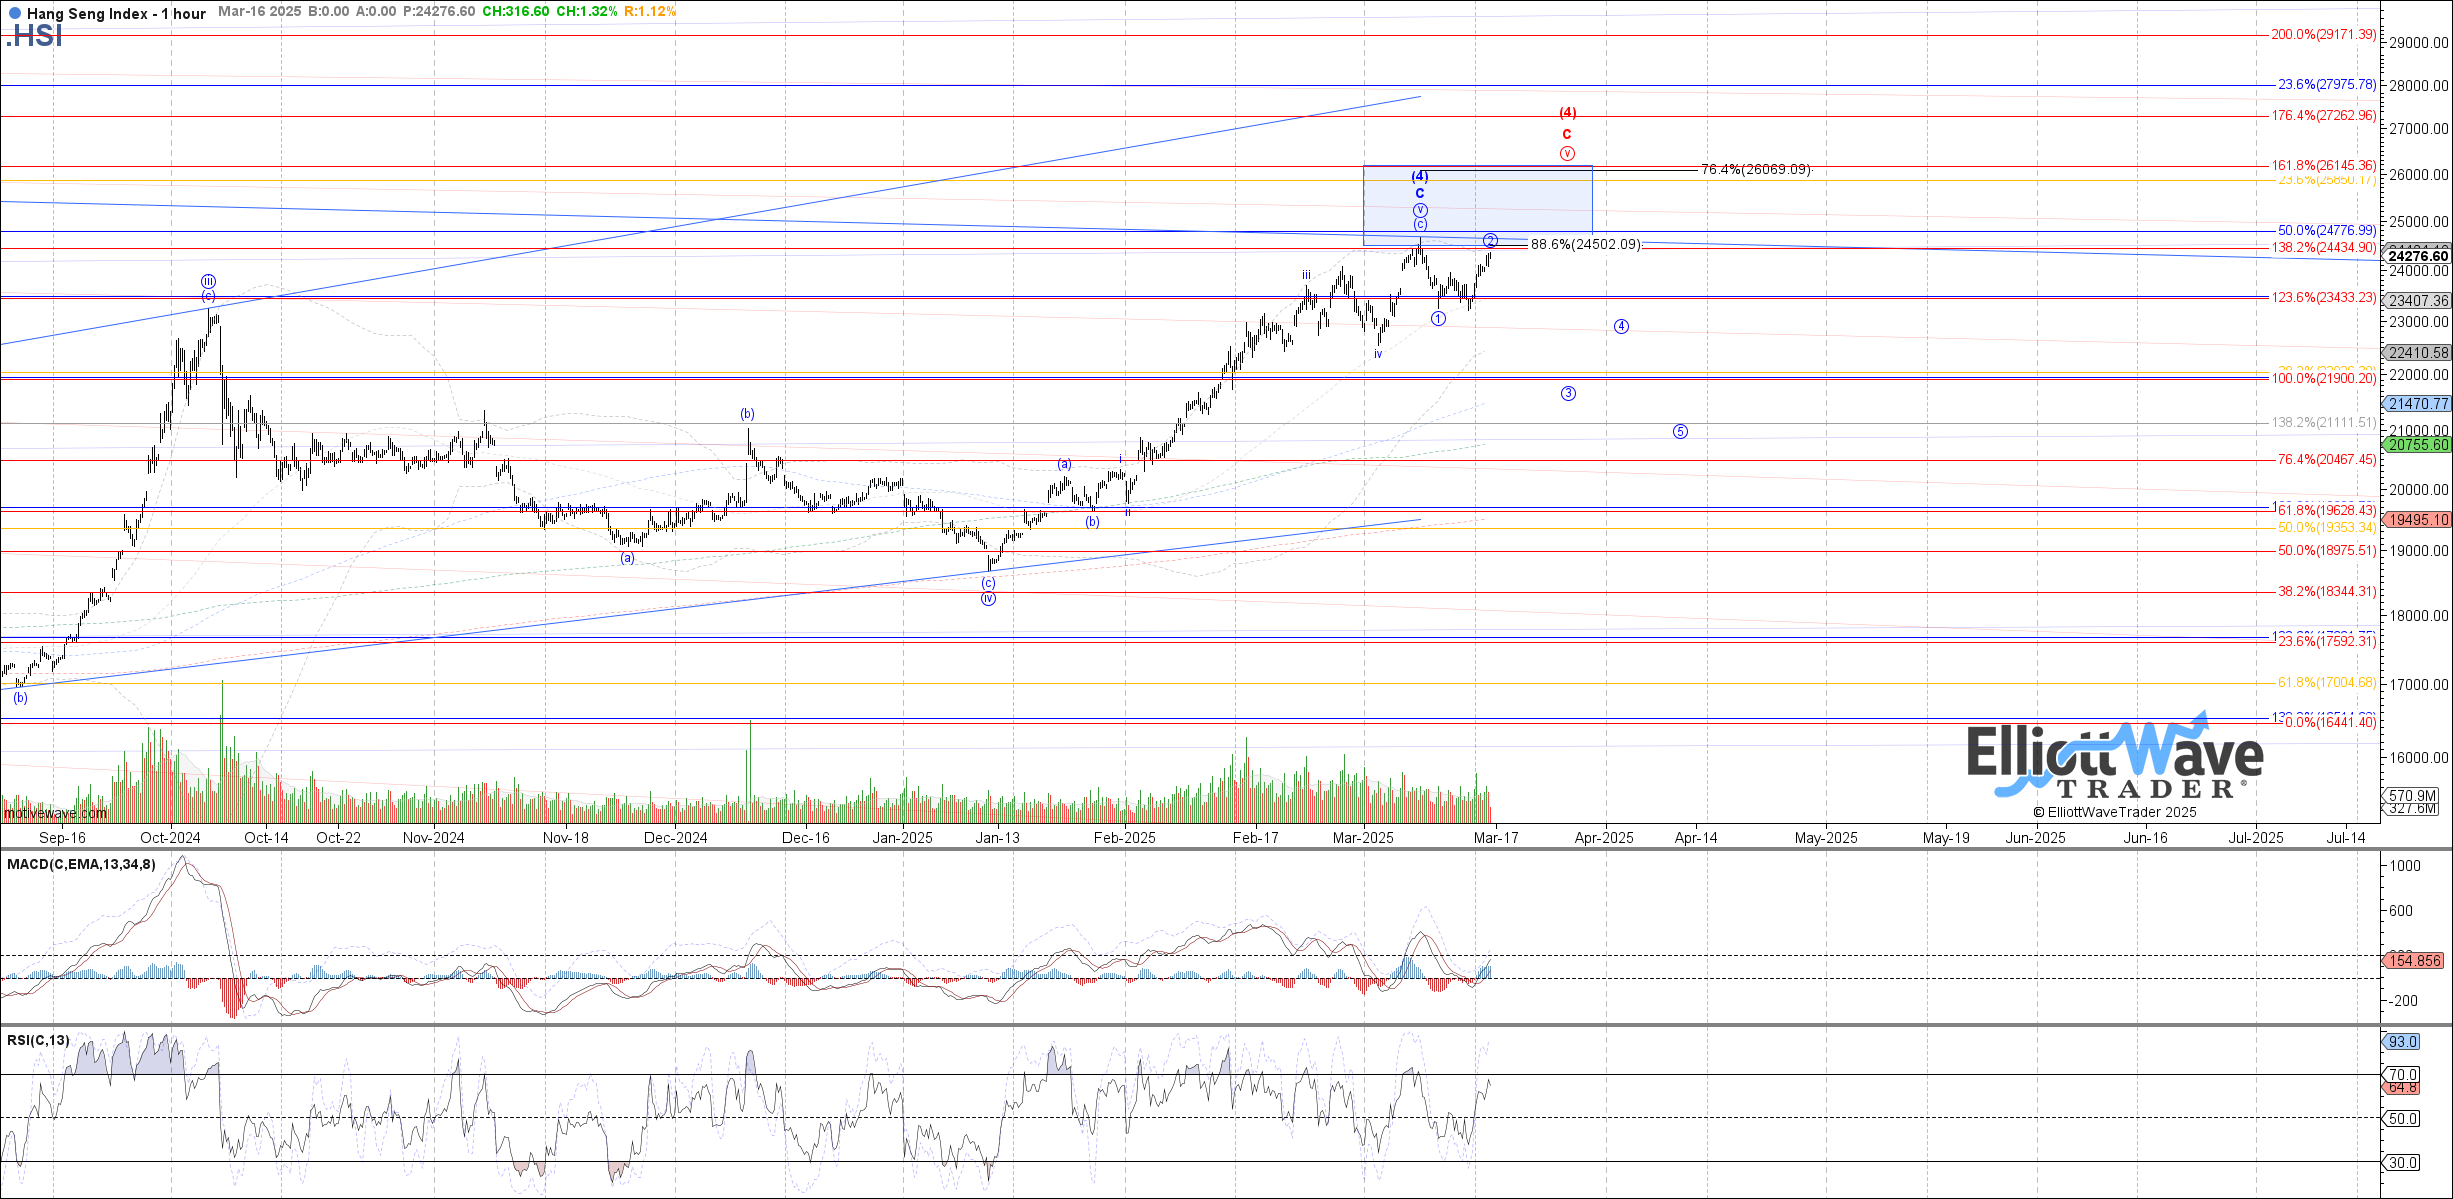
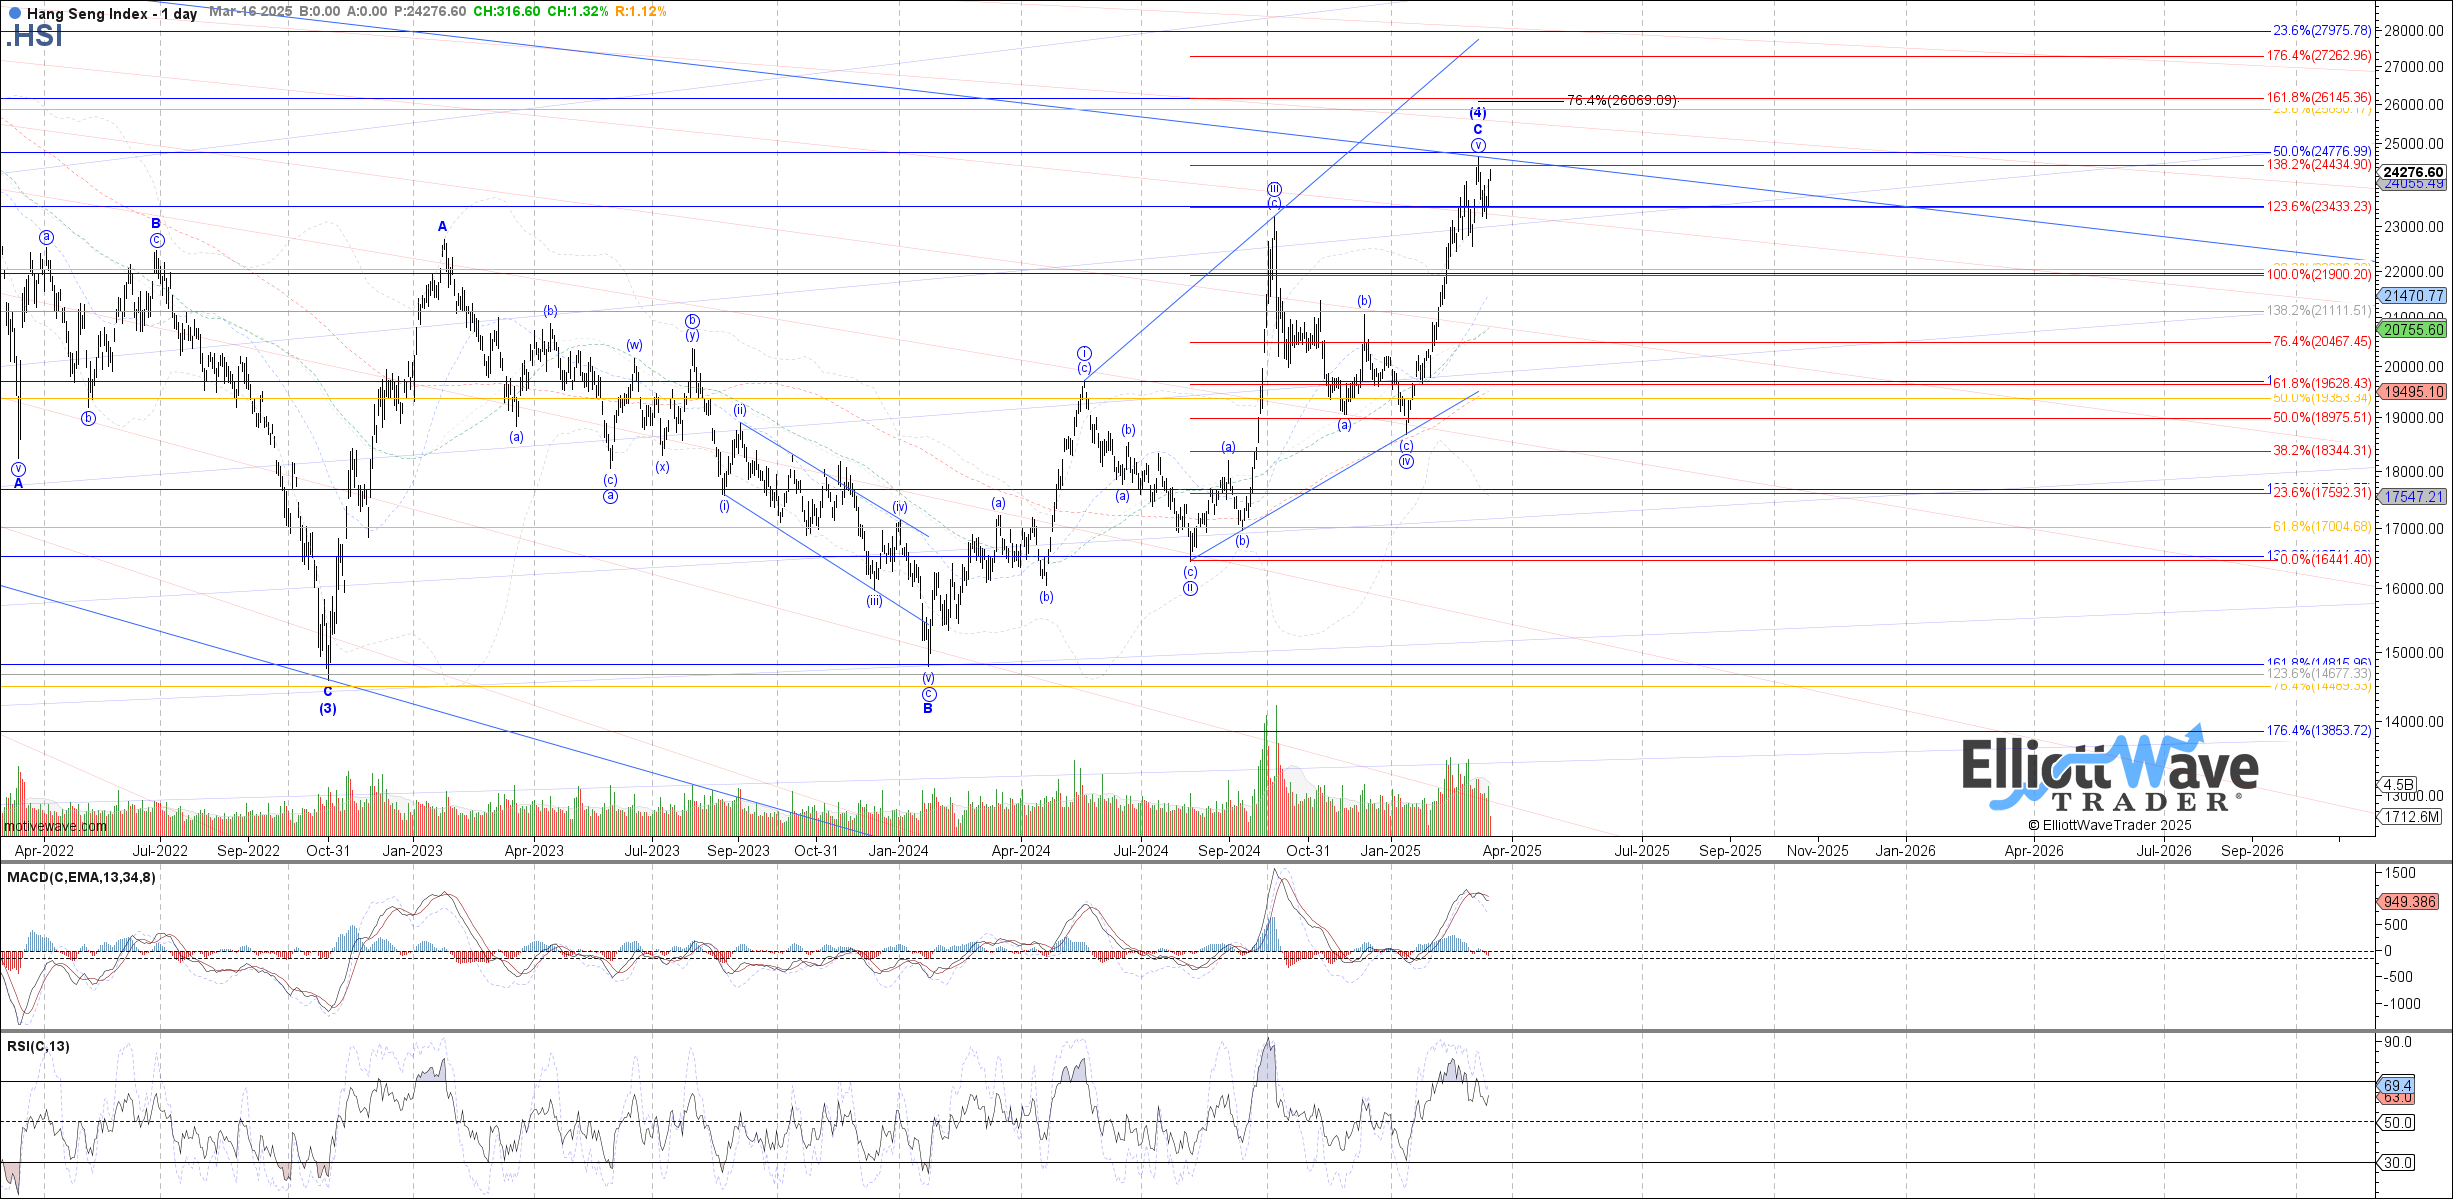
HSI: The Hang Seng also started off last week initially lower but then bounced during the second half of the week. With price still above the March low, there is not clear evidence of a top struck as wave C of (4) yet, and another high deeper into the blue target box is possible until then. However, if price holds a lower high on this bounce and then breaks back below last week’s low, that would be a good initial indication of a top.
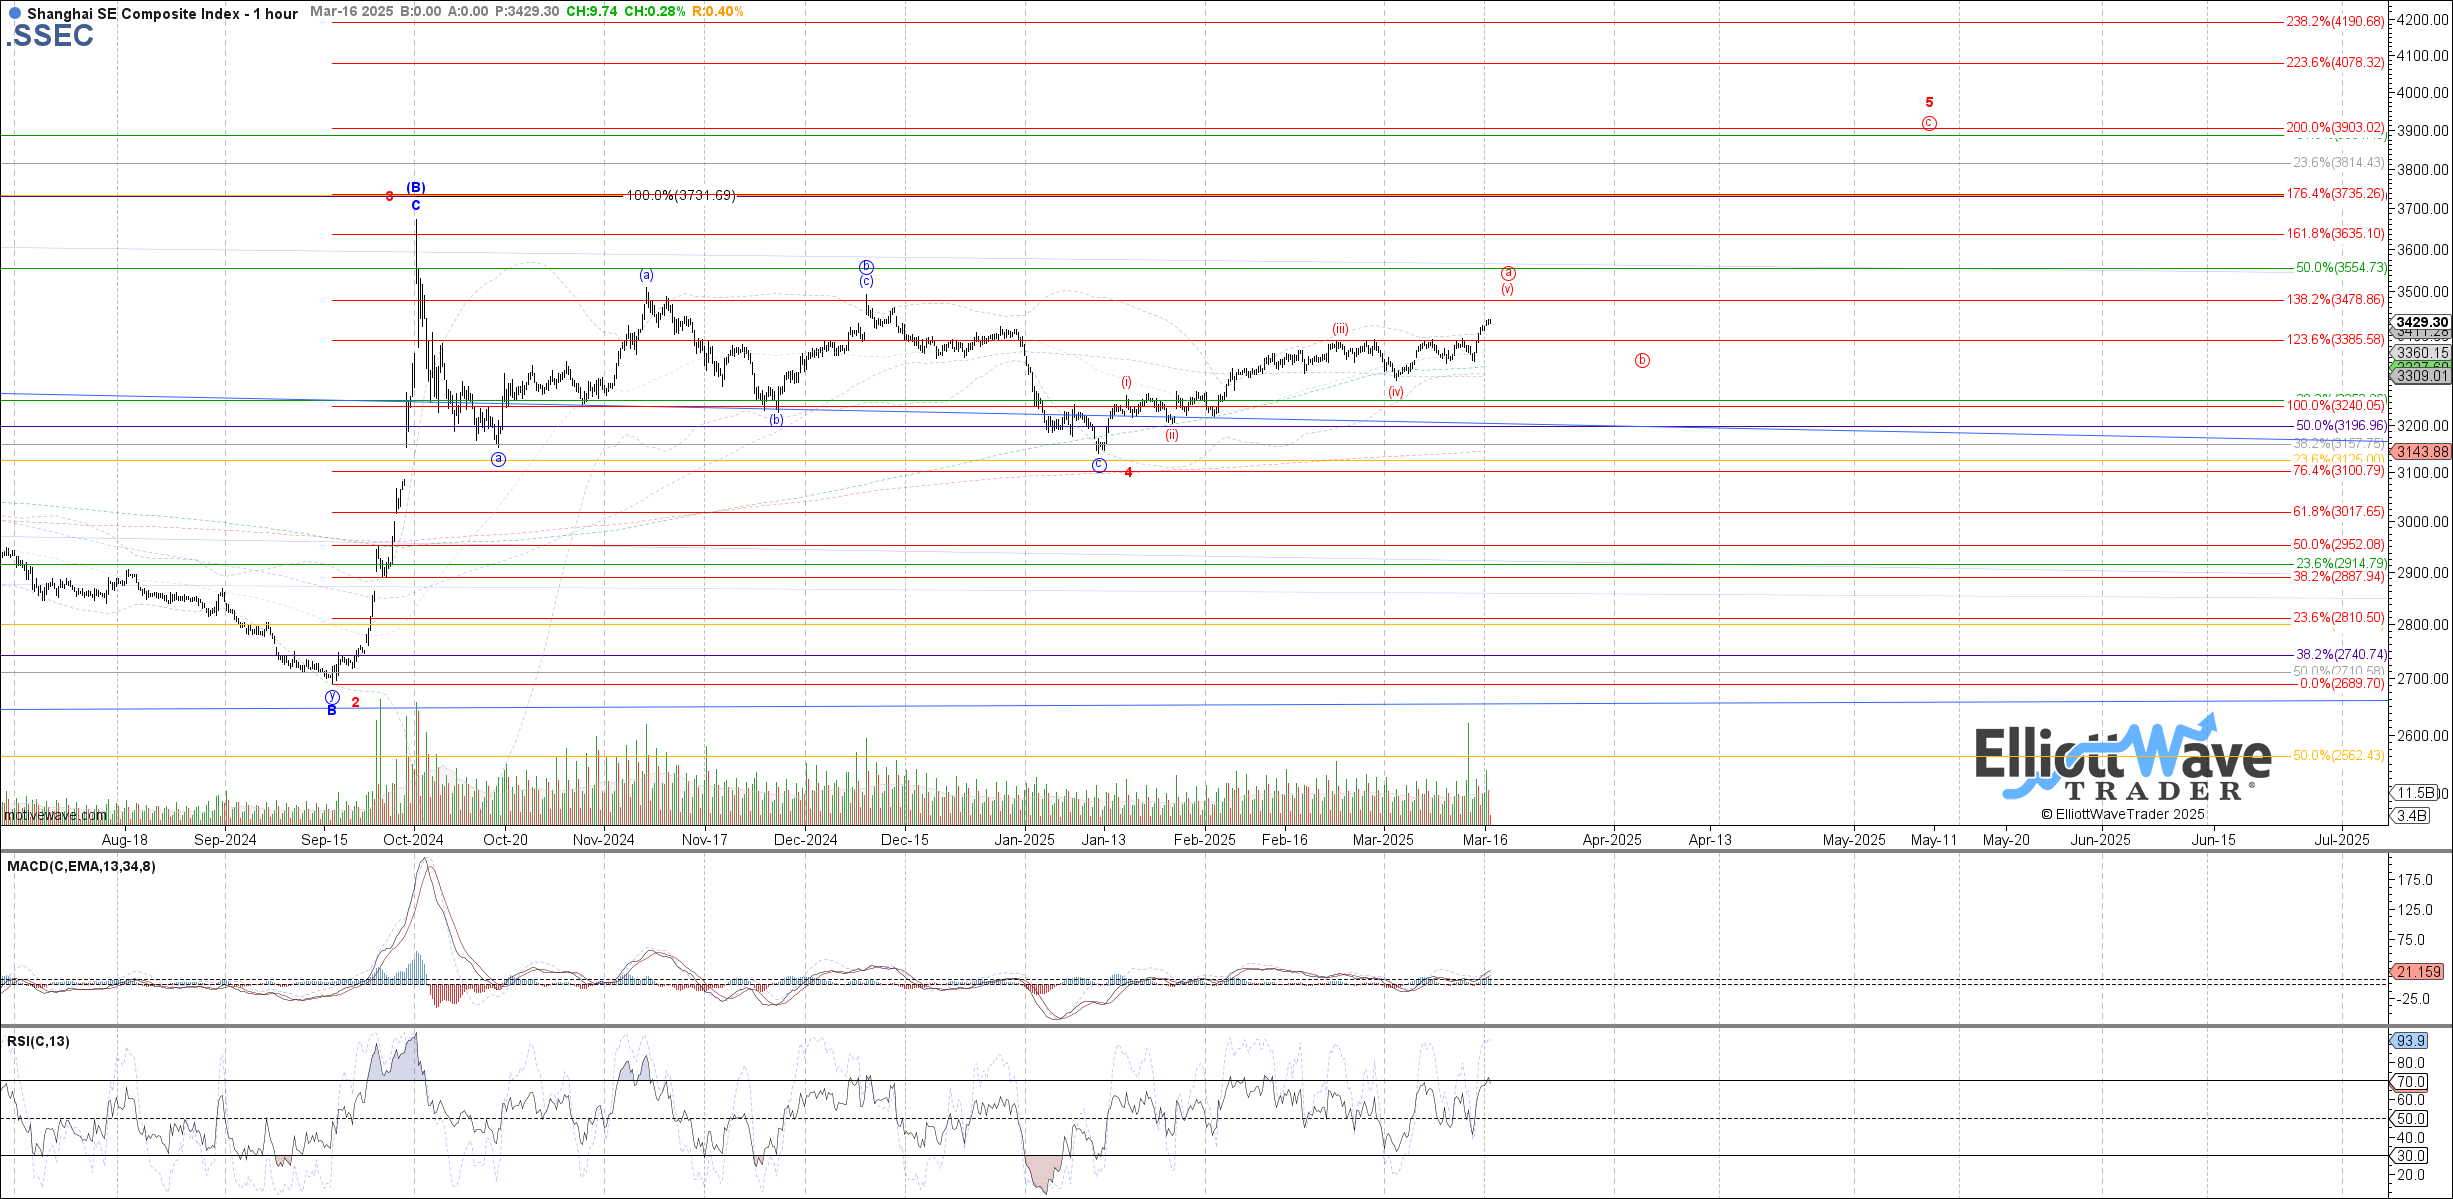
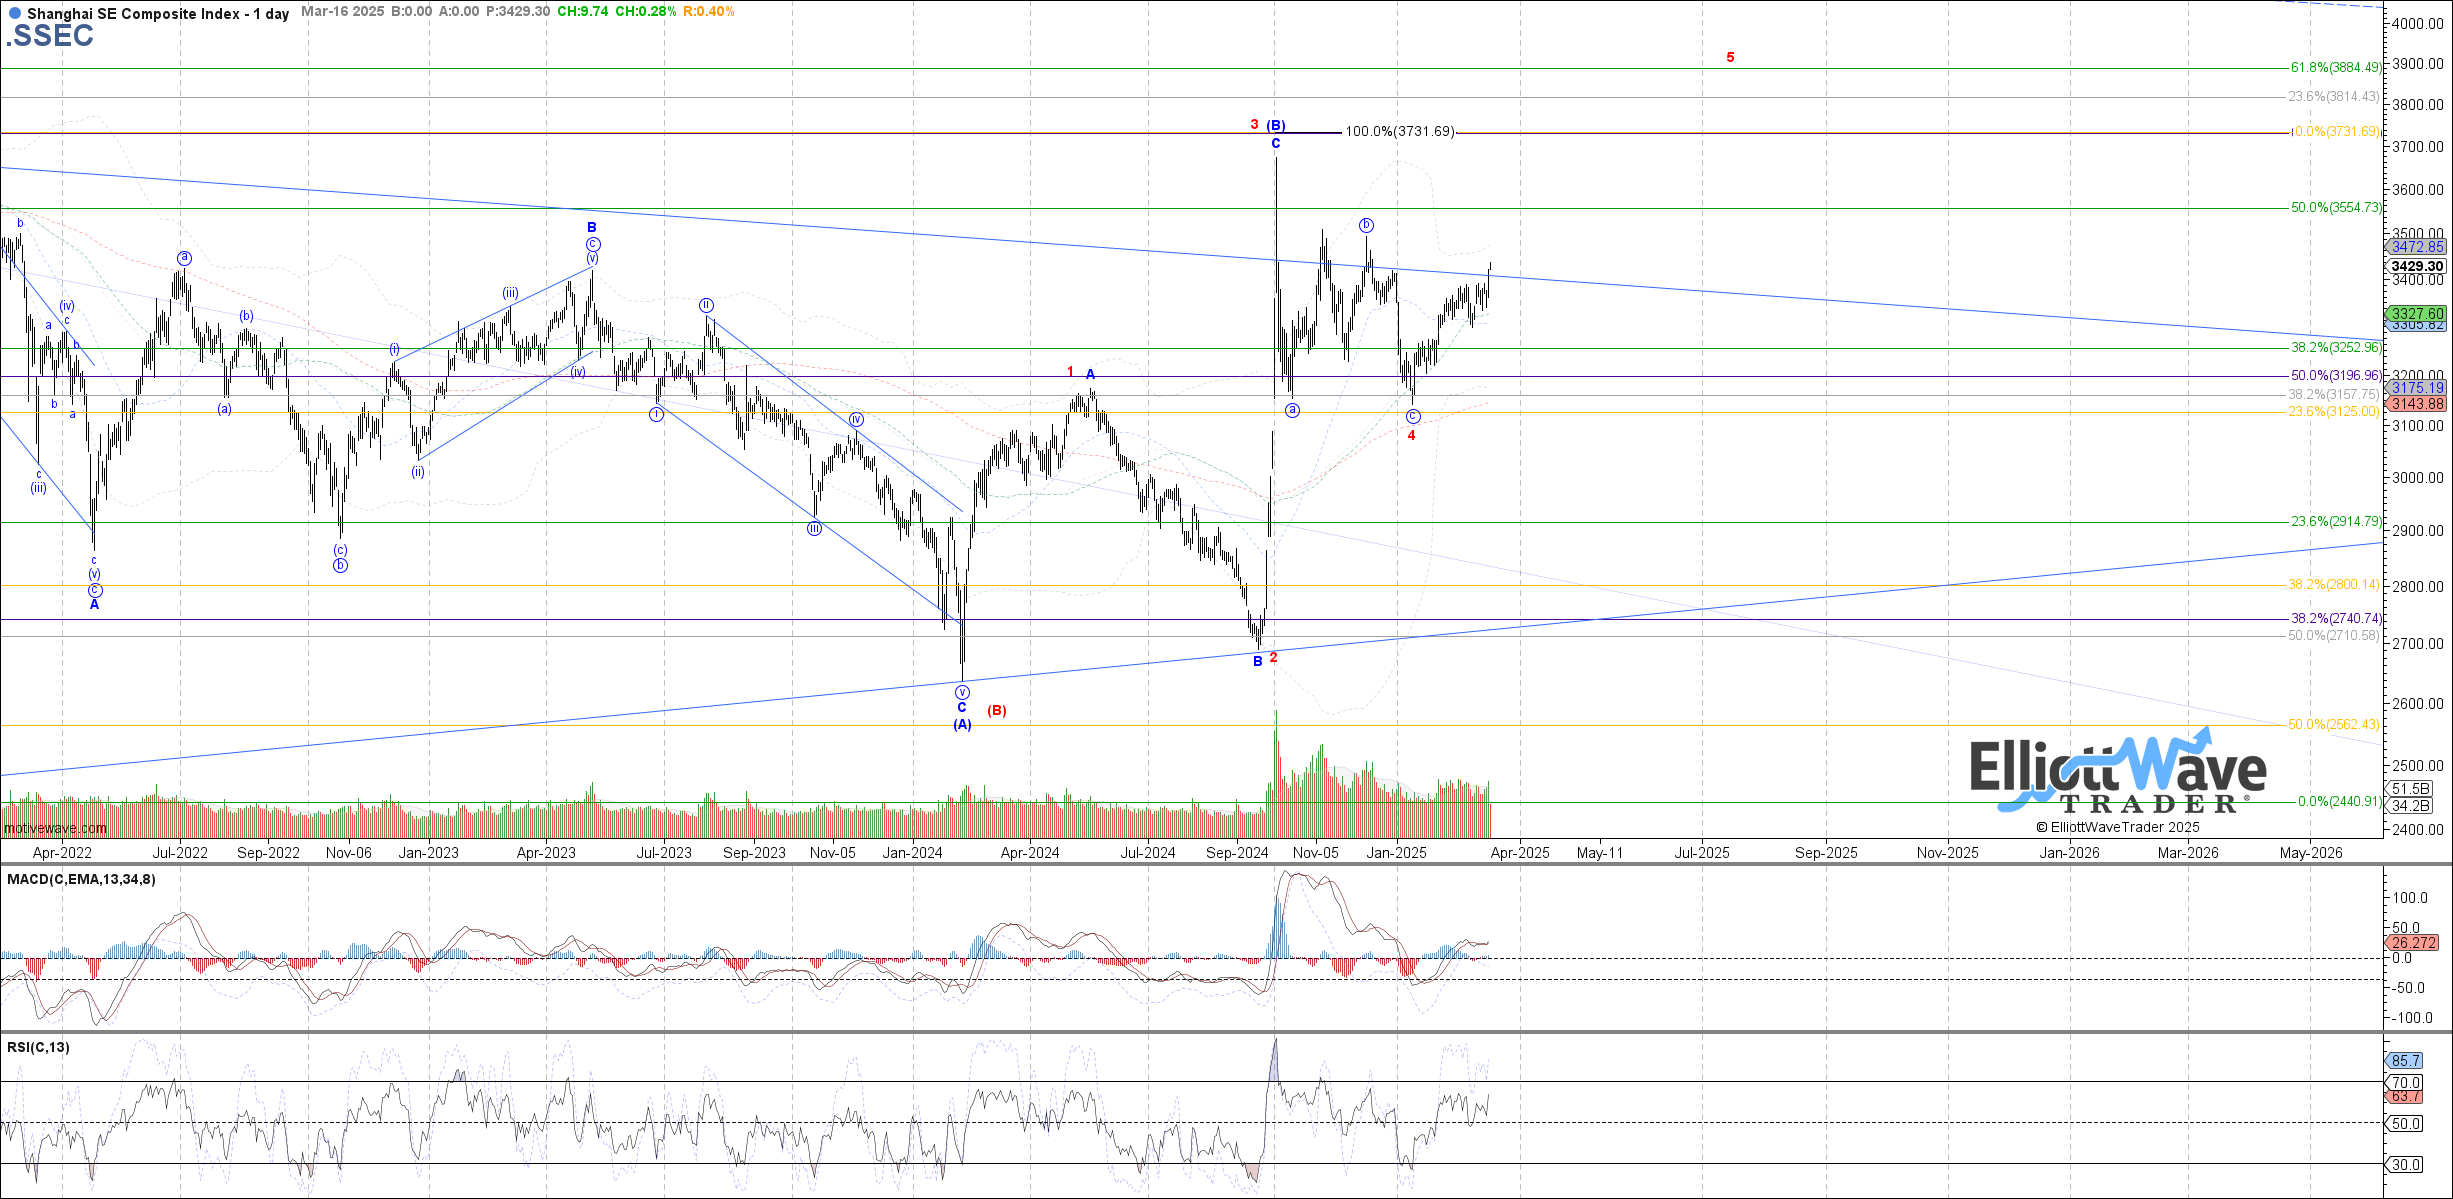
SSEC: The Shanghai Composite traded higher last week, finally breaking above the prior February high to open the door to 5 waves up from the January low. Unless the c-wave of an expanded flat, 5 up from the January low suggests bullish intentions from price, likely as wave a of 5 shown in red. Price can reach a little higher near-term as wave (v) of a before pulling back again in the red b-wave.
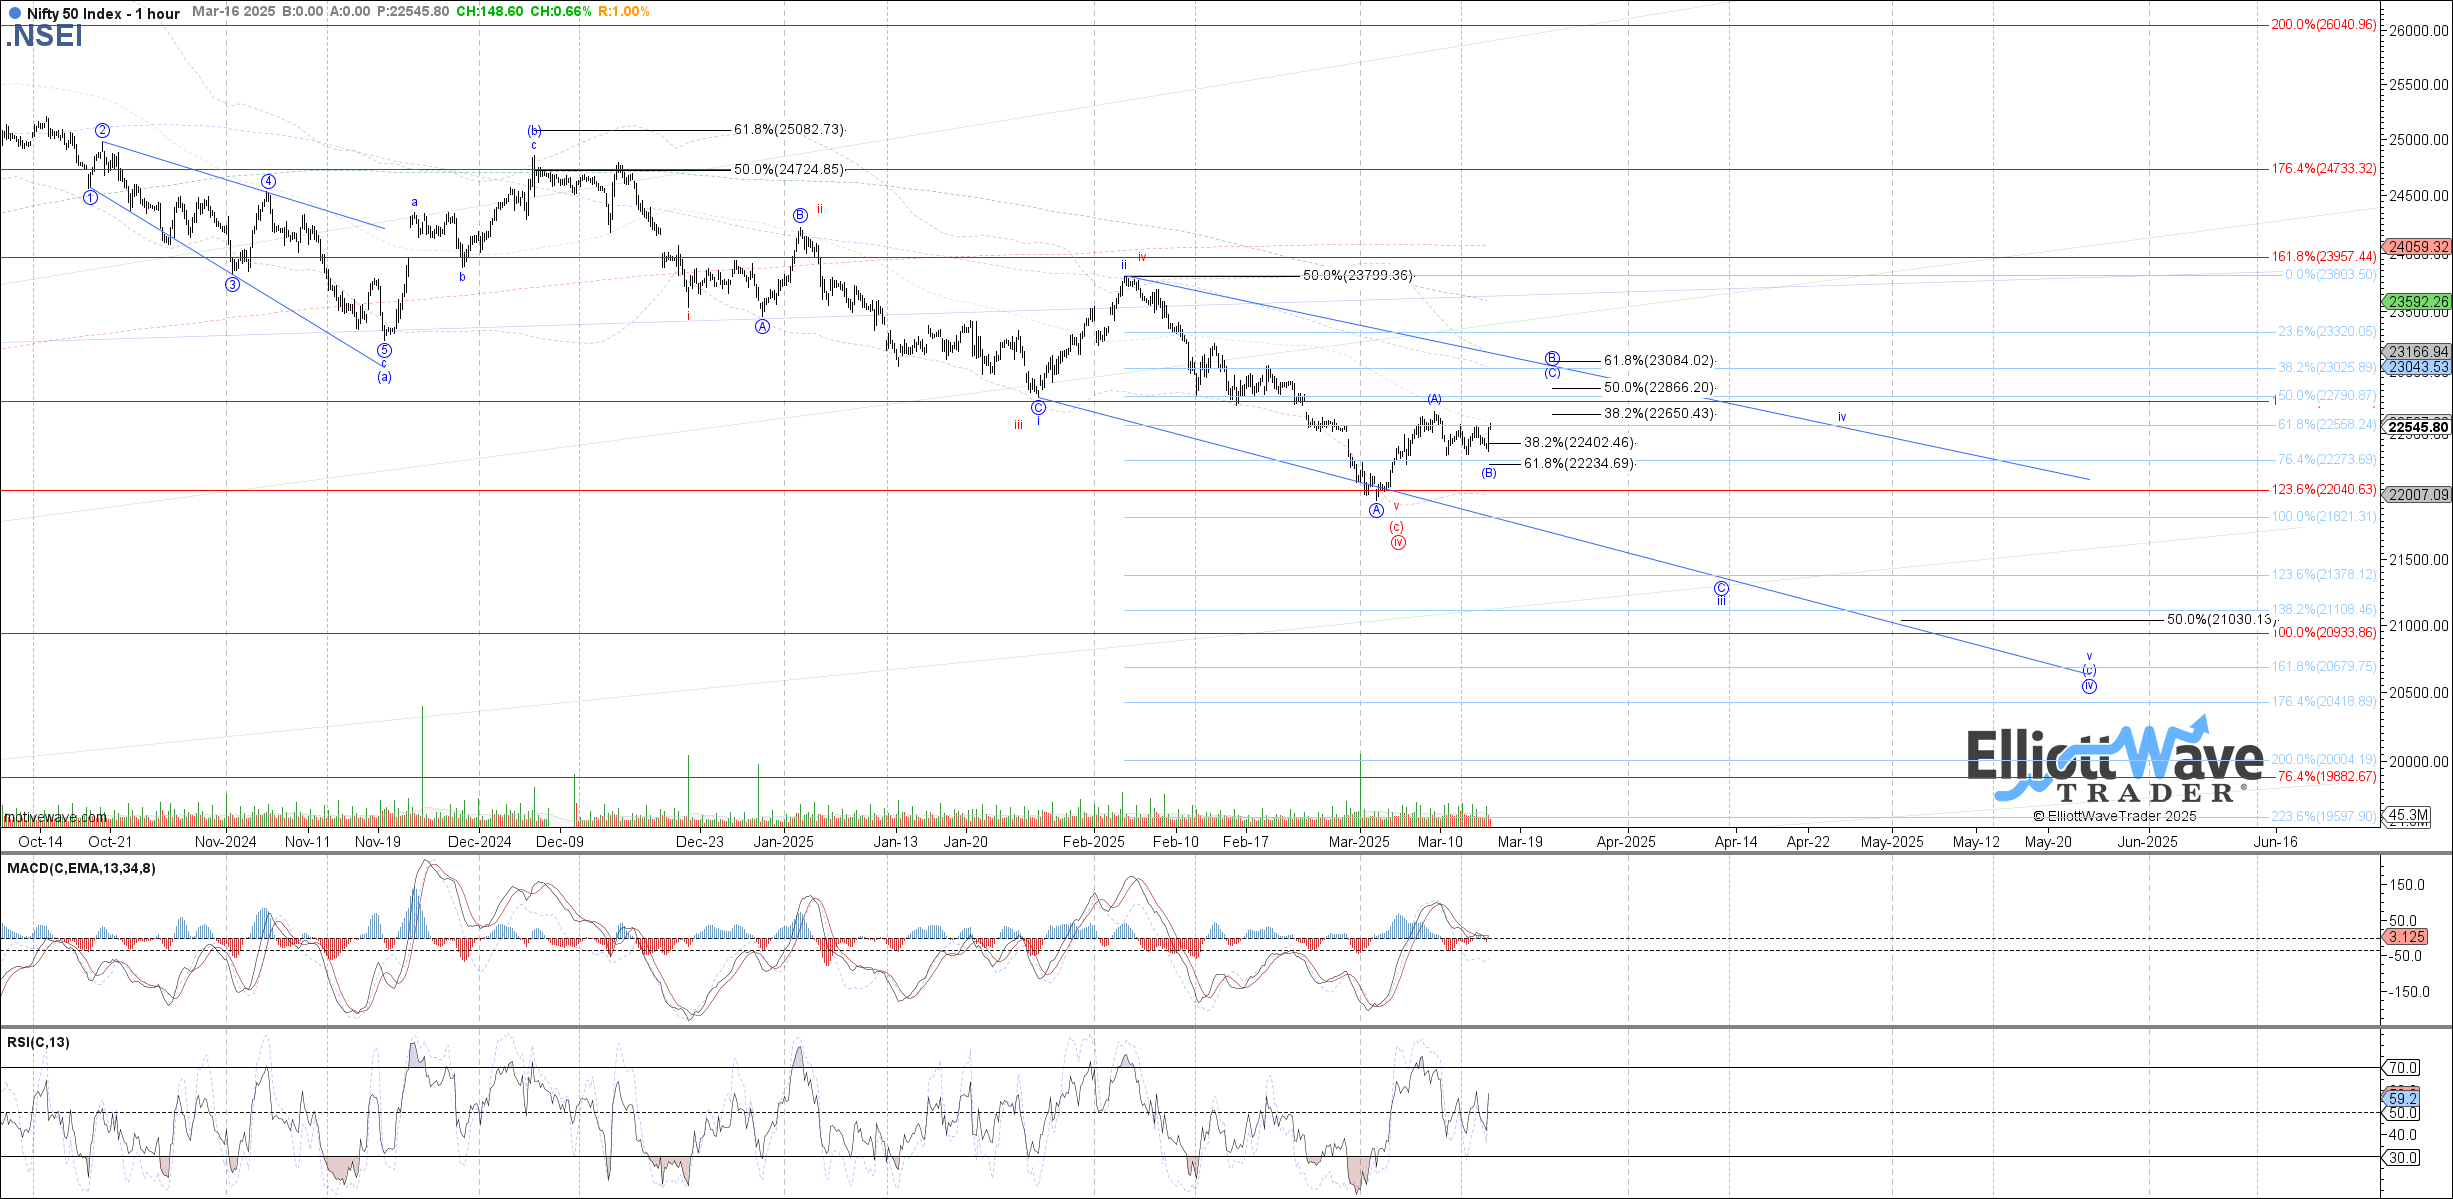
NIFTY: The Nifty started off the week initially lower and then consolidated sideways for the rest of the week. So far price is holding the retrace support cited between 22400 – 22235 for wave (B) of B in the blue count. A break back above the current high on the month would place price in at least blue wave (C) of B with 22865 – 23085 as the next fib targets above. Otherwise, a break back below the March low is needed to confirm all of blue wave B of iii already completed and wave C of iii has started.
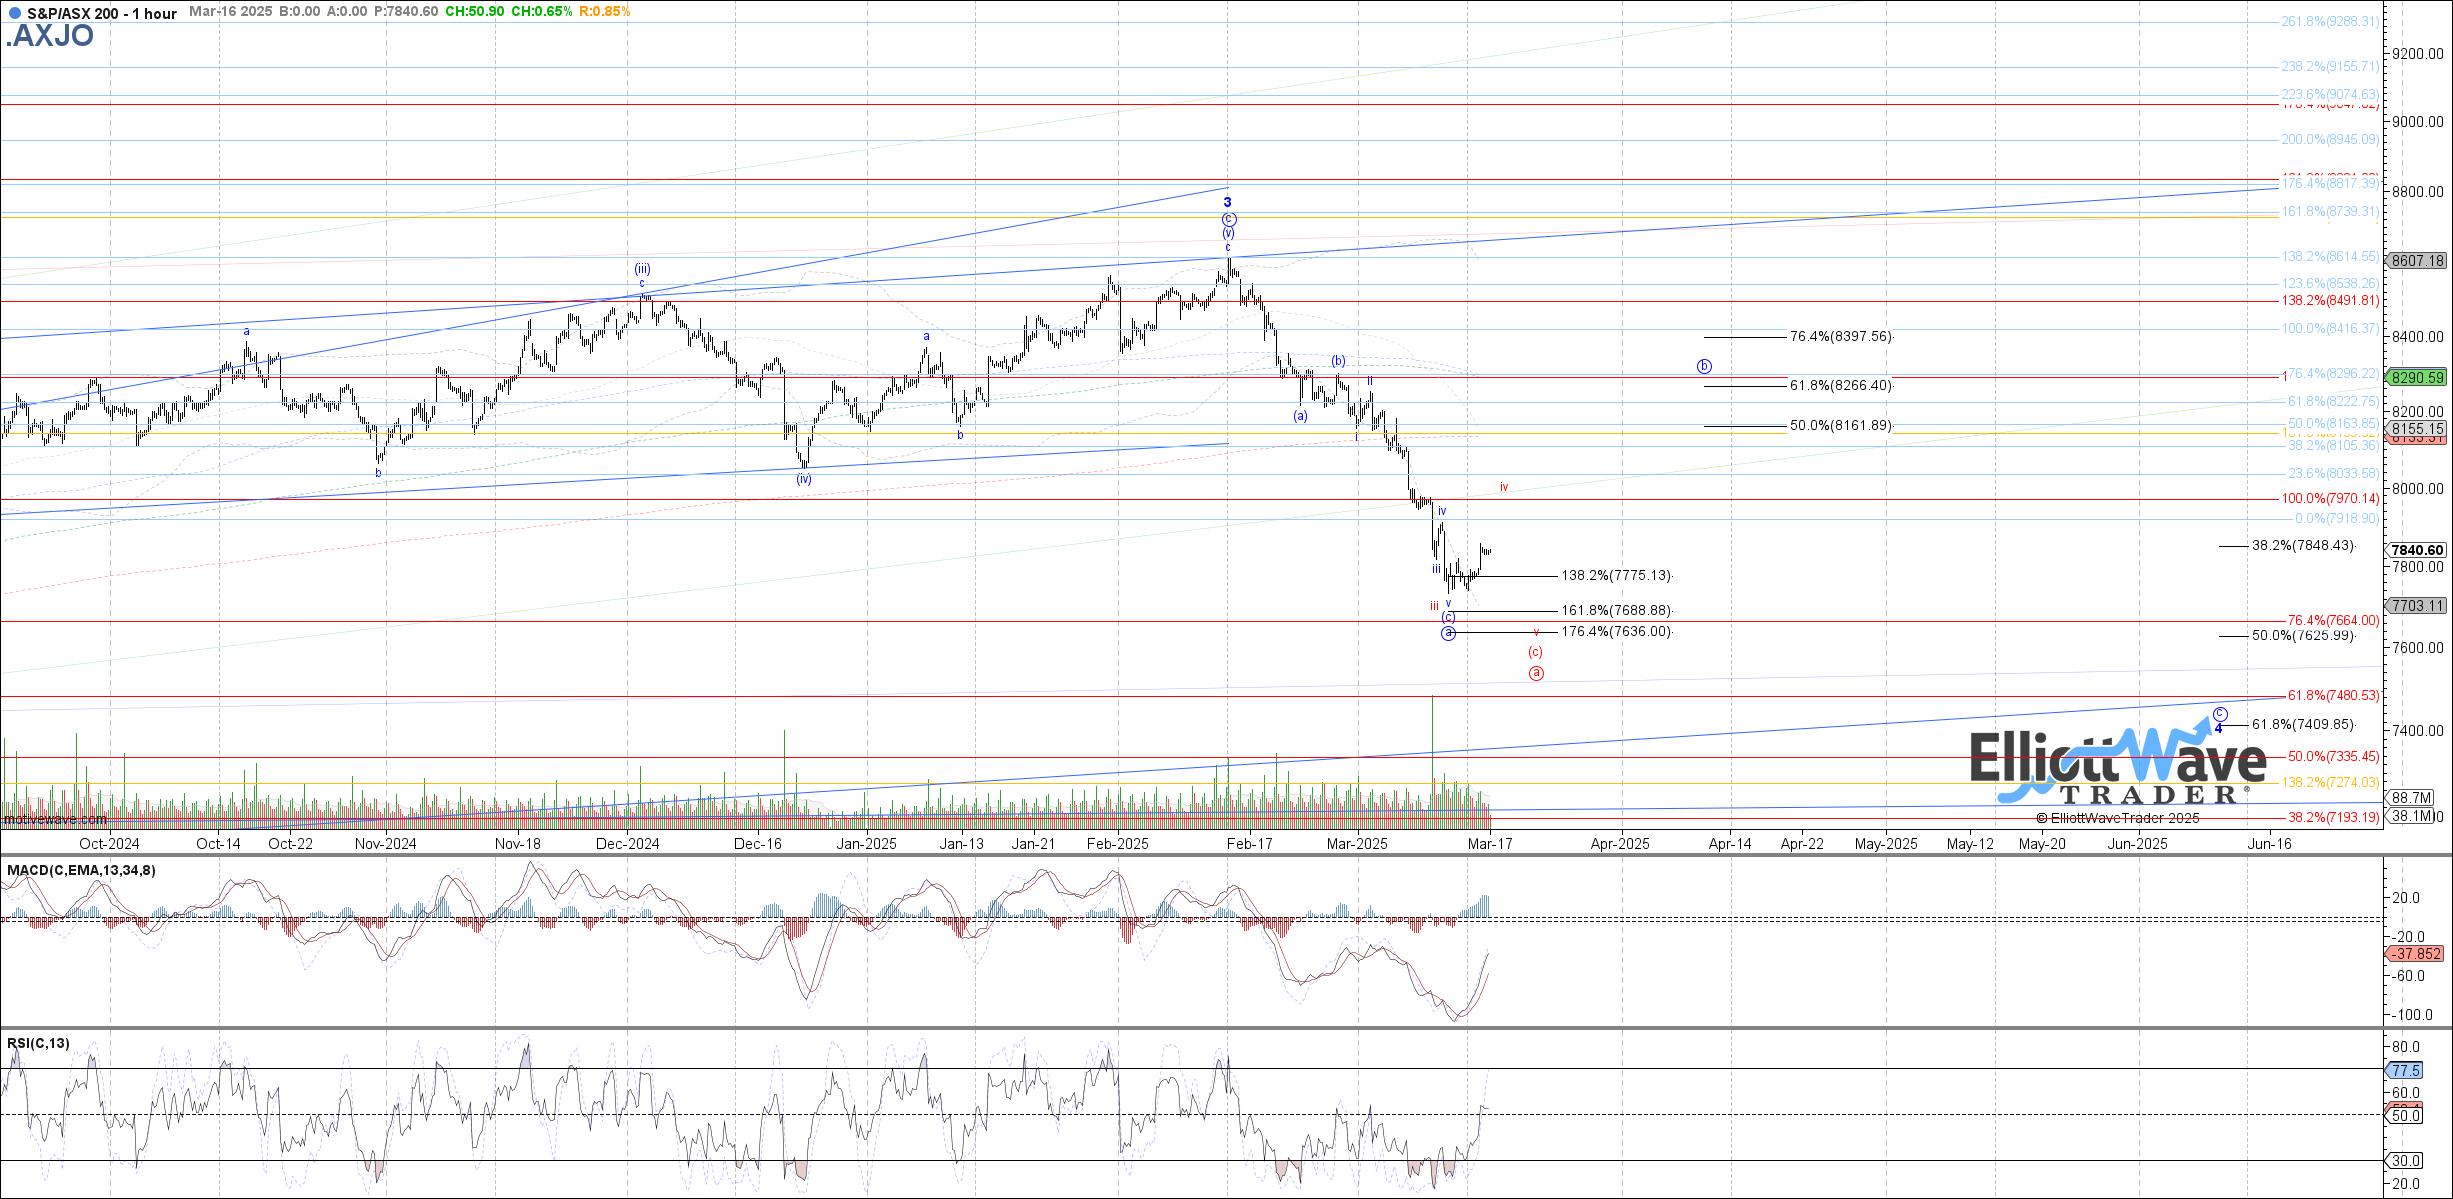
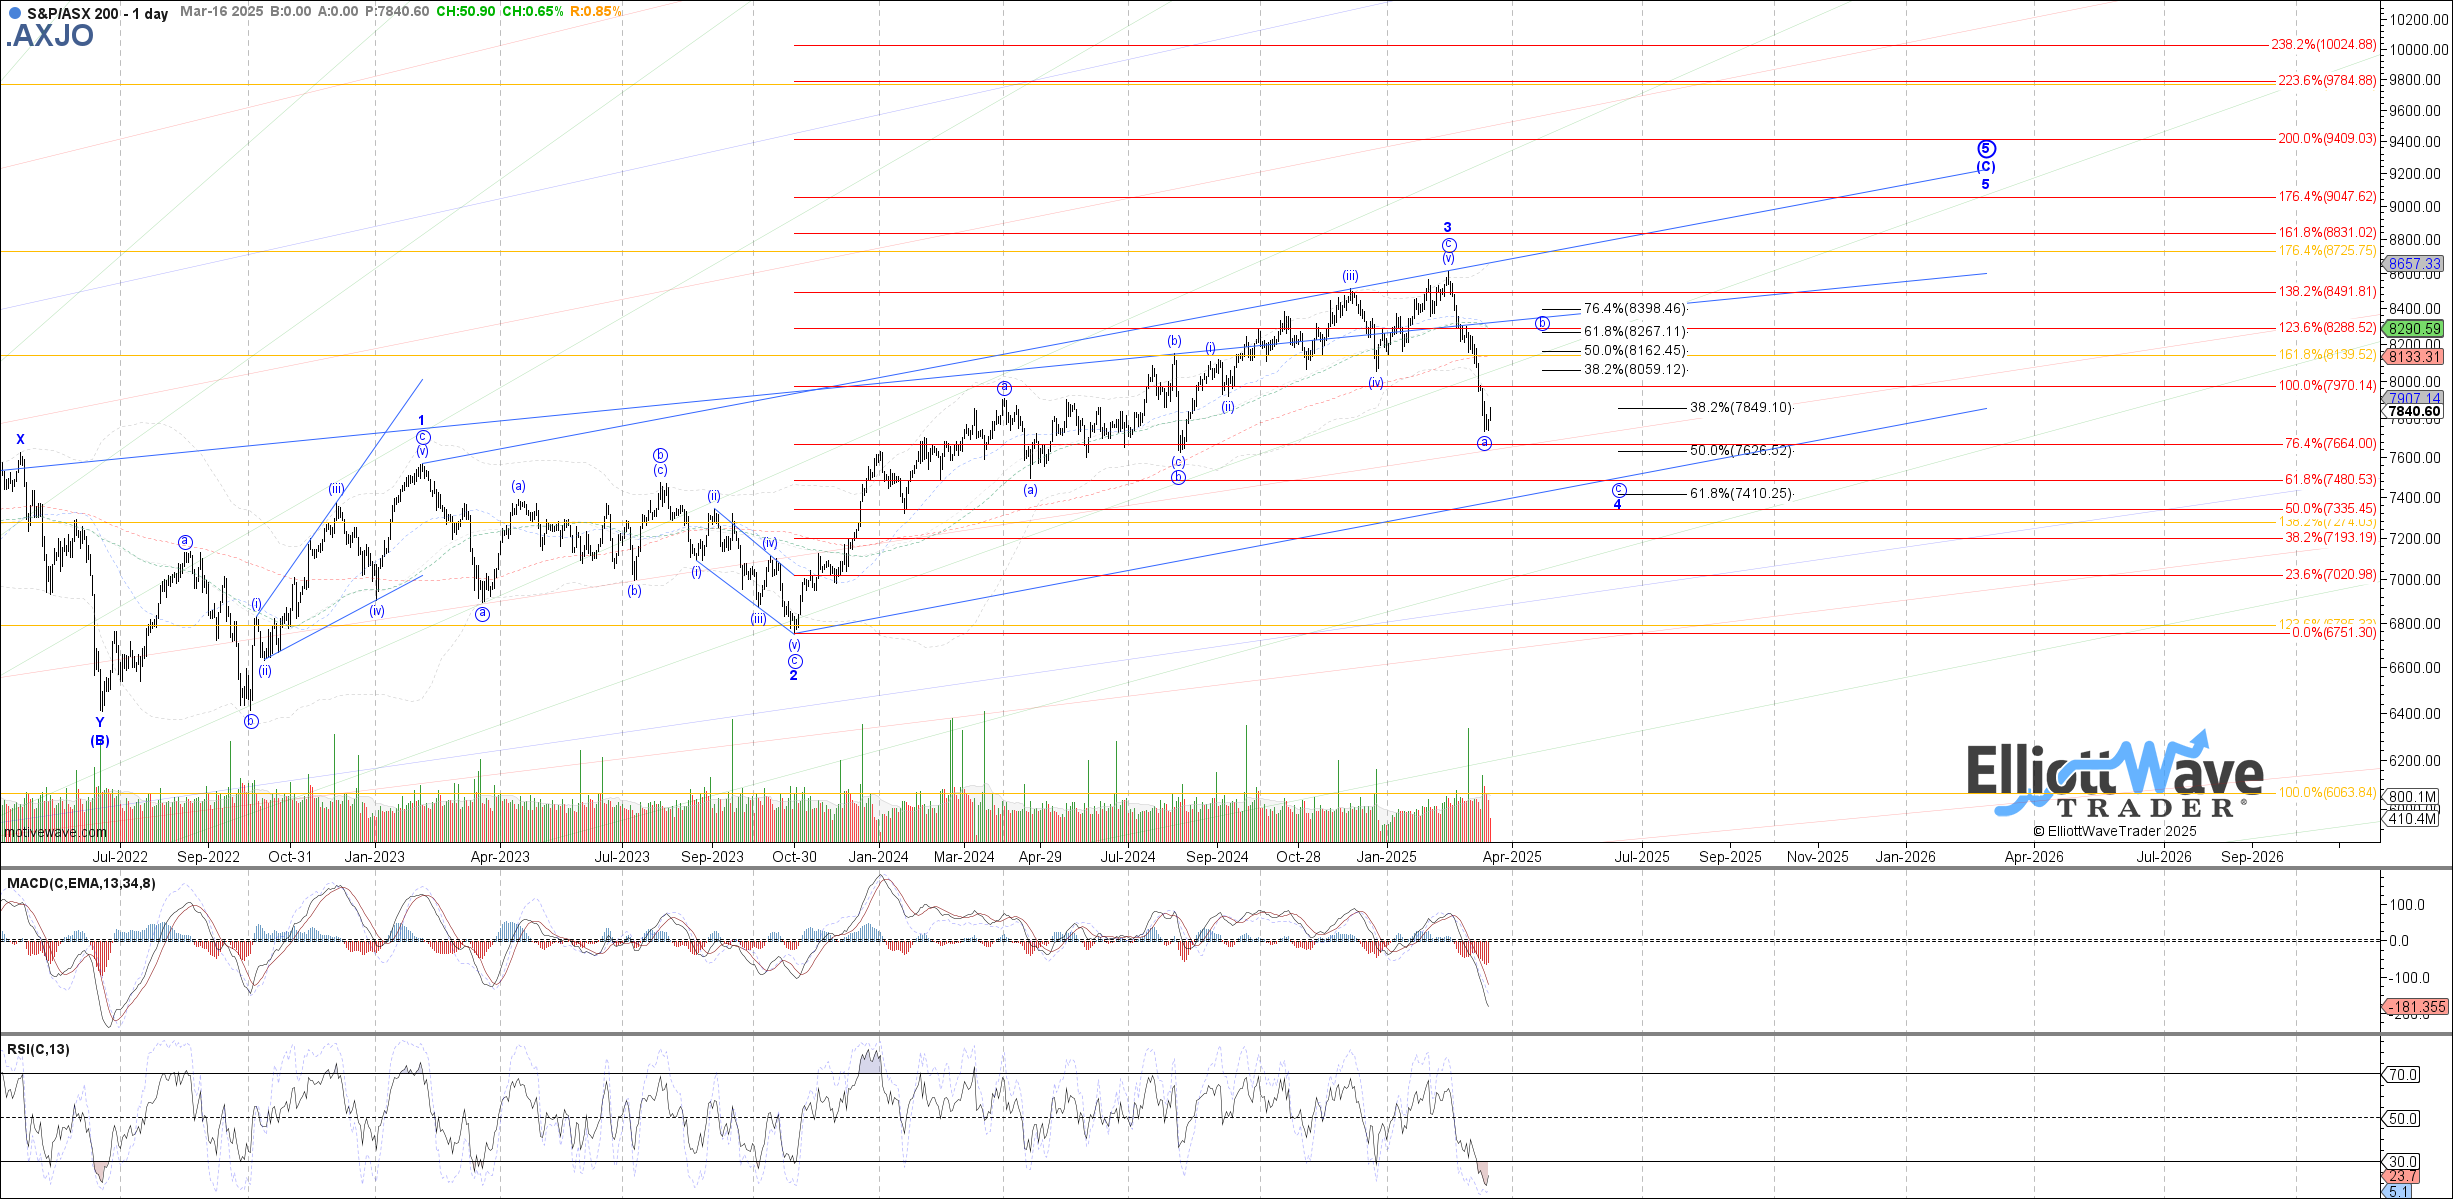
XJO: The ASX continued initially lower last week as further extension of wave a of 4 off the February high. Although price has started to bounce a bit from last week’s low, it has not yet cleared enough resistance to confirm that a b-wave bounce has cited which requires a break back above 7990. Until then, the risk is this bounce is just wave iv of (c) shown in red.